Monitoring MaxDB
eG Enterprise offers a specialized monitoring model (see Figure 1) for the MaxDB server using which the following queries can be effectively answered:
- Is a connection to the database available?
- Is the OMS heap been excessively utilized?
- Is there enough free space in the data area for permanent data, or is the temporary data occupying a large portion of it?
- Have locks been held for too long a time? Are deadlocks and lock collisions kept at a minimum?
- Is the log area been used excessively, or are log backups carried out frequently?
- What type of QUERY statements are most often executed on the database? How long does the database server take to execute a simple load query?
- Are many transaction rollbacks happening?
- Does the server handle all I/O requests to it promptly, or are there too many requests pending processing?
- Are all caches adequately sized? Are there excessive cache misses?
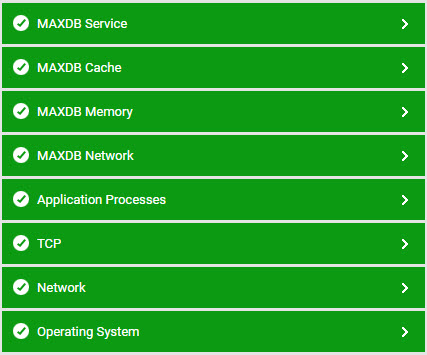
Figure 1 : Layer model of a MaxDB server
Each layer of the MaxDB model of Figure 1 above executes a wide variety of tests on the server to assess its health. Typically, these tests connect to a database on the MaxDB server as a SYSDBA, access certain key system tables on the database, and pull out critical performance statistics pertaining to the MaxDB server from the system tables. To enable the eG agent to establish the database connection and perform metrics collection, the agent needs to be configured with the SAP MaxDB JDBC Driver and the DBM and Loader Java classes. Pre-requisites for Monitoring MaxDB and Configuring the Max DB Server describe how to achieve the same.