App-V Publishing Admin Log Test
This test reports the statistical information about the Publishing Admin Log related events generated by the target system.
Target of the test : An APP-V Management Server
Agent deploying the test : An internal agent
Outputs of the test : One set of results for the Filter configured for the App-V Management server that is to be monitored.
| Parameter | Description |
|---|---|
|
Test period |
How often should the test be executed |
|
Host |
The IP address of the host for which this test is to be configured. |
|
Port |
The port at which the specified host listens. By default, this is 8080. |
|
LogType |
Refers to the type of event logs to be monitored. The default value is Microsoft-AppV-Server-Publishing/Admin. |
|
Policy Based Filter |
Using this page, administrators can configure the event sources, event IDs, and event descriptions to be monitored by this test. In order to enable administrators to easily and accurately provide this specification, this page provides the following options:
For explicit, manual specification of the filter conditions, select the No option against the Policy Based Filter field. This is the default selection. To choose from the list of pre-configured filter policies, or to create a new filter policy and then associate the same with the test, select the Yes option against the Policy Based Filter field. |
|
Filter |
If the Policy Based Filter flag is set to No, then a Filter text area will appear, wherein you will have to specify the event sources, event IDs, and event descriptions to be monitored. This specification should be of the following format: {Displayname}:{event_sources_to_be_included}:{event_sources_to_be_excluded}:{event_IDs_to_be_included}:{event_IDs_to_be_excluded}:{event_descriptions_to_be_included}:{event_descriptions_to_be_excluded}. For example, assume that the Filter text area takes the value, OS_events:all:Browse,Print:all:none:all:none. Here:
By default, the Filter parameter contains the value: all. Multiple filters are to be separated by semi-colons (;). Note: The event sources and event IDs specified here should be exactly the same as that which appears in the Event Viewer window. On the other hand, if the Policy Based Filter flag is set to Yes, then a Filter list box will appear, displaying the filter policies that pre-exist in the eG Enterprise system. A filter policy typically comprises of a specific set of event sources, event IDs, and event descriptions to be monitored. This specification is built into the policy in the following format: {Policyname}:{event_sources_to_be_included}:{event_sources_to_be_excluded}:{event_IDs_to_be_included}:{event_IDs_to_be_excluded}:{event_descriptions_to_be_included}:{event_descriptions_to_be_excluded} To monitor a specific combination of event sources, event IDs, and event descriptions, you can choose the corresponding filter policy from the Filter list box. Multiple filter policies can be so selected. Alternatively, you can modify any of the existing policies to suit your needs, or create a new filter policy. To facilitate this, a |
|
UseWMI |
The eG agent can either use WMI to extract event log statistics or directly parse the event logs using event log APIs. If the UseWMI flag is Yes, then WMI is used. If not, the event log APIs are used. This option is provided because on some Windows NT/2000 systems (especially ones with service pack 3 or lower), the use of WMI access to event logs can cause the CPU usage of the WinMgmt process to shoot up. On such systems, set the UseWMI parameter value to No. On the other hand, when monitoring systems that are operating on any other flavor of Windows (say, Windows 2003/XP/2008/7/Vista/12), the UseWMI flag should always be set to ‘Yes’. |
|
Stateless Alerts |
Typically, the eG manager generates email alerts only when the state of a specific measurement changes. A state change typically occurs only when the threshold of a measure is violated a configured number of times within a specified time window. While this ensured that the eG manager raised alarms only when the problem was severe enough, in some cases, it may cause one/more problems to go unnoticed, just because they did not result in a state change. For example, take the case of the EventLog test. When this test captures an error event for the very first time, the eG manager will send out a Critical email alert with the details of the error event to configured recipients. Now, the next time the test runs, if a different error event is captured, the eG manager will keep the state of the measure as Critical, but will not send out the details of this error event to the user; thus, the second issue will remain hidden from the user. To make sure that administrators do not miss/overlook critical issues, the eG Enterprise monitoring solution provides the stateless alertingcapability. To enable this capability for this test, set the Stateless Alerts flag to Yes. This will ensure that email alerts are generated for this test, regardless of whether or not the state of the measures reported by this test changes. |
|
Events During Restart |
By default, the Events During Restart flag is set to Yes. This ensures that whenever the agent is stopped and later started, the events that might have occurred during the period of non-availability of the agent are included in the number of events reported by the agent. Setting the flag to No ensures that the agent, when restarted, ignores the events that occurred during the time it was not available. |
|
DDforInformation |
eG Enterprise also provides you with options to restrict the amount of storage required for event log tests. Towards this end, the DDforInformation and DDforWarning flags have been made available in this page. By default, both these flags are set to Yes, indicating that by default, the test generates detailed diagnostic measures for information events and warning events. If you do not want the test to generate and store detailed measures for information events, set the DDforInformation flag to No. |
|
DDforWarning |
To ensure that the test does not generate and store detailed measures for warning events, set the DDforWarning flag to No. |
|
DD Frequency |
Refers to the frequency with which detailed diagnosis measures are to be generated for this test. The default is 1:1. This indicates that, by default, detailed measures will be generated every time this test runs, and also every time the test detects a problem. You can modify this frequency, if you so desire. Also, if you intend to disable the detailed diagnosis capability for this test, you can do so by specifying none against DD Frequency. |
|
Detailed Diagnosis |
To make diagnosis more efficient and accurate, the eG Enterprise embeds an optional detailed diagnostic capability. With this capability, the eG agents can be configured to run detailed, more elaborate tests as and when specific problems are detected. To enable the detailed diagnosis capability of this test for a particular server, choose the On option. To disable the capability, click on the Off option. The option to selectively enable/disable the detailed diagnosis capability will be available only if the following conditions are fulfilled:
|
| Measurement | Description | Measurement Unit | Interpretation |
|---|---|---|---|
|
Information messages |
Indicates the number of server publishing admin information events generated when the test was last executed. |
Number |
A change in the value of this measure may indicate infrequent but successful operations performed by one or more applications. Please check the Server Publishing Admin Logs in the Event Log Viewer for more details. |
|
Warnings |
Indicates the number of server publishing admin warnings that were generated when the test was last executed. |
Number |
A high value of this measure indicates application problems that may not have an immediate impact, but may cause future problems in one or more applications. Please check the Server Publishing Admin Logs in the Event Log Viewer for more details. |
|
Error messages |
Indicates the number of server publishing admin error events that were generated when the test was last executed. |
Number |
A very low value (zero) indicates that the system is in a healthy state and all applications are running smoothly without any potential problems. An increasing trend or high value indicates the existence of problems like loss of functionality or data in one or more applications. Please check the Server Publishing Admin Logs in the Event Log Viewer for more details. |
|
Critical messages |
Indicates the number of server publishing admin critical error events that were generated when the test was last executed. |
Number |
A very low value (zero) indicates that the system is in a healthy state and all applications are running smoothly without any potential problem. An increasing trend or high value indicates the existence of fatal/irrepairable problems in one or more applications. Please check the Server Publishing Admin Logs in the Event Log Viewer for more details. |
|
Verbose messages |
Indicates the number of server publishing admin verbose events that were generated when the test was last executed. |
Number |
Verbose logging provides more details in the log entry, which will enable you to troubleshoot issues better. The detailed diagnosis of this measure describes all the verbose events that were generated during the last measurement period. Please check the Server Publishing Admin Logs in the Event Log Viewer for more details. |
Adding a new policy
To add a new policy, do the following:
-
Click on the
 icon available next to the Filter list box. (see Figure 1).
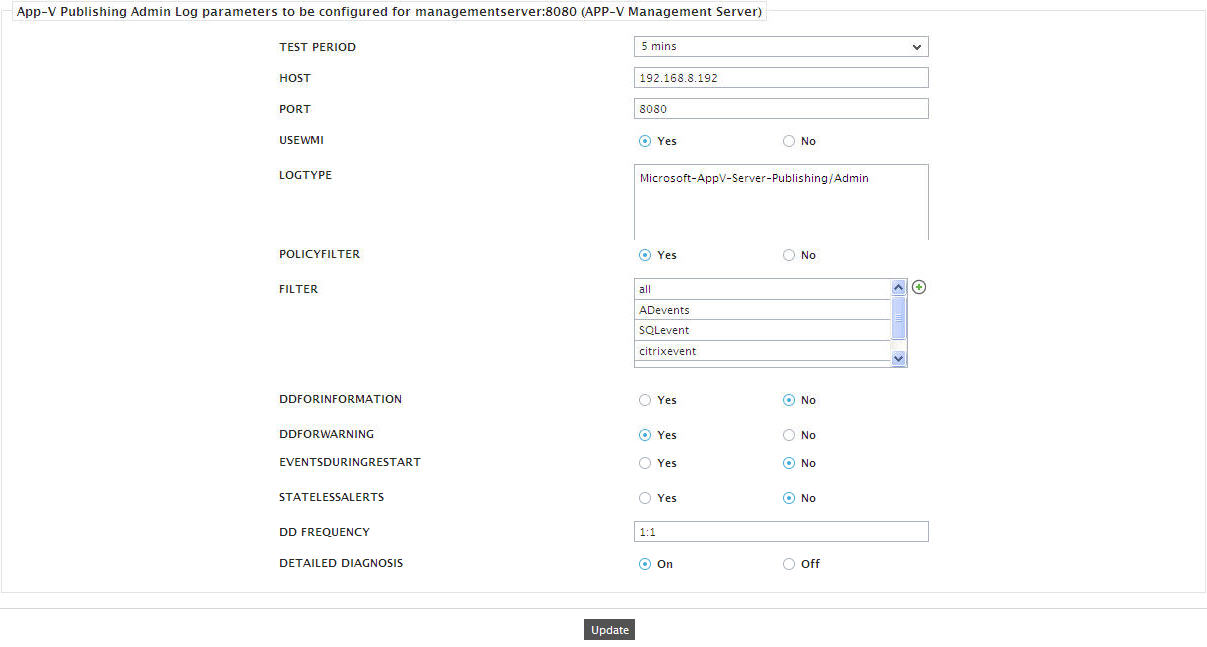
-
Figure 2 will then appear listing the policies that pre-exist.
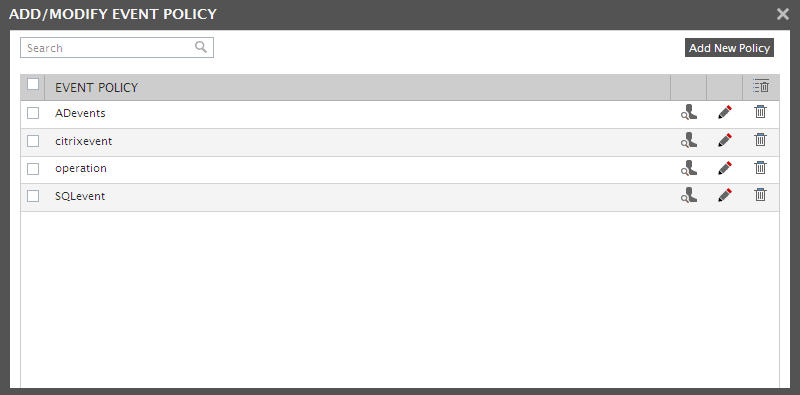
- To view the contents of a policy, click on the
 icon against the policy name. While a policy can be modified by clicking on the
  icon, it can be deleted using the
  icon. The default policy is all, which can only be viewed and not modified or deleted. The specification contained within this policy is:all:none:all:none:all:none.
 -
To create a new policy, click on the Add New Policy button in Figure 2. Doing so invokes Figure 3, using which a new policy can be created.
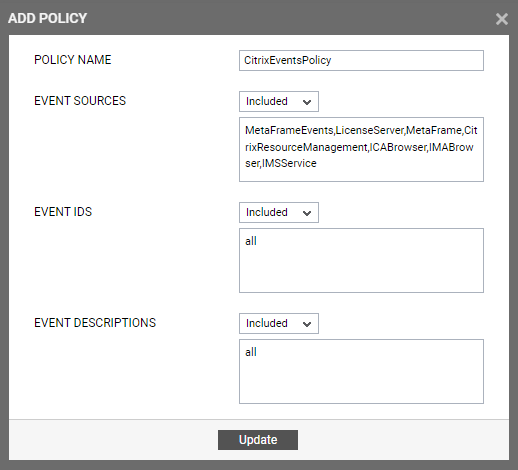
- In Figure 3, first, provide a unique name against POLICY NAME.
- To include one/more event sources for monitoring, select Included from the EVENT SOURCES drop-down list, and then specify a comma-separated list of event sources to be included in the text box under the drop-down list.
-
To exclude specific event sources from monitoring, select Excluded from the EVENT SOURCES drop-down list, and then specify a comma-separated list of event sources to be excluded in the text box under the drop-down list.
Note:
At any given point in time, you can choose to either Include or Exclude event sources, but you cannot do both. If you have chosen to include event sources, then the eG Enterprise system automatically assumes that no event sources need to be excluded. Accordingly, the {event_sources_to_be_excluded} section of the filter format mentioned above, will assume the value none. Similarly, if you have chosen to exclude specific event sources from monitoring, then the {event_sources_to_be_included} section of the format above will automatically take the value all, indicating that all event sources except the ones explicitly excluded, will be included for monitoring.
- In the same way, select Included from the EVENT IDS list and then, provide a comma-separated list of event IDs to be included in the text box under the drop-down list.
-
If you, on the other hand, want to exclude specific event IDs from monitoring, then first select Excluded from the EVENT IDS list box, and then provide a comma-separated list of event IDs to be excluded in the text box under the drop-down list.
Note:
At any given point in time, you can choose to either Include or Exclude event IDs, but you cannot do both. If you have chosen to include event IDs, then the eG Enterprise system automatically assumes that no event IDs need be excluded. Accordingly, the {event_IDs_to_be_excluded} section of the filter format mentioned above, will assume the value none. Similarly, if you have chosen to exclude specific event IDs from monitoring, then the {event_IDs_to_be_included} section of the format above will automatically take the value all, indicating that all event IDs except the ones explicitly excluded, will be included for monitoring.
- Likewise, select Included from the EVENT DESCRIPTIONS list and then, provide a comma-separated list of event descriptions to be included in the text box under the drop-down list.
-
For excluding specific event descriptions from monitoring, first select Excluded from the EVENT DESCRIPTIONS list box, and then provide a comma-separated list of event descriptions to be excluded in the text box under the drop-down list.
Note:
Instead of the complete event descriptions, wild card-embedded event description patterns can be provided as a comma-separated list in the Included or Excluded text boxes. For instance, to include all events that start with st and vi, your Included specification should be: st*,vi*. Similarly, to exclude all events with descriptions ending with ed and le, your Excluded specification should be: *ed,*le.
At any given point in time, you can choose to either Include or Exclude event descriptions/users, but you cannot do both. If you have chosen to include event descriptions/users, then the eG Enterprise system automatically assumes that no event descriptions/users need be excluded. Accordingly, the {event_descriptions_to_be_excluded} section or the {users_to_be_excluded} section (as the case may be) of the filter formats mentioned above, will assume the value none. Similarly, if you have chosen to exclude specific event descriptions/users from monitoring, then the {event_descriptions_to_be_included} section or the {users_to_be_included} section (as the case may be) of the formats above will automatically take the value all. This indicates that all event descriptions/users except the ones explicitly excluded, will be included for monitoring.
-
Finally, clicking the Update button will display a pop up window as depicted by Figure 4.
Note:
If you have configured a policy to Include a few/all events (sources/IDs/descriptions/users), and Exclude none, then, while reconfiguring that policy, you will find that the Include option is chosen by default from the corresponding drop-down list in Figure 3. On the other hand, if you have configured a policy to Exclude a few specific events and Includeall events, then, while modifying that policy, you will find the Exclude option being the default selection in the corresponding drop-down list in Figure 3.