How to Monitor a Microsoft Azure SQL Database Using eG Enterprise?
The broad steps for monitoring an Azure SQL database using eG Enterprise are as follows:
- Managing the Microsoft Azure SQL component
- Configuring the tests
These steps have been discussed in the forthcoming sections.
Managing the Microsoft Azure SQL Database
Every Azure SQL database that you want to monitor has to be managed as a separate component in eG Enterprise. Follow the steps below to achieve the same:
- Follow the Components -> Add/Modify menu sequence in the Infrastructure tile of the Admin menu.
- Next, select Microsoft Azure SQL from the Component type drop-down and then click the Add New Component button.
-
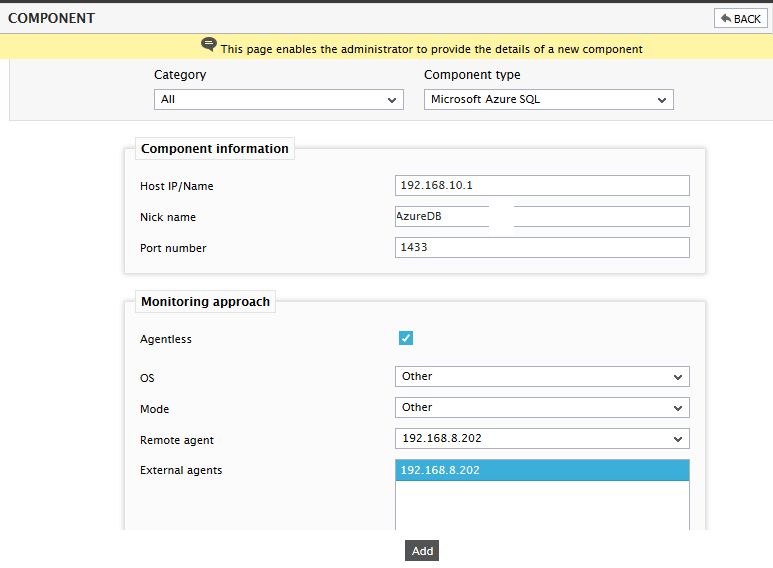
When Figure 6 appears, provide the Host IP/Name of the 'logical server' hosting the Microsoft SQL Azure database to be monitored. An Azure SQL database is associated with an Azure SQL Database logical server, which is created within a specific Azure region. A logical server acts as a central administrative point for multiple databases, including SQL elastic pools logins, firewall rules, auditing rules, threat detection policies, and failover groups.

Figure 6 : Managing a Microsoft SQL Azure database server in an agentless manner
- Then, provide a Nick name for the server.
- The Port number will be set as 1433 by default. If the Azure SQL database is listening on a different port in your environment, then override this default setting.
-
Then, do the following:
- Select the Agentless check box.
- Pick the OS on which the Microsoft SQL Azure database server is running.
- Set the Mode to Other.
- Select the Remote agent that will be monitoring the Microsoft SQL Azure server. Note that the Remote agent you choose should run on a Windows host.
- Choose an external agent for the server by picking an option from the External agents list box.
-
Finally, click the Add button to add the Microsoft SQL Azure database server for monitoring.
-
Once the Microsoft Azure SQL component is added successfully, you will be again redirected to the Components at a Glance page (see Figure 7). Using the options provided in the Component at a Glance page, you can modify, unmanage or delete the newly added component. In addition, you can also configure the tests, set thresholds and maintenance policies, and change the IP address.

-
To collect the performance metrics, you may need to manually configure the tests that are mapped to the Microsoft SQL Azure component. To configure the tests that need manual configuration, click on the
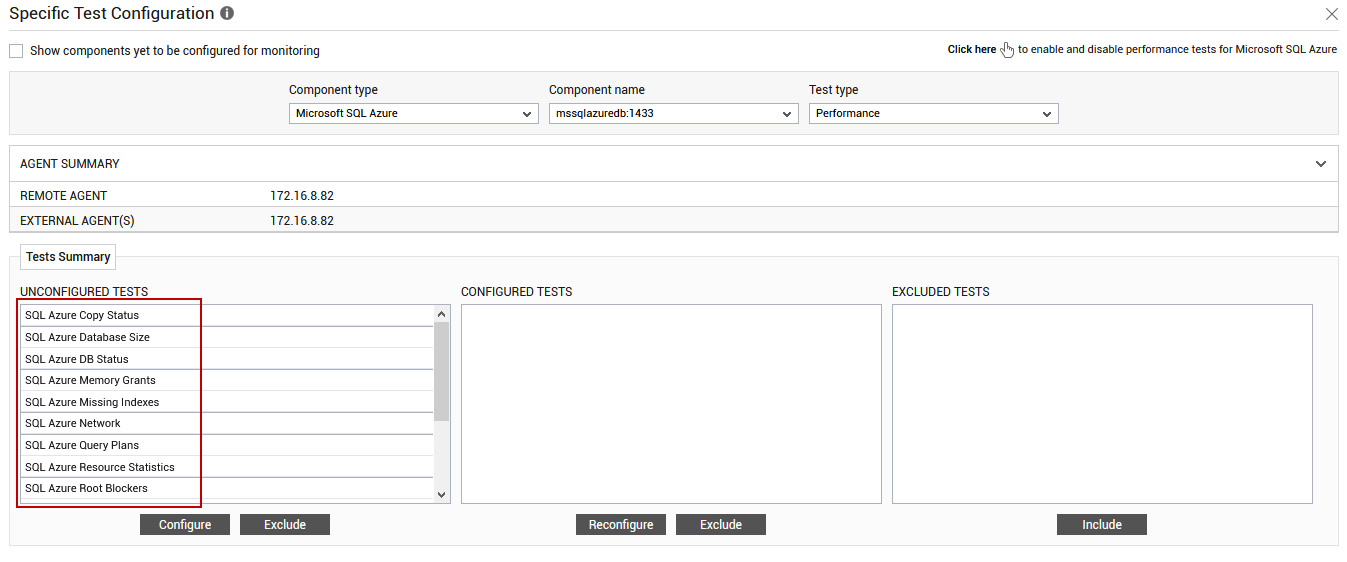
 icon in Figure 7. This will lead you to the Specific Test Configuration page where the unconfigured tests for the Microsoft Azure SQL component will be listed in the Unconfigured Tests list box.
Figure 8 : Unconfigured tests for the Microsoft SQL Azure component
- Now, click on the test name to configure it. To know how to configure the tests, refer to the Monitoring the Microsoft Azure SQL Database Using eG Enterprise. To view the performance metrics, switch to the Monitor tab.