Monitoring Microsoft SharePoint
Figure 1 depicts the Microsoft SharePoint monitoring model.
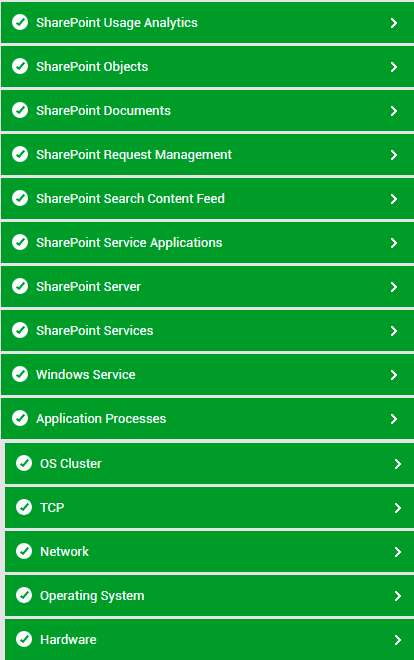
Figure 1 : The layer model of Microsoft SharePoint
Each layer of Figure 1 is mapped to a variety of tests that periodically check the health of the core components and services of the Microsoft SharePoint server. Using the metrics reported by these tests, administrators can find quick and accurate answers for the following performance queries:
- Has the archival plugin marked too many documents for retry?
- Are many documents in the archival plugin waiting for a queue?
- Have any errors occurred in index propagation?
- Is index reception error-free?
- Did any search query fail?
- Is query execution taking too long? If so, where is the query spending maximum time?
- Is the query CPU-intensive? If so, where is the query spending the maximum CPU time?
- Is any SharePoint Foundation process overloaded? If so, which one is it?
- Is any SharePoint Foundation process taking too long to execute requests? Which process is it?
- Which process is taking too much time to execute queries?
- Is the schema plugin able to process documents and properties quickly?
- Are there too many idle threads on the SharePoint server?
- Is any thread waiting for a network response from the filter process?
- Have too many servers timed out?
- Was any slowdown noticed in document filtering? Is it due to site hit frequency rules? If so, how many documents were affected as a result?
- Is filtering failing for any document?
- Is the user experience with web sites/applications on SharePoint optimal? Which user's experience with which SharePoint site/application is poor?
- Can the sub-par experience be attributed to the abnormally high page load time of specific web pages in the web site/application? If so, which web pages are these, and what is causing these pages to load slowly - a slow front-end web server? inefficient queries to the backend database? or slow service calls?
- Did any web site/application throw HTTP errors? Which web site is this, and what type of HTTP errors did it encounter - errors with response code 400? or 500? When did such errors occur, and which user experienced these errors?
In order to enable the eG agent to collect these metrics from a Microsoft SharePoint server, the pre-requisites outlined in Pre-requisites for Monitoring Microsoft SharePoint