System – Guest Test
This test collects various metrics pertaining to the CPU and memory usage of every processor supported by a guest. The details of this test are as follows:
Target of the test : A Microsoft Virtual Server
Agent deploying the test : An internal agent
Outputs of the test : One set of results for each processor supported by every guest on the monitored virtual server.
| Parameter | Description |
|---|---|
|
Test period |
How often should the test be executed. |
|
Host |
The IP address of the host for which this test is to be configured. |
|
Port |
The port at which the specified host listens. |
|
Inside View Using |
By default, this test communicates with every VM remotely and extracts “inside view” metrics. Therefore, by default, the inside view using flag is set to Remote connection to VM (Windows). Typically, to establish this remote connection with Windows VMs in particular, eG Enterprise requires that the eG agent be configured with domain administrator privileges. In high-security environments, where the IT staff might have reservations about exposing the credentials of their domain administrators, this approach to extracting “inside view” metrics might not be preferred. In such environments therefore, eG Enterprise provides administrators the option to deploy a piece of software called the eG VM Agent on every Windows VM; this VM agent allows the eG agent to collect “inside view” metrics from the Windows VMs without domain administrator rights. Refer to Installing and Configuring the eG VM Agent for more details on the eG VM Agent. To ensure that the “inside view” of Windows VMs is obtained using the eG VM Agent, set the inside view using flag to eG VM Agent (Windows). Once this is done, you can set the domain, admin user, and admin password parameters to none. |
|
Domain, Admin User, Admin Password, and |
By default, this test connects to each virtual guest remotely and attempts to collect “inside view” metrics. In order to obtain a remote connection, the test must be configured with user privileges that allow remote communication with the virtual guests. The first step towards this is to specify the DOMAIN within which the virtual guests reside. The admin user and admin password will change according to the domain specification. Discussed below are the different values that the domain parameter can take, and how they impact the admin user and admin password specifications:
|
|
Detailed Diagnosis |
To make diagnosis more efficient and accurate, the eG Enterprise embeds an optional detailed diagnostic capability. With this capability, the eG agents can be configured to run detailed, more elaborate tests as and when specific problems are detected. To enable the detailed diagnosis capability of this test for a particular server, choose the On option. To disable the capability, click on the Off option. The option to selectively enable/disable the detailed diagnosis capability will be available only if the following conditions are fulfilled:
|
| Measurement | Description | Measurement Unit | Interpretation |
|---|---|---|---|
|
CPU usage |
This measurement indicates the percentage of CPU utilized by the processor. |
Percent |
A high value could signify a CPU bottleneck. The CPU utilization may be high because a few processes are consuming a lot of CPU, or because there are too many processes contending for a limited resource. The detailed diagnosis of this test reveals the top-10 CPU-intensive processes on the guest. |
|
System CPU usage |
Indicates the percentage of CPU time spent for system-level processing. |
Percent |
An unusually high value indicates a problem and may be due to too many system-level tasks executing simultaneously. |
|
Run queue |
Indicates the instantaneous length of the queue in which threads are waiting for the processor cycle. This length does not include the threads that are currently being executed. |
Number |
A value consistently greater than 2 indicates that many processes could be simultaneously contending for the processor. |
|
Processes blocked |
Indicates the number of processes blocked for I/O, paging, etc. |
Number |
A high value could indicate an I/O problem on the guest (e.g., a slow disk). |
|
Swap memory |
Denotes the committed amount of virtual memory. This corresponds to the space reserved for virtual memory on disk paging file(s). |
MB |
An unusually high value for the swap usage can indicate a memory bottleneck. Check the memory utilization of individual processes to figure out the process(es) that has (have) maximum memory consumption and look to tune their memory usages and allocations accordingly. |
|
Free memory |
Indicates the free memory available. |
MB |
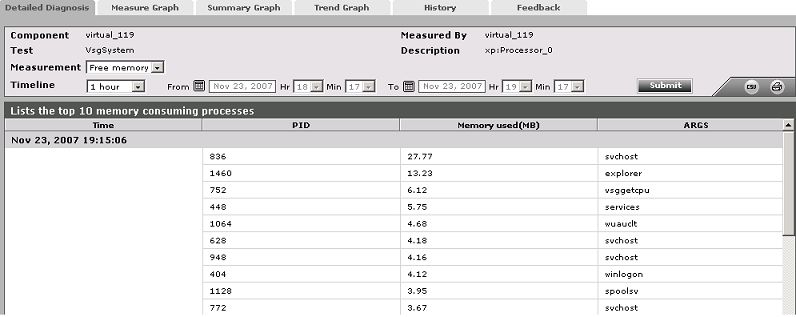
A very low value of free memory is also an indication of high memory utilization on a guest. The detailed diagnosis of this measure lists the top 10 processes responsible for maximum memory consumption on the guest. |
|
Scan rate |
Indicates the memory scan rate. |
Pages/Sec |
A high value is indicative of memory thrashing. Excessive thrashing can be detrimental to guest performance. |
The detailed diagnosis of the Free memory measure of this test reveals the top 10 memory - consuming processes on a guest (see Figure 1).