VsgDiskActivity Test
This test reports statistics pertaining to the input/output utilization of each physical disk on a guest.
Target of the test : A Microsoft Virtual Server
Agent deploying the test : An internal agent
Outputs of the test : One set of results for each disk partition on every virtual server monitored.
| Parameter | Description |
|---|---|
|
Test period |
How often should the test be executed. |
|
Host |
The IP address of the host for which this test is to be configured. |
|
Port |
The port at which the specified host listens. |
|
Inside View Using |
By default, this test communicates with every VM remotely and extracts “inside view” metrics. Therefore, by default, the inside view using flag is set to Remote connection to VM (Windows). Typically, to establish this remote connection with Windows VMs in particular, eG Enterprise requires that the eG agent be configured with domain administrator privileges. In high-security environments, where the IT staff might have reservations about exposing the credentials of their domain administrators, this approach to extracting “inside view” metrics might not be preferred. In such environments therefore, eG Enterprise provides administrators the option to deploy a piece of software called the eG VM Agent on every Windows VM; this VM agent allows the eG agent to collect “inside view” metrics from the Windows VMs without domain administrator rights. Refer to Installing and Configuring the eG VM Agent for more details on the eG VM Agent. To ensure that the “inside view” of Windows VMs is obtained using the eG VM Agent, set the inside view using flag to eG VM Agent (Windows). Once this is done, you can set the Domain, Admin User, and Admin Password parameters to none. |
|
Domain, Admin User, Admin Password, and |
By default, this test connects to each virtual guest remotely and attempts to collect “inside view” metrics. In order to obtain a remote connection, the test must be configured with user privileges that allow remote communication with the virtual guests. The first step towards this is to specify the Domain within which the virtual guests reside. The Admin User and Admin Password will change according to the Domain specification. Discussed below are the different values that the Domain parameter can take, and how they impact the Admin User and Admin Password specifications:
|
|
Detailed Diagnosis |
To make diagnosis more efficient and accurate, the eG Enterprise embeds an optional detailed diagnostic capability. With this capability, the eG agents can be configured to run detailed, more elaborate tests as and when specific problems are detected. To enable the detailed diagnosis capability of this test for a particular server, choose the On option. To disable the capability, click on the Off option. The option to selectively enable/disable the detailed diagnosis capability will be available only if the following conditions are fulfilled:
|
| Measurement | Description | Measurement Unit | Interpretation |
|---|---|---|---|
|
Disk busy |
Indicates the percentage of elapsed time during which the disk is busy processing requests (i.e., reads or writes). |
Percent |
Comparing the percentage of time that the different disks are busy, an administrator can determine whether load is properly balanced across the different disks. |
|
Disk busy due to reads |
Indicates the percentage of elapsed time that the selected disk drive is busy servicing read requests. |
Percent |
|
|
Disk busy due to writes |
Indicates the percentage of elapsed time that the selected disk drive is busy servicing write requests. |
Percent |
|
|
Disk read time |
Indicates the average time in seconds of a read of data from the disk. |
Secs |
|
|
Disk write time |
Indicates the average time in seconds of a write of data from the disk. |
Secs |
|
|
Average queue length |
Indicates the average number of both read and write requests that were queued for the selected disk during the sample interval. |
Number |
|
|
Current queue length |
Indicates the number of requests outstanding on the disk at the time the performance data is collected. |
Number |
This measure includes requests in service at the time of the snapshot. This is an instantaneous length, not an average over the time interval. Multi-spindle disk devices can have multiple requests active at one time, but other concurrent requests are awaiting service. This counter might reflect a transitory high or low queue length, but if there is a sustained load on the disk drive, it is likely that this will be consistently high. Requests experience delays proportional to the length of this queue minus the number of spindles on the disks. This difference should average less than two for good performance. |
|
Read operations from disk |
Indicates the number of reads happening on a logical disk per second. |
Reads/Sec |
A dramatic increase in this value may be indicative of an I/O bottleneck on the guest. |
|
Data reads from disk |
Indicates the rate at which bytes are transferred from the disk during read operations. |
KB/Sec |
A very high value indicates an I/O bottleneck on the guest. |
|
Write operations to disk |
Indicates the number of writes happening on a local disk per second. |
Writes/Sec |
A dramatic increase in this value may be indicative of an I/O bottleneck on the guest. |
|
Data writes to disk |
Indicates the rate at which bytes are transferred from the disk during write operations. |
KB/Sec |
A very high value indicates an I/O bottleneck on the guest. |
The detailed diagnosis of the Disk busy measure, if enabled, provides the list of processes currently executing on the disk, the I/O operations performed by the processes, and the statistics pertaining to these I/O operations (see Figure 1).
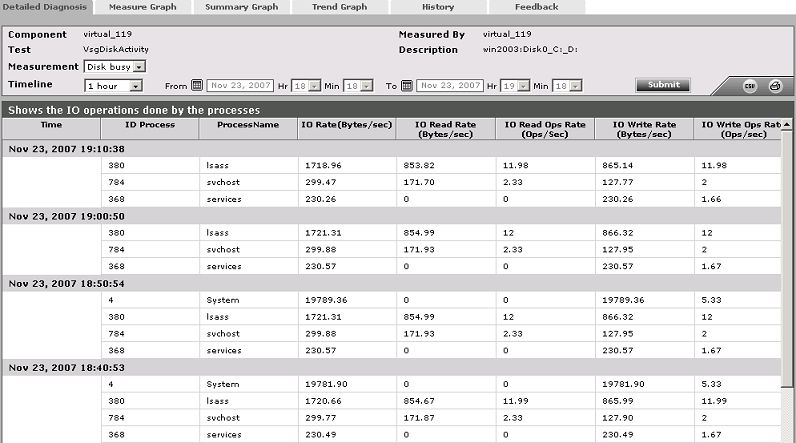
Figure 1 : The detailed diagnosis of the VmgDiskActivity test