How to Add a One Click Dashboard
The My Dashboards capability of eG Enterprise allows users to build completely customized dashboards from scratch. However, many administrators prefer pre-defined dashboards that offers the flexibility and visual appeal of My Dashboards, but that did not require as much customization! For such administrators, eG Enterprise provides the One Click Dashboard capability. As part of this capability, eG Enterprise provides pre-built dashboard templates for certain mission-critical component-types. These templates are pre-configured with key metrics on the performance of that component-type; when added as a One Click Dashboard, this template readily displays pre-defined metrics, thus saving administrators the time and trouble involved in building a My Dashboard from scratch. Administrators can clone a template and customize it to display the metrics they need, the way they need it.
Follow the steps mentioned below to create a One Click Dashboard:
-
To add a new one click dashboard, click the ONE CLICK DASHBOARD option in . Figure 1 then appears.
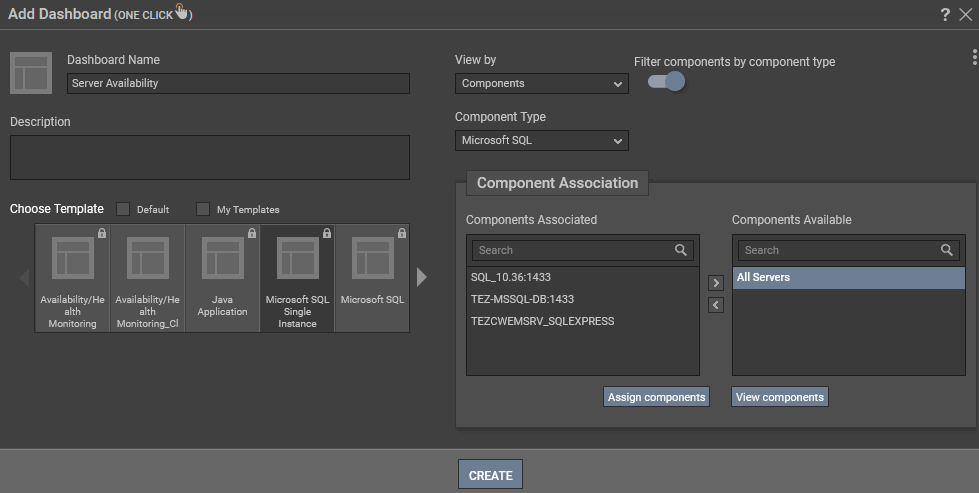
- In Figure 1 that appears, specify the name of the dashboard that you wish to create in the Dashboard Name text box. Then, specify a brief Description of the dashboard that you wish to create.
- By default, the Choose Template section lists all the templates available for use. If you wish to filter the default templates in that environment, select the check box against the Default option. In some environments, administrators may want to create their own templates according to their requirement. For this, eG Enterprise offers the flexibility to create templates too and reuse them as and when required. If such templates have been created, then selecting the My Templates check box will filter all the templates created by the administrators in that environment. To know more on how to create a template refer to . To choose the appropriate template, just click on the template of your choice. The chosen template grid will then be highlighted.
- To categorize the dashboard, or to view only the components available in the Zone/Segment/Service, select the option under the View by drop down. For example, selecting the Service option will list only the components that are part of a service. To view all the components in the environment, click on the Components option. By default, the Components option will be chosen in the View by list.
- By default, the Filter by component type slider is turned off. Turning on this slider indicates that the Component Type list will be populated with only those component types that are associated with the chosen template.
- The Component Type list will appear only when you have turned on the Filter by component type slider. From this list, pick a Component Type of your choice.
- Once you have chosen the Component Type, the Components Available list box in the Component Association section will be populated with all the components of the chosen Component Type. You can either pick the components of your choice from this list or the All servers option and move your selection to the Components Associated list by clicking the < button. Clicking the Assign and Add More button will associate the chosen components with the template of your choice.
- To search for the components of your choice, you can use the Search text box.
-
Clicking the View Associated Components button in Figure 1 will reveal Figure 2 where you can view the components that are associated with the chosen One click dashboard.
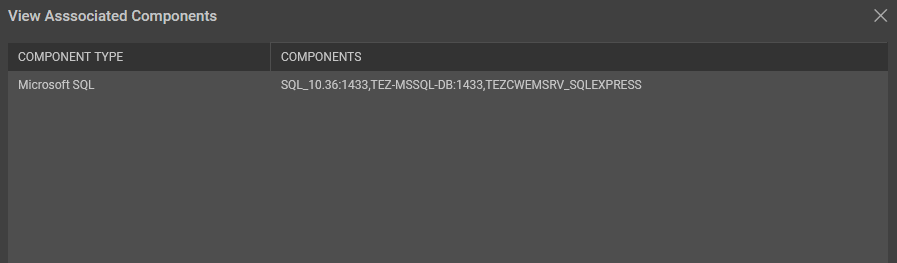
Figure 2 : Viewing the Components associated with the dashboard
- Alternately, if you have disabled(turned off) the Filter by component type slider, then, upon choosing the template, the components that are associated with the template is displayed automatically in the Components list. Pick the components of your choice from this list. If the Component list consists of too many components, then viewing all the components and selecting the ones for creating the dashboard could require endless scrolling. To avoid this, you can click the icon next to the Components list. The COMPONENT (S) pop up window will then appear using which you can view almost all the components in a single interface and select the ones that are required for creating the dashboard.
-
There are a few parameters that are pre-set while the one click dashboard is being created. If you wish to alter those pre-set parameters while creating a dashboard, click the
 icon. Figure 3 will then appear.
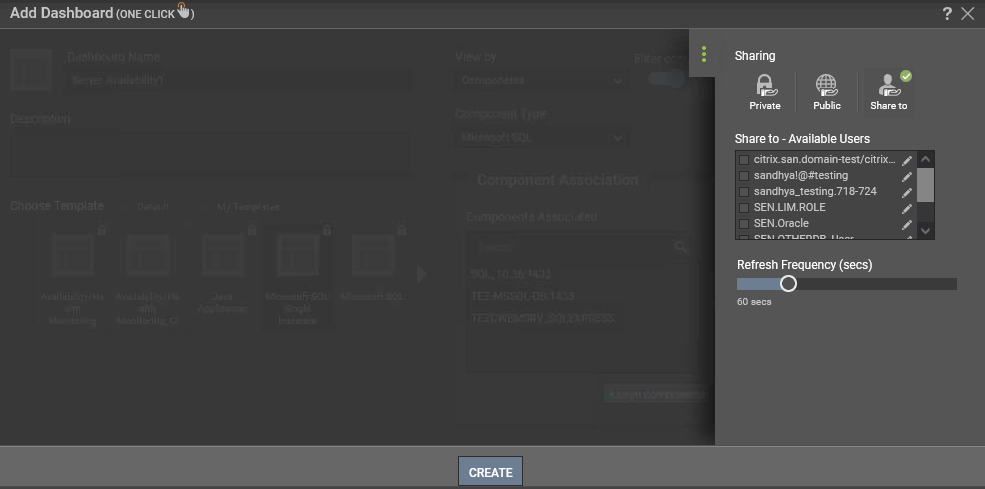
Figure 3 : The parameters that are pre-set while creating a dashboard
The preset parameters are defined below:
-
Sharing: Indicates whether or not you want to share the new dashboard with other users, and if so, what should be the level of sharing. For this, pick any of the following options from the Sharing drop-down list. By default, the Private option is chosen from this list.
- Private: Indicates that the user building the dashboard is alone authorized to view/modify/delete the dashboard. This is the default option.
- Public: Allows all users to the eG Enterprise system to view (not modify/delete) the dashboard that is being created.
- Share to: You can select this option to share the dashboard with specific users to the eG Enterprise system. From the Share to - Available Users list that then appears (see Figure 3), select the users with whom you want to share the dashboard by clicking the check box in front of each user. You can also provide read/write access to the users with whom you have shared the dashboard by clicking on the icon against the user. When you click the icon against the user, the icon lights up and turns into green.
- Refresh frequency (secs): By default, this slide bar is set to 60 seconds indicating that the dashboard needs to be refreshed after this time interval. You can use this slide bar to set a refresh frequency of your choice.
-
-
Finally, click the CREATE button to create the new dashboard. Figure 4 then appears displaying the dashboard based on the pre-built template.
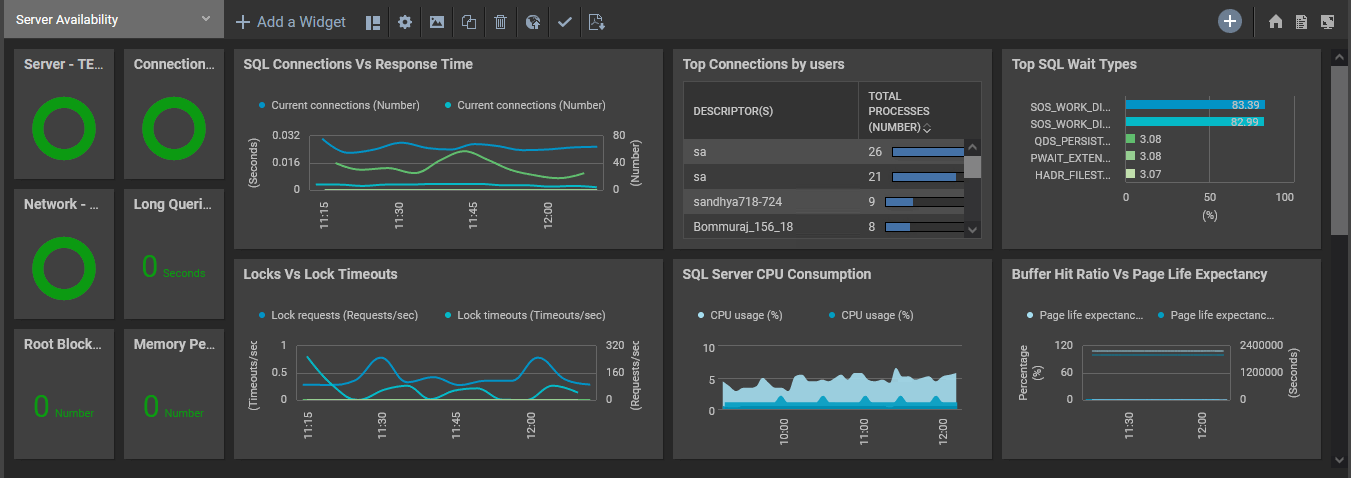
Figure 4 : A One Click Dashboard built based on a predefined template