Monitoring Services and Service Groups
Monitoring Services
A service is a collection of infrastructure components that work together to perform a specific set of functions - e.g., a mobile payment gateway service, an online banking service, a web site, etc. eG Enterprise allows administrators to add one/more services for monitoring. The procedure to configure such services using the eG administrative interface has been described in the Administering the eG Enterprise document. This section takes the example of a web site service named infoway to explain how eG Enterprise performs 'end-to-end service monitoring'.
Upon logging into the monitor interface, select the Services option from the Groups tile; this will lead you to the services page that lists the services that you are privileged to monitor and the current state of these services. If you login as supermonitor, then all the services that have been configured in your environment will be listed in the services page as depicted by Figure 1.
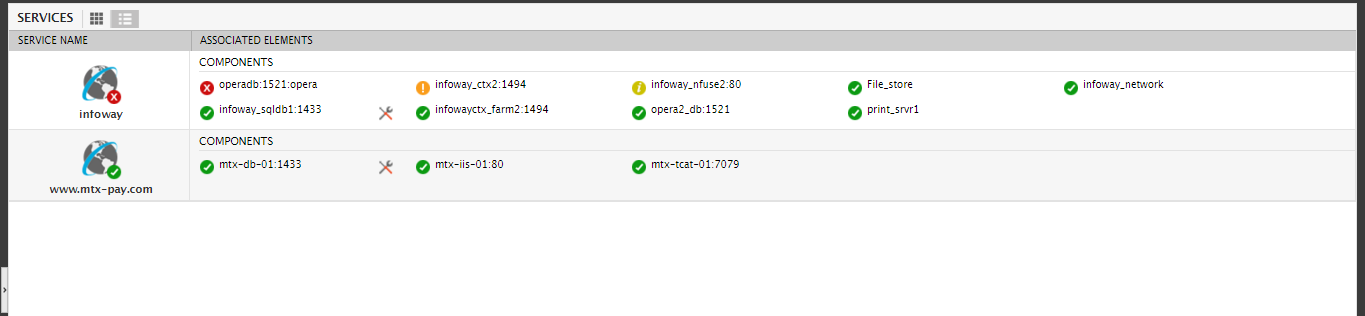
Figure 1 : Viewing the list of configured services and their states
Note:
By default, against each service displayed in the service page, the top-10 Components associated with that service will be displayed. Typically, to identify the top-10 components, eG Enterprise automatically sorts all the components associated with a service on the basis of their current state, arranges the sorted list in the alphabetical order of the component names, and picks the first 10 components of this list.
If you want more number of components to be displayed against each service, do the following:
- Login to the eG administrative interface.
- Click on the
 icon available in the Admin tab. Then, select the Monitoroption in the Settings tile.
 - Click the Other Settings sub-node under the General node in the tree-structure in the monitor settings page.
- In the right panel, modify the default value 10 that is displayed in the Components count in segment/service/zone list text box.
- Click the Update button to save the changes.
Note:
By default, only the components associated with a service will be displayed in the service page. If you want the segments associated with the service also to be displayed, then, do the following:
- Login to the eG administrative interface.
- Click on the icon available in the Admin tab. Then, select the Monitoroption in the Settings tile.
- Click the Other Settings sub-node under the General node in the tree-structure in the monitor settings page.
- In the right panel, set the Show segment(s) in service list flag to Yes.
- Click the Update button to save the changes.
To make sure that service list page does not display the list of components associated with a service, set the Show component(s) in service list flag in the other display settings panel of the monitor settings page to No.
If both the segment list and component list are disabled, then the SERVICE LIST page will only display a vertical list of services and their current state.
If you click on the > button to the left of the services list, as indicated by Figure 1, a Services tree will appear (see Figure 2).
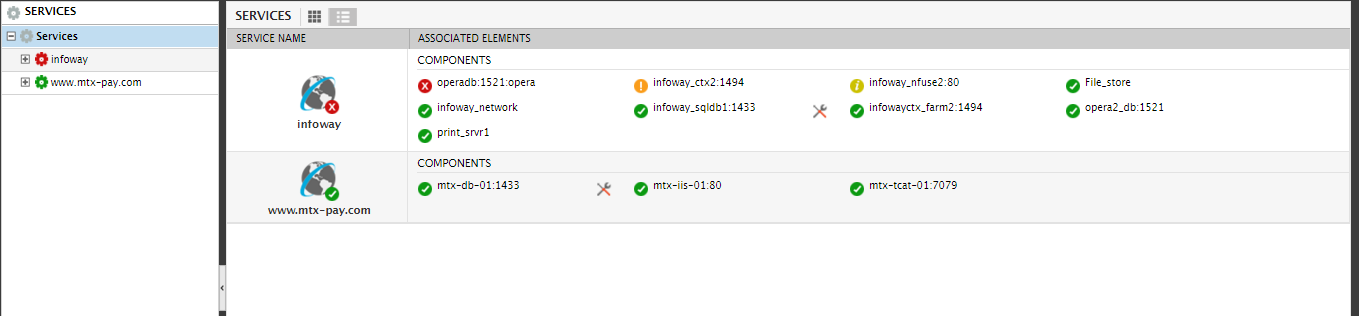
Every service configured for monitoring in the eG Enterprise system will appear as the nodes of the Services tree. Expanding a service node will list as its sub-nodes all those components that are engaged in the delivery of that service; the state of these components will also be revealed (see Figure 3).
Note:
By default, the services listed under the Services node will be sorted in the order of the service state. Likewise the components that are listed under each service will also be sorted in the basis of their current state.
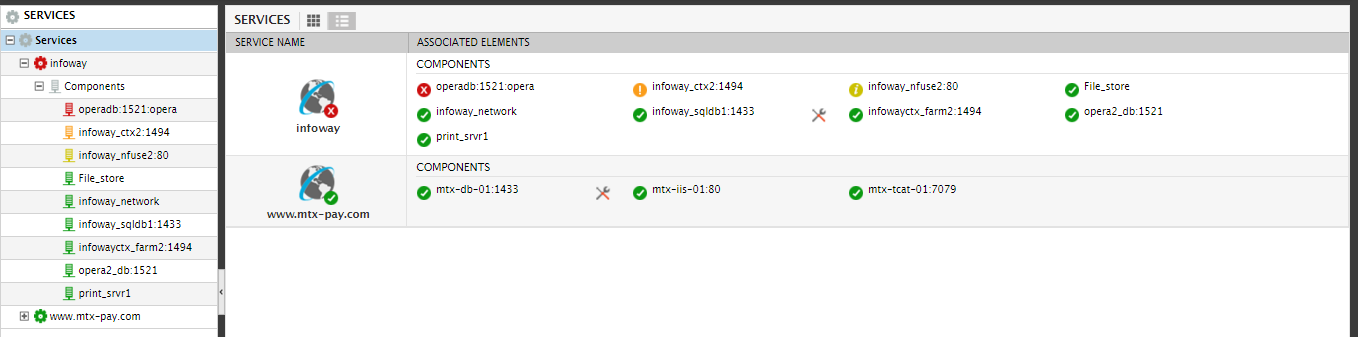
Figure 3 : Expanding a service node in the Services tree
At any give point in time, you can click on the < button indicated by Figure 3 to hide the Services tree.
Going back to the services list of Figure 1, you can see that a service named infoway is currently in a Critical state. To know what Critical problem this service encountered and why, click infoway in Figure 1.
This opens a Transactions tab page (see Figure 4). The Transactions tab page is applicable only for web site services. Since this tab page appears as soon as the infoway service in our example is clicked, it is evident that the infoway service is a web site service. In this tab page, you can view the current state of the transactions that have been explicitly configured for monitoring for the infoway web site service. By closely tracking the requests to, the responsiveness of, and the errors encountered by every transaction to a web site, you can accurately ascertain which transaction is contributing to a slowdown in the infoway web site. From Figure 4, it is clear that the UserLogin and ApplicationAccess transactions to the infoway site are experiencing Minor issues. A look at the transaction metrics reveals that both these transactions are experiencing Errors.
If you now look at the Graphs section of the tab page, you will find that these Errors have persisted for the last hour. To know what is causing these persistent errors, click on either of the transactions – say, the UserLogin transaction.
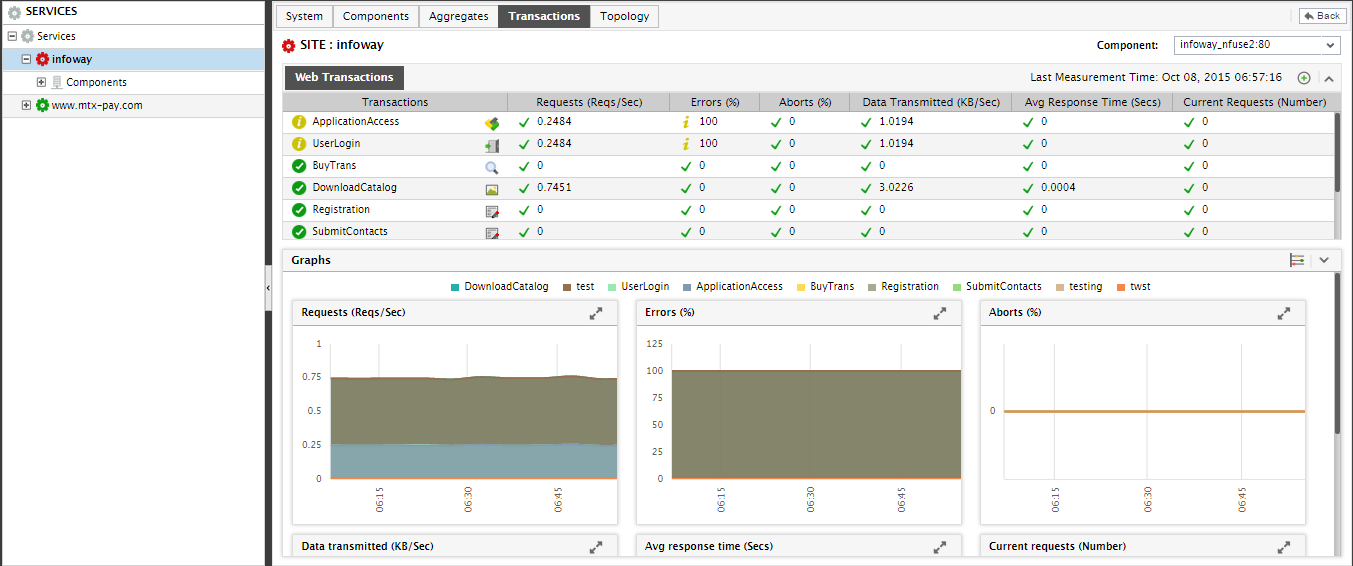
Figure 4 : The Transactions tab page
This will lead you to the Topology tab page of Figure 5. This displays the topology of the infoway web site, indicating the components engaged in delivering the web site service and the physical/logical relationships that exist between the components.
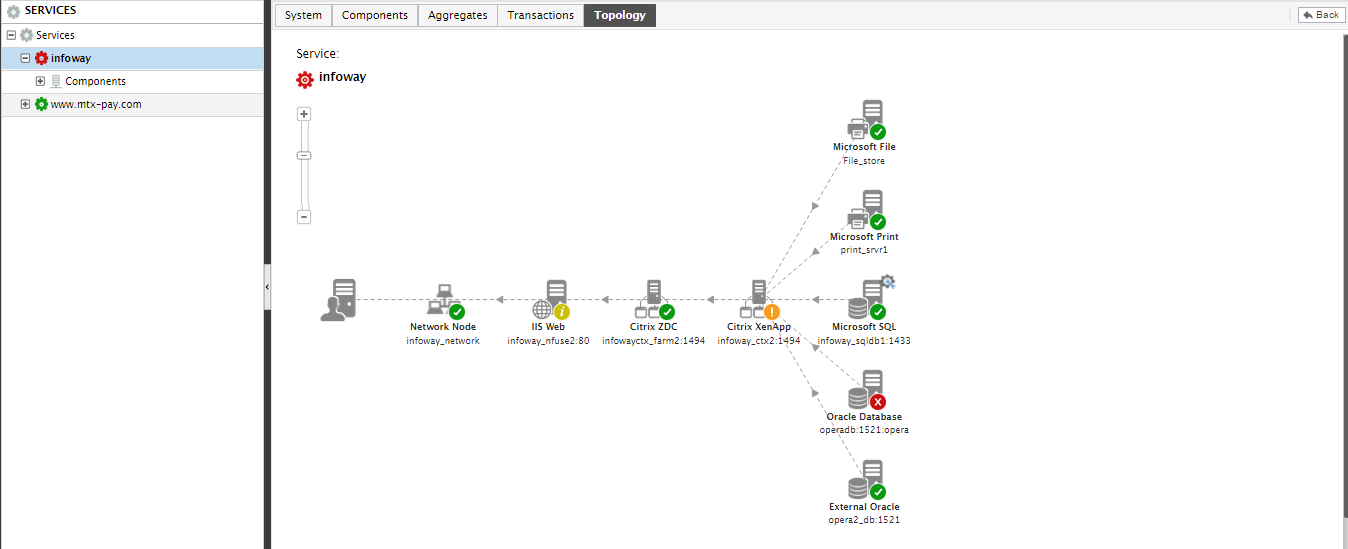
Figure 5 : The topology of the infoway web site
eG Enterprise's patented correlation technology is dependent on the specification of topology information that indicates how components are interconnected and which components rely on others for their functioning. The interconnections can represent either physical connections (e.g., a web server connected to a network router) or logical dependencies (e.g., a web server using a web application server). Each interconnection is associated with a direction. The direction signifies cause-effect relationships (if any) between the components being connected together.
From the topology view of Figure 5, you can easily infer that the infoway web site employs a multi-tier architecture. The IIS web server (infoway_nfuse2:80) handles all incoming requests from web clients and forwards them on to a Citrix Zone Data Collector server (infoway_ctx_farm2:1494). The Zone Data Collector server then transmits the request to a Citrix XenApp Server (infoway_ctx2:1494). Back end Oracle and Microsoft SQL databases, a printer, and an Active Directory server are also used in the service delivery.
With the help of the color-coding on the components in the topology diagram, you can figure out that the Oracle Database Server is experiencing a Critical issue, the Citrix XenApp server is suffering a Major issue, and the IIS web server is having a Minor issue. If you look closely at the direction of the arrows used in the topology, you will be able to tell in which direction problems flow. In the case of our example, the direction of the arrows indicate that the Critical problem with the Oracle database server, has rippled and affected the performance of the Citrix XenApp server which depends on it. This problem has also travelled further down the topology to adversely impact the performance of the IIS web server that interacts with the XenApp server. eG’s patented correlation engine has automatically correlated these issues and has accurately discovered that the root-cause of the problem with the infoway web site lies with the Oracle Database server. This is why, eG has intelligently assigned the highest problem priority to the problem with the Oracle Database server. Since the performance of the XenApp server and IIS web server suffered as a result of the bottleck at the Oracle database server, eG has smartly downgraded the priority of the problems with the XenApp and IIS servers. This way, eG efficiently differentiates between the cause and effect of service-related issues.
To know what problem with the Oracle Database server is delaying the delivery of the infoway web site service, first click on the System tab page in Figure 4. Figure 6 will then appear.
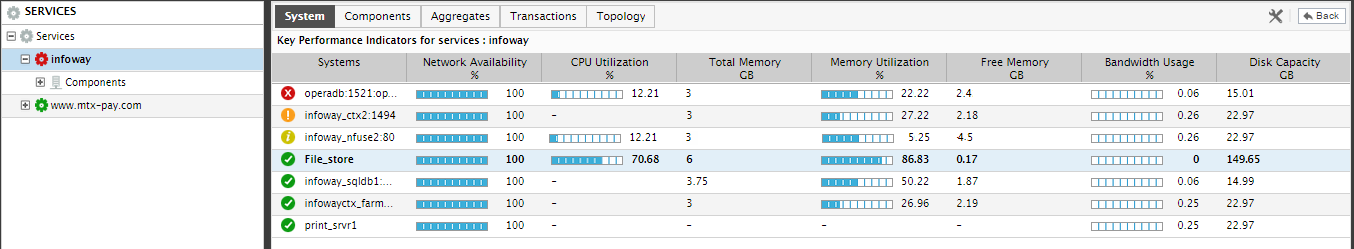
Figure 6 : The System tab page
Performance issues suffered by an application host can ripple and affect the performance of the application itself, which in turn can delay the delivery of the dependent service(s). For a chosen service, the System tab page serves as a central console where you can quickly compare critical host-level metrics captured in real-time from across all components engaged in the delivery of that service. In the case of our example therefore, the System tab page reports real-time metrics revealing how the systems supporting the infoway web site are performing.
By default, the contents of the System tab page are sorted based on the state of the service components listed therein. If more that one component exists in the same state, then the components of that state will be sorted in alphabetical order. If need be, you can change the sort order. For example, if you wish to sort the components listed in the System tab page in the descending order of the values of their CPU usage, just click on the CPU Utilization label. Doing so, tags the CPU Utilization label with a down arrow icon – this icon indicates that the System tab page is currently sorted in the descending order of the CPU used by each component. To change the sort order to ‘ascending’, all you need to do is just click again on the CPU Utilization label or the down arrow icon. Similarly, you can sort the contents of the System tab page based on any column available in the table.
By default, the CPU, memory, disk space, and network usage of each of the systems engaged in delivering the infoway web site service can be tracked using this tab page. You can, if required, override the default measure list in the System tab page by adding more critical measures to the list or by removing one/more existing ones from the list. For this, do the following:
-
Click on the
 icon provided near the Back button in Figure 7. In the settings window that appears (see Figure 7), select System from the Tabs flag.
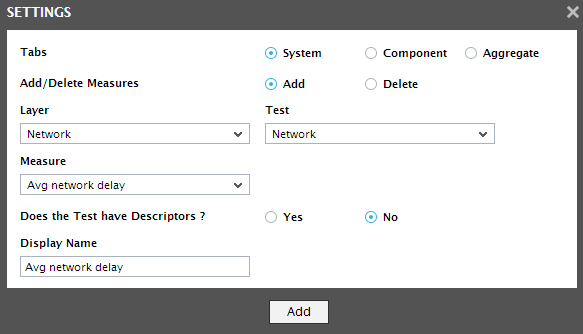
Figure 7 : Selecting the System flag from the Configuration Settings Window
- To add more metrics to the System tab page, first, select the Add option from the Add/Delete Measures flag.
- Next, select the layer for which you wish to add the test from the Layer drop down list. Now, select the Test that reports the measure of your choice, pick the measure of your interest from the Measures list, provide a Display name for the measure, and click the Add button to add the chosen measure to the Systems tab page.
-
If you want to delete one/more measures from this section, then, as soon as you choose the Delete option from the Add/Delete Measures flag, the Test drop down list will be populated with all the existing tests for which measures are displayed. Pick a Test and choose the Measure to be deleted from the System tab page.
Note:
While displaying values for descriptor-based measures in the System tab page, the eG Enterprise system does not display the actual values per descriptor. Instead, the solution computes theaverage or the total sum of values across descriptors and displays it in the corresponding measure column. For instance, for values reported as percentages, the solution computes the average value across descriptors. On the other hand, if the value is reported as a GB or MB, then the total sum of all the descriptor values of the component will be displayed against the component.
This centralized view of the health of all systems associated with the infoway web site helps in quickly determining whether any OS-level issues with the Oracle Database Server could be affecting service quality. From the System tab page of Figure 6, it is obvious that the Oracle database server host is in good health presently. So, could a serious performance snag at the application-level be responsible for the Critical issue with the Oracle Database Server? To find out, click the Components tab page in Figure 6. Figure 8 will then appear.
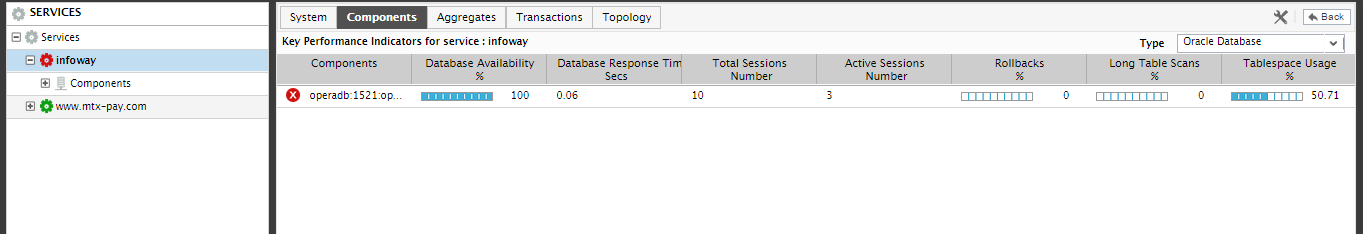
Figure 8 : The Components tab page
The Components tab page provides insights into the performance of the applications that are engaged in service delivery - in other words, the tab page displays the real-time values of the application level metrics collected from each component associated with a service. Using this at-a-glance information, administrators can perform the following with ease:
- Oversee, by a mere glance, how well the components associated with the chosen service are performing;
- Easily analyze and detect abnormalities experienced by the misson-critical applications associated with the chosen service.
At any given point in time, you can view and analyze the application-level metrics related to the service components of a single type alone in the Components tab page. Use the Type list at the right, top corner of Figure 8 to select the component-type of interest of you. Once a component-type is chosen, all components of that type that are associated with the service in question will be listed. For each component of the chosen type, a set of pre-defined application-level metrics will be displayed. If required, you can override this default metrics list by adding more metrics for display in this tab page, or by removing one/more existing metrics. For this, do the following:
-
Click on the
icon provided near the Back button in Figure 8. In the settings window that appears (see Figure 9), select Component from the Tabs flag. 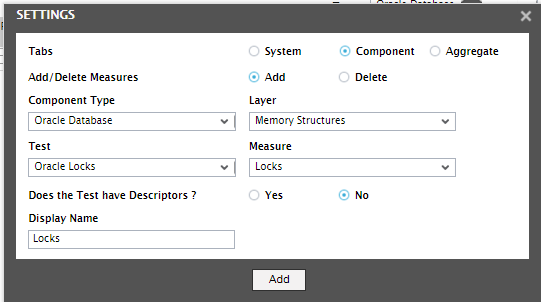
Figure 9 : Selecting the Component flag from the Settings Window
- To add more metrics to the Components tab page, first, select the Add option from the Add/Delete Measures flag. Then, pick the Component Type to which the addition applies.
- Next, select the layer for which you wish to add the test from the Layer drop down list. Then, select the Test that reports the measure of your choice, pick the measure of interest from the Measures list, provide a Display name for the measure, and click the Add button to add the chosen measure to the Components tab page.
-
If you want to delete one/more measures from this section, then, as soon as you choose the Delete option from the Add/Delete Measures flag, the Test drop down list will be populated with all the existing tests for which measures are displayed. Pick a test and choose a Measure of your interest to delete from the Components tab page.
Note:
While displaying values for descriptor-based measures in the Components tab page, the eG Enterprise system does not display the actual values per descriptor. Instead, the solution computes theaverage or the total sum of values across descriptors and displays it in the corresponding measure column. For instance, for values reported as percentages, the solution computes the average value across descriptors. On the other hand, if the value is reported as a GB or MB, then the total sum of all the descriptor values of the component will be displayed against the component.
In the case of our example by default, Oracle Database is chosen as the Type in the Components tab page (see Figure 8). As a result, the Components tab page reports the current availability, responsiveness, average tablespace usage, session load, and other key operational metrics of the problematic Oracle database server alone. From these real-time metrics, it is clear that the Oracle database server is available and is responding quickly to requests. Expensive operations such as long table scans and rollbacks are also non-existent on the server. The load on the server also appears minimal. The disconcerting factor however is the Tablespace Usage, which is over 50%. Could this be the root-cause of the Critical issue with the Oracle database server? If so, which tablespace is being used excessively? For the answers, click on the Oracle database server component in the Components tab page. Figure 10 will then appear, revealing the problematic layer, test, and measure of the Oracle database server in our example.
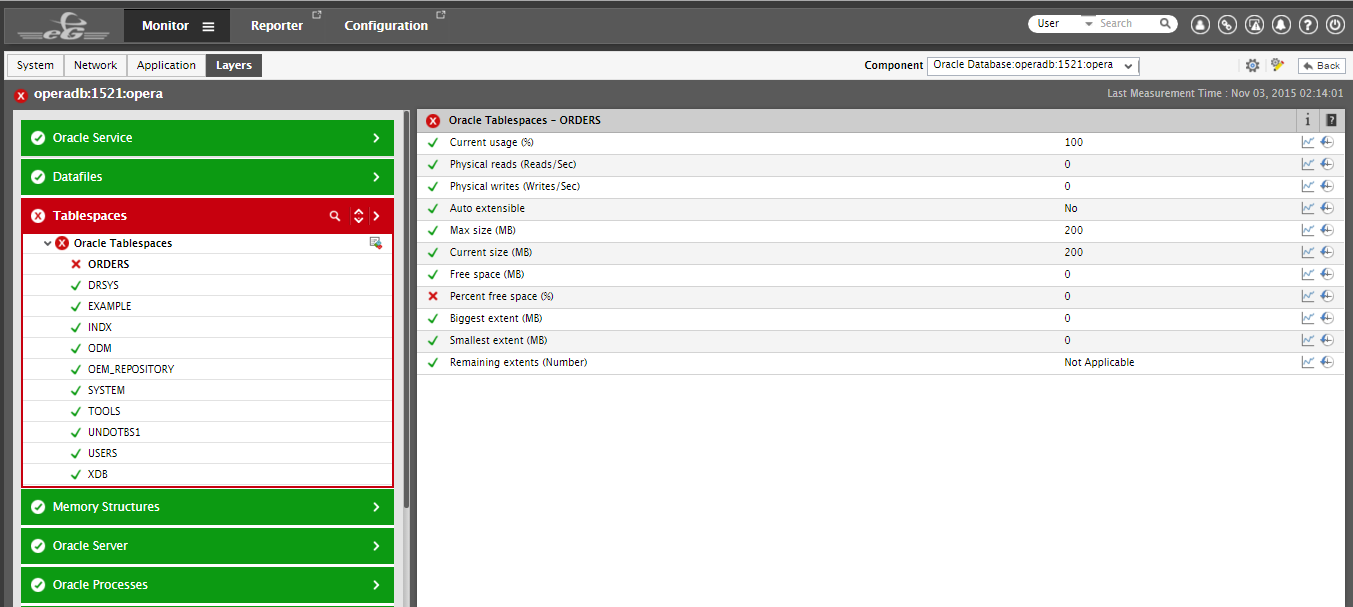
Figure 10 : The problem layer, test, and measure of the Oracle database server
Figure 10 clearly indicates that the Critical issue is because the orders tablespace of the Oracle database server is being over-utilized, and is hence running out of free space. With that, we can conclude that the lack of free space in the orders tablespace is the reason why a Critical issue occurred on the Oracle database server.
eG Enterprise saves you the trouble of navigating the System and Component tab pages to determine what is ailing the Oracle database server. Instead, you can simply click on the Oracle database server component in the Critical state in the Topology tab page (of Figure 5) itself to open Figure 10.
The Topology tab page (see Figure 5) also reveals that it is this Critical database server issue that has caused the Major issue with the XenApp server, the Minor issue with the IIS web server, and has ultimately stalled the delivery of the infoway web site service. To know how, let us first figure out what the Major problem with the Citrix XenApp server is. For that, switch to the Topology tab page and click the Citrix XenApp server component in the Major state. Figure 11 will then appear.
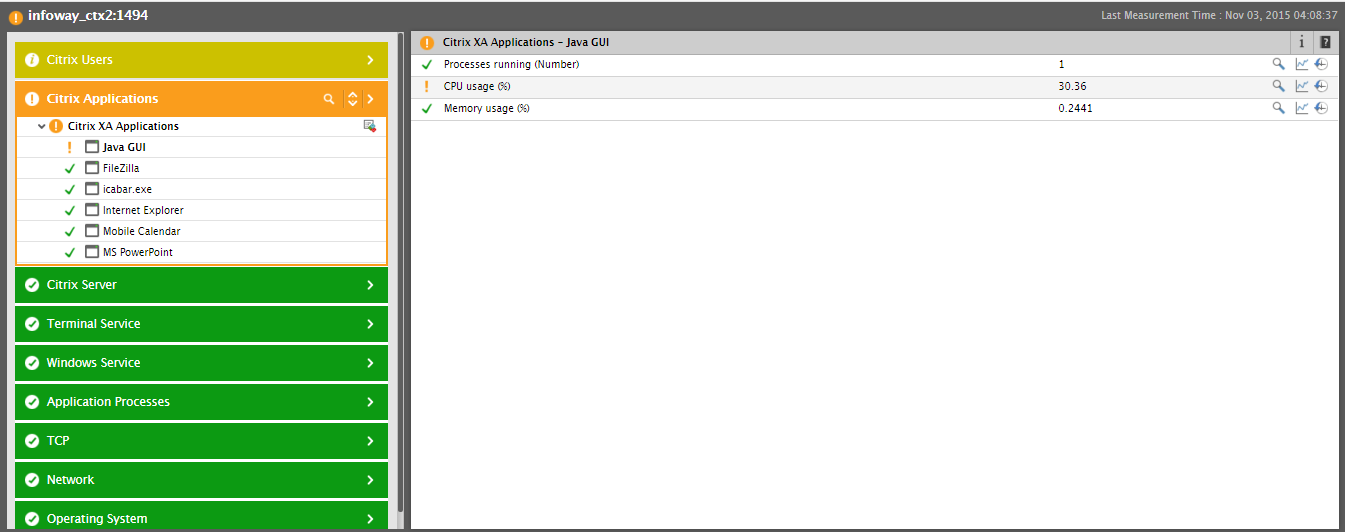
Figure 11 : The problem layer, test, and measure of the Citrix XenApp server
Figure 11 reveals that the Major problem is affecting the Citrix Applications layer, and the problem is owing to a high CPU usage of the java.exe application executing on the Citrix XenApp server. In this case, it turns out that the UserLogin transaction (see Figure 4), which registered errors, is being handled by a Java application that is hosted on the XenApp server. When the tablespace is full, the Java application keeps retrying to add a new user record, hence causing a Major CPU bottleneck on the XenApp server. Because record insertion failed, the UserLogin transaction also failed, resulting in a Minor issue on the IIS web server that is hosting the infoway web site. With that, we can conclude that the lack of free tablespace is the root-cause of the Critical slowdown in the delivery of the infoway web site service.
If one/more aggregate components have been created using the components of a service, then an additional Aggregates tab page will appear when monitoring that service. In the case of our infoway web site service too, you can see the Aggregates tab page. Clicking on that tab page will reveal Figure 12.
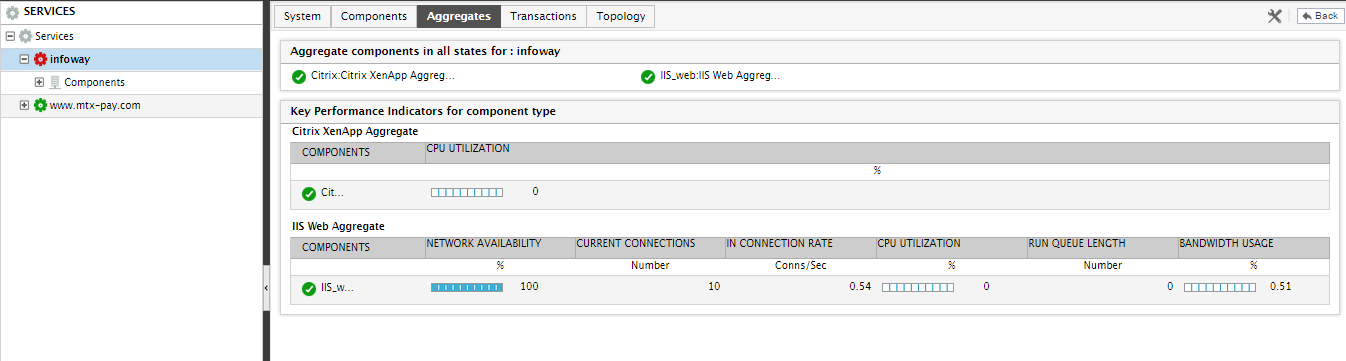
Figure 12 : The Aggregates tab page
From Figure 12, you can infer that the Citrix XenApp server and IIS web server components that are associated with the infoway web site are also part of a Citrix XenApp Aggregate component and an IIS Web aggregate component, respectively. The Aggregates tab page also reveals the names of these aggregate components, the current state of these aggregates, and key aggregate metrics reported by each of these components. You can also override the default metrics list by adding more measures to this tab page or removing one/more existing measures. For that, use the settings window that appears when the icon is clicked.
A quick glance at this Aggregates tab page can reveal abnormalities related to aggregate components and the metrics responsible for the same. Clicking on an aggregate component here will allow you to zoom into the layer model of that component.