The CURRENT ALARMS Window
As stated already, when a user logs in as the supermonitor, he/she is entitled to the privileges of the Supermonitor role. This means that a supermonitor receives an unrestricted view of the environment.
Note:
As discussed already, the monitoring rights of a Supermonitor are the same as that of the Admin and ServerAdmin user roles. Therefore, this chapter will not discuss the Admin and ServerAdmin roles separately.
To begin with, the supermonitor gets to view the current alarms window that displays the list of current alarms to the eG Enterprise system (see Figure 1), in the order of their priority.
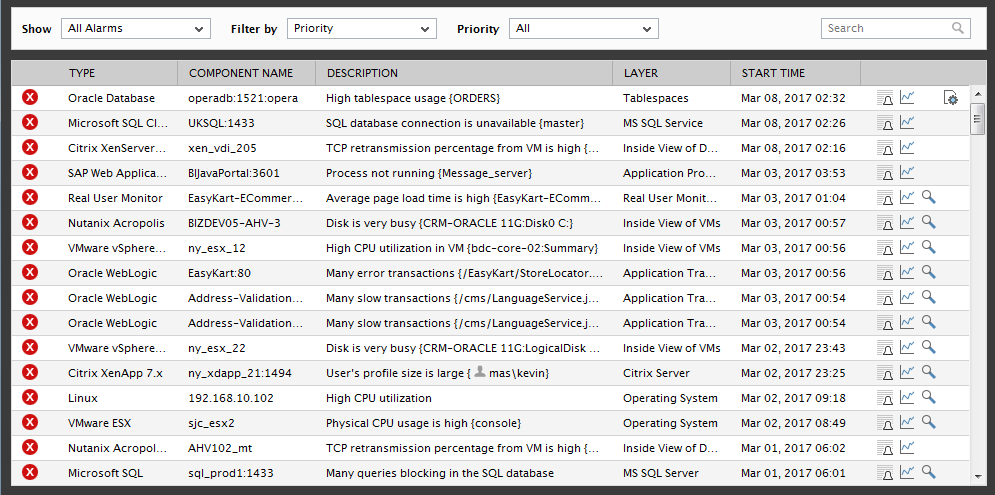
Figure 1 : The CURRENT ALARMS window displaying the current alarms
Note:
If required, you can make sure that the current alarms window does not pop up by default when a user logs into the eG monitoring console. For this, do the following:
- Login to the eG administrative interface.
- Click on the
 icon available in the Admin tab, and select the Monitor option from the Settings tile.
 - Click on the Alarms sub-node under the General node in the settings tree-structure.
- Set the Alarm popup flag that appears in the right panel to No. By default, this flag is set to Yes.
- Finally, click the Update button.
Following conventional management practices, eG Enterprise applies the color-coding scheme mentioned below to indicate alarm priorities:
| Color | Priority | Description |
|---|---|---|
|
Red |
Critical |
Indicates the existence of a critical issue that requires immediate attention |
|
Orange |
Major |
Indicates the existence of an issue that could cause serious consequences if not looked into soon. |
|
Yellow |
Minor |
Indicates the existence of a low priority issue. Proactive alerts fall in this category. |
The current alarms window (see Figure 50) also indicates the problem component-type, IP/host name of the component that has encountered a problem, the layer that has been affected, and the date and time of the problem. Accordingly Figure 51 indicates critical problems with the Inside View of Desktops layer of th eCitrix XenServer - VDI, the eG Access layer of the eG Manager serve and the Outside View of VMs layer of hte VMware vSphere VDI.
Typically, whenever an alarm is raised for problems at the host-level of a component, the Component type in the current alarms page is automatically set to Host system, even if the component affected is a say, Oracle database server or a Web server. The service desk may hence not be able to quickly determine the exact component-type of the affected component from the alarm information. Moreover, help desk personnel may prefer to view the operating system of the problem host as part of the alarm information displayed in the current alarms page, as such an information will greatly simplify the troubleshooting process. To make sure that the current alarms page enables help desk to easily understand, interpret, and solve problems affecting a host's performance, you can optionally configure the eG Enterprise system to display the actual Component type, Host system, or the affected Operating system for host-level alarms in the current alarms page. To enable this capability, do the following:
- Edit the eg_ui.ini flag in the <EG_INSTALL_DIR>\manager\config directory
-
In the [HOST_SYSTEM] section of this file, set the Show_HostSystem flag to any one of the following values mentioned below:
- Set the Show_HostSystem flag to HostSystem if you want the component type to be displayed as Host system for the host-level alarms;
- Set the Show_HostSystem flag to CompType if you want to display the affected component; This is the default setting that is provided;
- Set the Show_HostSystem flag to OS if you want to display the operating system of the host;
- Finally, save the file.
Note:
This configuration affects the history of alarms page, email/SMS alerts, and SNMP traps as well.
To know more about the exact nature of the problem, click the  icon available against each alarm displayed (see Figure 2). An ALARM DETAILS pop up window then appears with additional alarm information in the form of a brief description of the problem, the test that detected the problem, the test that reported the problem, the host on which the test executed, and the corresponding site name (if any) will be displayed (see Figure 2).
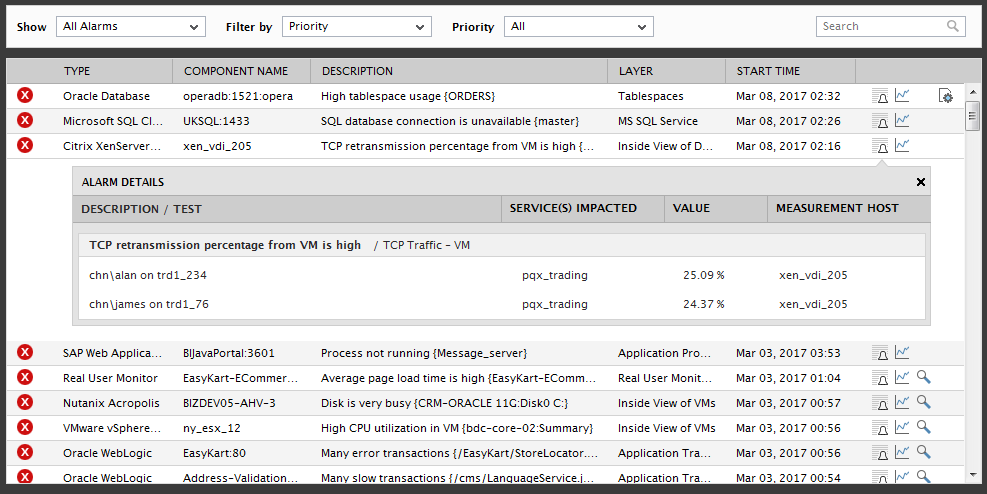
Figure 2 : Additional alarm information
Note:
- The value column of the additional alarm details displayed in Figure 2 reports the last measure value and unit of the problem measure. The alarms window and email alerts will display the last measure value only if the Show last measure value in alerts flag in the mail alert configuration section of the mail alert preferences page is set to Yes in the eG admin page.
- Similarly, email alerts can be sent to the administrators with the detailed diagnosis information. In highly secure environments, administrators may not want to expose certain columns of the detailed diagnosis which contains confidential information through the email alerts. Therefore, eG Enterprise provides users with the option to hide such confidential information from the email alerts. To do so, you can provide an entry under the [eg_ud_measure_hide_columns] section of the <EG_INSTALL_DIR>\manager\config\eg_format.ini file in the following format: Testname:Measure=column name where, Testname is the internal name of the test, Measure is the internal name of the measure and the column name is the column in the detailed diagnosis that need to be removed from the email alert.
Besides, a Graph icon is available against every alarm. Clicking on this icon invokes a graph of the problem measure for a default period of 1 hour (see Figure 3). Using this graph, you can observe the time-of-day variations in the behavior of the problem measure.
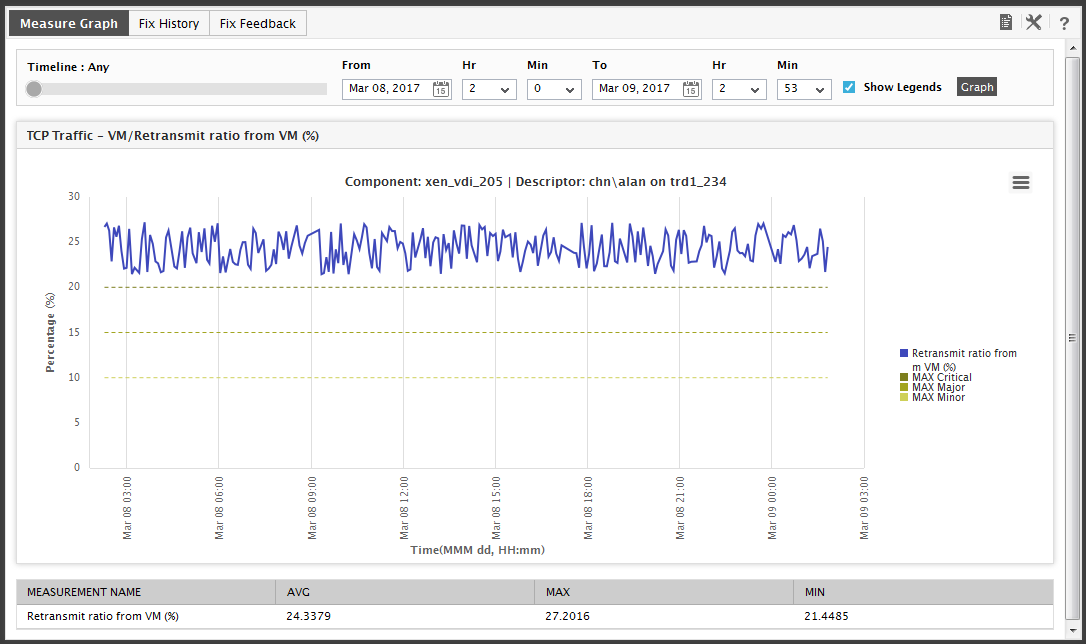
Figure 3 : A graph of the problem measure
Note:
To override the default measure graph Timeline of 1 hour, do the following:
- Login to the eG administrative interface as admin.
- Click on the icon available in the Admin tab, and select the Monitor option from the Settings tile.
- Select the Graph option from the General Settings tree Select the Graph option
- Specify a timeline against the Timeline for graphs text box in the GRAPHS section
- Update the changes.
Moreover, to make diagnosis more efficient and accurate, eG Enterprise embeds an optional detailed diagnostic capability. With this capability, the eG agents can be configured to run detailed, more elaborate tests as and when specific problems are detected. For example, when the CPU usage of a host reaches the threshold, the agent can be configured to provide more details - e.g., the top 10 process that are consuming more CPU resources. Optionally, this capability can also be configured to periodically generate detailed measures, regardless of the occurrence of problems.
If the detailed diagnostic capability is enabled for the problem measure indicated by the current alarms window, then a special dd icon will be available against the corresponding alarm (shown in Figure 4).
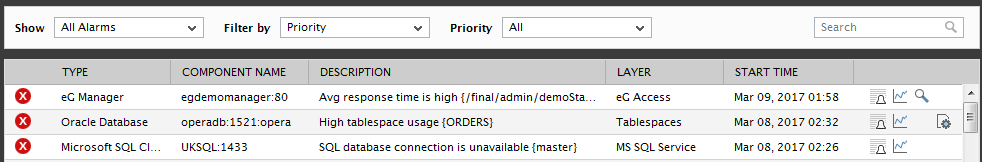
Figure 4 : The CURRENT ALARMS window displaying the DD icon
Clicking on the icon reveals detailed information pertaining to the problem condition, so that you can quickly and accurately zero-in on the root-cause of the problem. For instance, the current alarms window of Figure 1 indicates excessive CPU utilization on a host iis. Against the 'High CPU utilization' alarm raised on Processor_0 of this host, you will find a 'magnifying glass' icon. Clicking on this icon will list the top-10 CPU-consuming processes that were executing on Processor_0 of the host during the last hour (by default), thus enabling you to identify the exact process that is causing the issue (see Figure 4). To view the detailed measures related to any other processor supported by the same host, you can pick a different option for analysis from the Description list of Figure 4 and click the Submit button. Similarly, you can change the Measurement and the Timeline for the detailed diagnosis using Figure 5.
Note:
The DD icon will not appear in the current alarms window under the following circumstances:
- If the eG license does not support the detailed diagnosis capability
- If detailed diagnosis is not enabled for the test that generates the problem measure
- If no detailed measures are available for a problem test
Most administrators will agree that not all performance issues are caused by problems with the internal operations or the external network traffic/connectivity of a component. Sometimes, unplanned/unauthorized/accidental configuration changes can also adversely impact server performance. eG Enterprise optionally provides a dedicated Configuration Management module, which enables you to keep track of changes to the configuration of target components and analyze the performance impact of such changes.
Moreover, if the solution captures a configuration change in a component around the same time at which a performance issue was detected with that component, then the current alarms window will instantaneously turn your attention to the change by tagging that alarm with  symbol, as depicted by Figure 5 below:
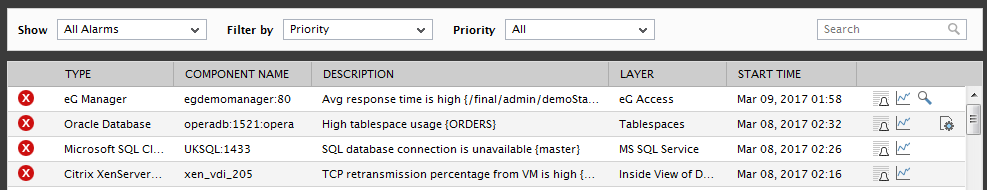
Figure 5 : Tracking configuration changes in managed components
Clicking on the symbol will open a small pop up window as shown in Figure 6 helps you in viewing the recent configuration changes that were made to the problem component from the CURRENT ALARMS page itself. This pop-up window will indicate which configuration metric changed, when, what its previous value was, and what it changed to.
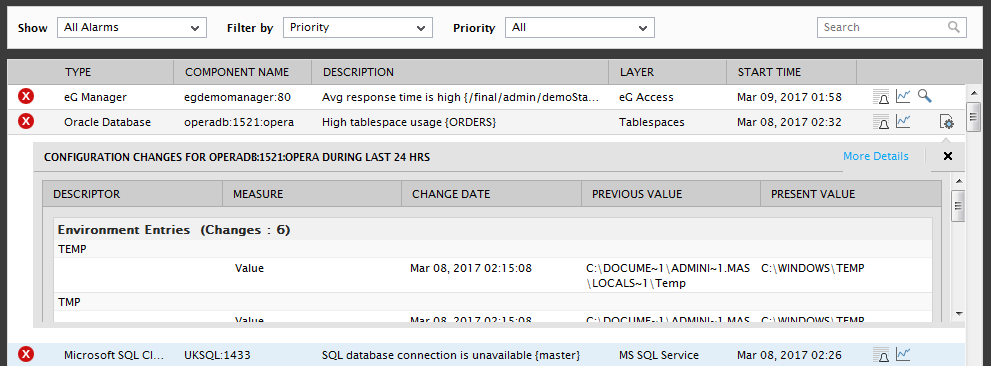
Figure 6 : Viewing the recent configuration changes to a problem component
Some changes to configuration may not be obvious at first glance. For instance, in the case of configuration metrics with values that run to a few lines, a small change in the middle of a line may go unnoticed, even if both the previous and current values are provided. eG Enterprise zooms into such configuration changes and highlights exactly what has changed, where. Such changes are tagged with the  icon at the end (see Figure 7).
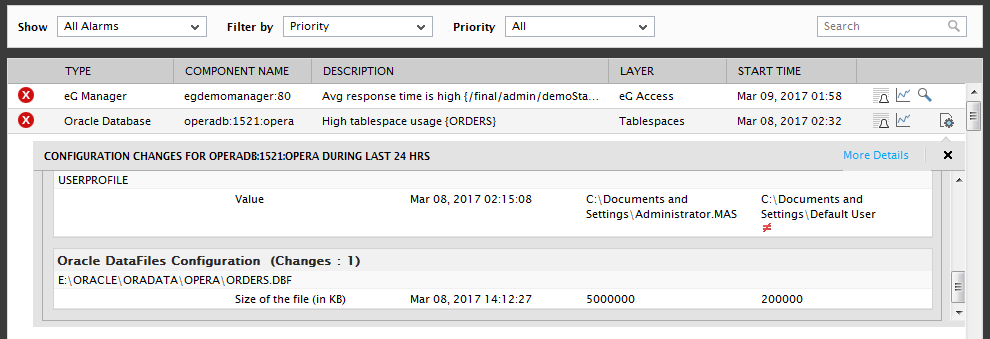
Figure 7 : An intricate configuration change that has been tagged with a special icon to enable zoom-in
Clicking on this icon will open a Difference window (see Figure 8). The Difference section in this window clearly highlights where changes have taken place. From the Added and Removed sections, you can instantly figure out what has been newly added to the value of the configuration measure, and/or what has been removed.
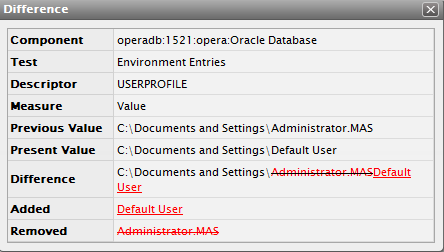
Figure 8 : Zooming into a particular configuration change
By default, a select few metrics alone have been marked by eG for a closer look when configuration changes occur. The value of such measures alone is tagged with the
icon. If required, you can override this default list by allowing the ‘difference’ drill-down for additional metrics. For this, follow the steps below:
- Edit the eg_configtests.ini file in the <eg_install_dir>\manager\config directory.
-
In the [show_differences] section of the file, you will find some default entries of the following format:
<Internal_name_of_configuration_test>=<Comma-separated list of configuration metrics for which changes need to be highlighted>
-
If required, you can append more measures of a test to the comma-separated list. You can also add more test-measure combinations to this section. For instance, you can add the following entry to this section:
IpSettings_cf=Description,Ip_add,Subnet,DHCP_server,DNS_server,WINS_server
Note that only internal test names and measure names should be specified.
- Finally, save the file.
Clicking the More Details in Figure 6 will lead you to Figure 9, using which you can instantly figure out the configuration change that may have contributed to the problem at hand.
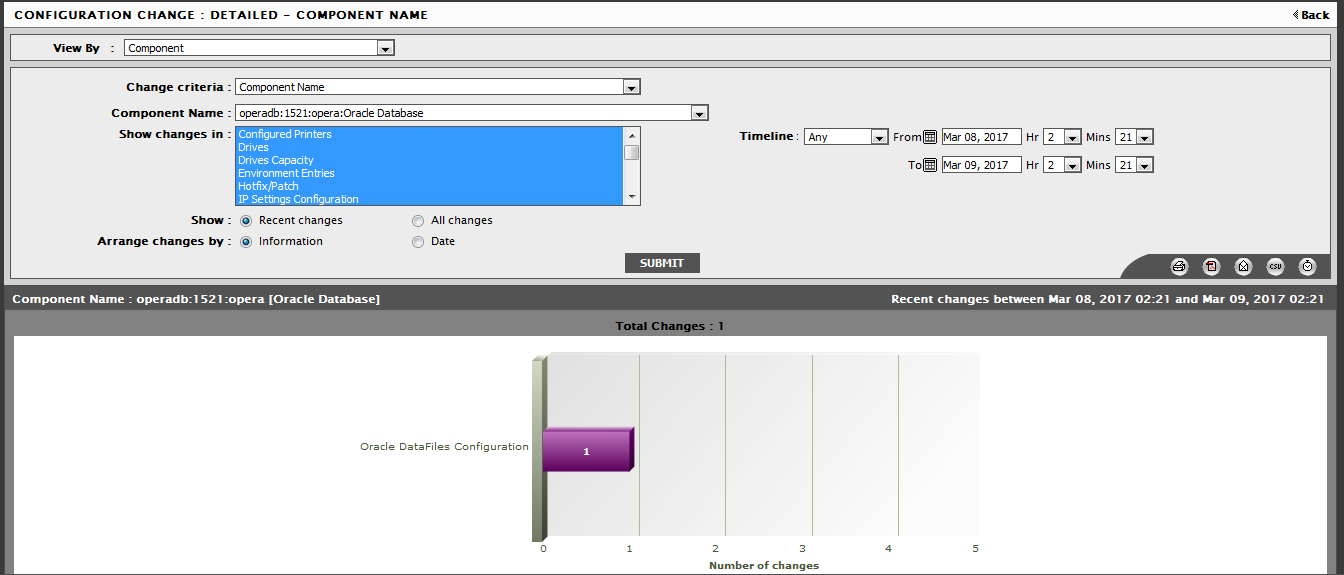
Figure 9 : Changes in the configuration of a component
By default, the alarm window displays alarms of all priorities. This is indicated by the default selections in the Filter by and Priority lists. In Figure 52, you can see that the Priority option is chosen by default from the Filter by list, and the All option is chosen by default from the Priority list.
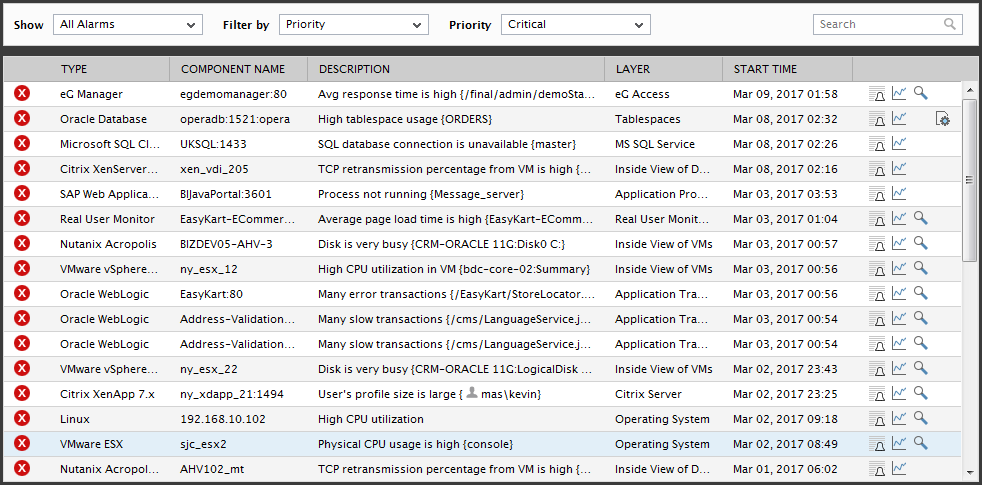
Figure 10 : Viewing the critical alarms
To view only the critical alarms, select the Critical option from the Priority list box (see Figure 10).
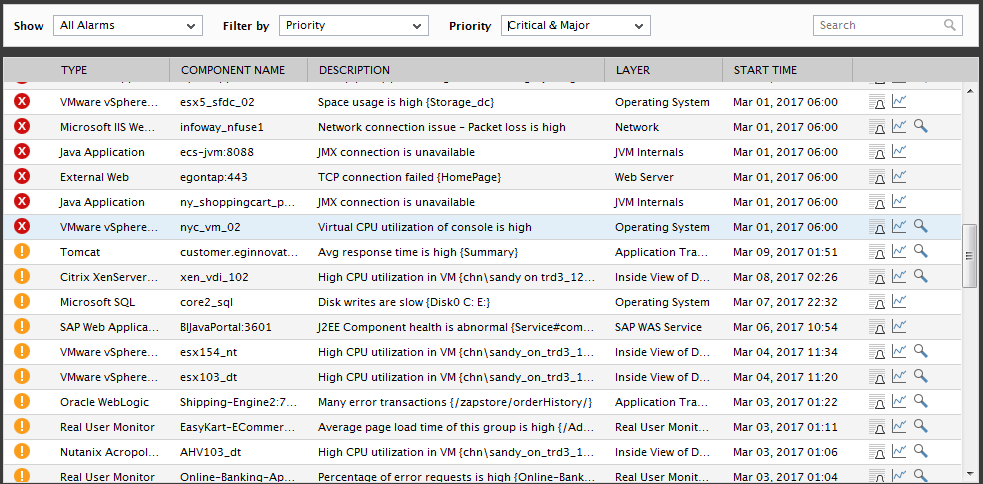
Figure 11 : Viewing the critical and major alarms
Likewise, you can view the Critical & Major alarms together, or view the Major or Minor alarms alone by selecting the corresponding options from the Priority list.
Besides Priority, alarms can also be filtered on the basis of Component Type, Services, Segments, or Zones. For instance to view the alarms pertaining to a particular component type alone, pick the Component Type option from the Filter by list, and then select a component type of your choice from the Types list (see Figure 10). For instance, Citrix administrators would typically be more concerned with issues pertaining to their mission-critical Citrix XenApp installations. To focus on Citrix-related issues alone, Citrix administrators can filter the alarms list by selecting Component Type from the Filter by list and then choosing the Citrix XenApp option from the Component Type list (see Figure 12).
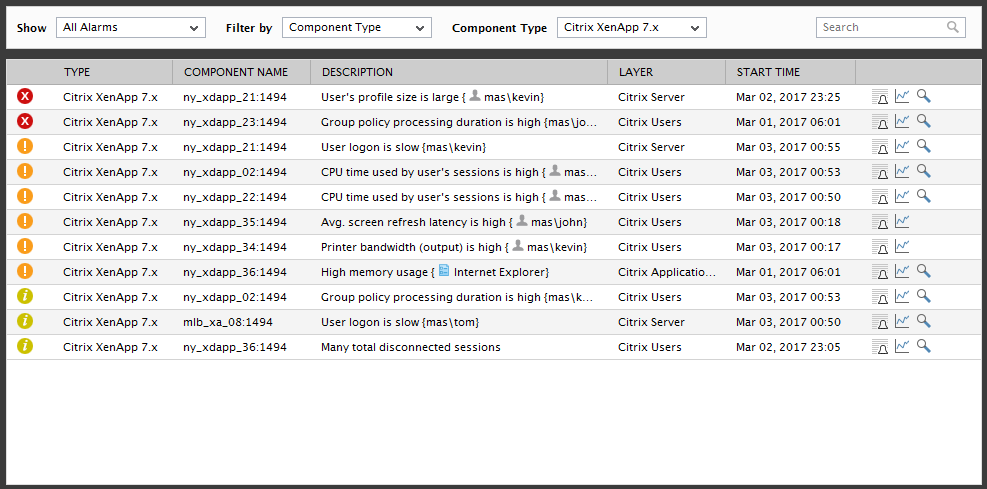
Figure 12 : Filtering the alarms based on Component Type
Likewise, service managers can filter the alarms list to view only those alarms that are impacting a particular business service's performance. For this, they need to select the Services option from the Filter by list, and pick a service of interest to them from the Services list (see Figure 12).
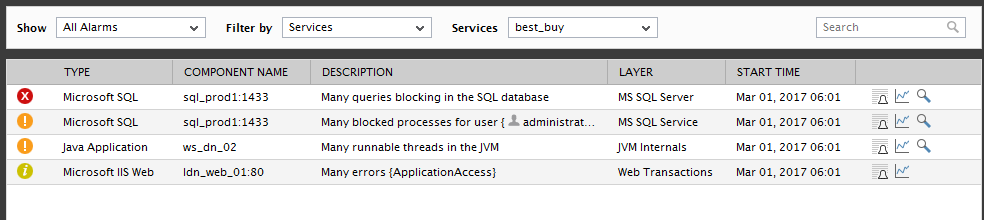
Figure 13 : Filtering the alarms based on Service name
In the same way, performance degradations experienced by the components in a segment/zone can also be viewed in the current alarms window.
You can even run quick searches on the alarm window to locate alarms of interest to you. The default criterion for such searches is component type; this is indicated by the default selection, Type, in the Search by list in Figure 13. To search for alarms related to a component type, specify the whole/part of the name of that component type in the text box next to the Search by list and click the 'magnifying glass' icon adjacent to it. All alarms related to component types with names that match the specified search string will then appear in the alarms window (see Figure 13).
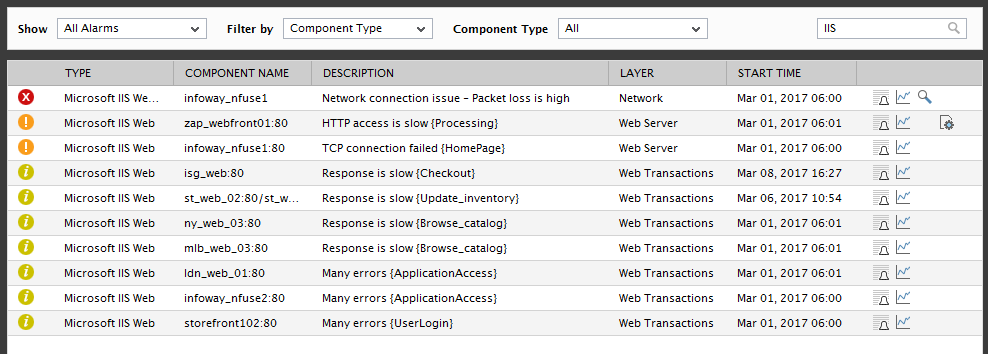
Figure 14 : Searching for the alarms related to a particular component type
You can even search for alarms related to a Component, alarm Description, or Layer, by picking the desired option from the Search by list, and specifying a search string in the text box next to it.
Also, with a single mouse click, you can change the order in which the alarms are sorted in the current alarms window. By default, alarms are sorted in the descending order of the start time of issues. To arrange them in the ascending order of start time, simply click on the column label - start time - in Figure 14. The current sort order will be depicted by an 'arrow' symbol in the sorted column - while an 'up arrow' symbol signifies the ascending order, the 'down arrow' denotes the descending order. This way, you can quickly arrange the contents of the alarms window in the ascending/descending order of any of the displayed columns.
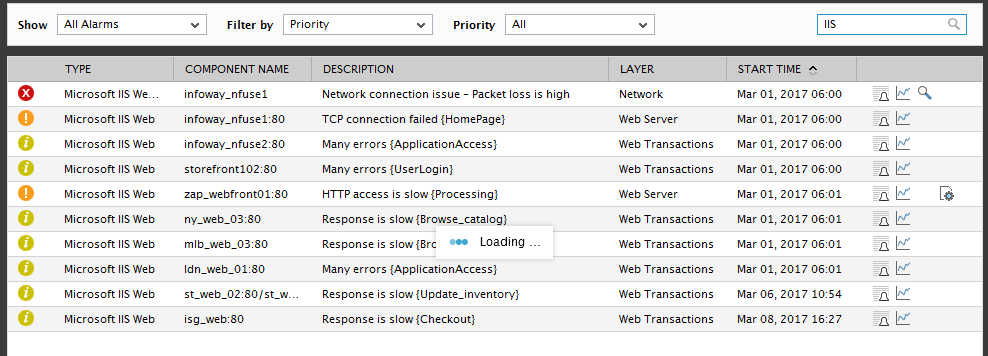
Figure 15 : Sorting the alarms in the ascending order of the START TIME of issues
In addition to the above, the option to delete alarms can be enabled for specific monitor users registered with the eG Enterprise system. While creating/modifying the profile of a user using the eG administrative interface, you can set the Allow alarm deletion flag to Yes for that user, if you want to grant him/her the right to delete alarms. By default, the alarm deletion capability is disabled for all users (including the admin and supermonitor users) to the eG monitoring console.
If the capability has been explicitly enabled for a user, say the supermonitor, then the alarms window will display an additional delete button. To delete an alarm, select the check box corresponding to the alarm, and then click the delete button.
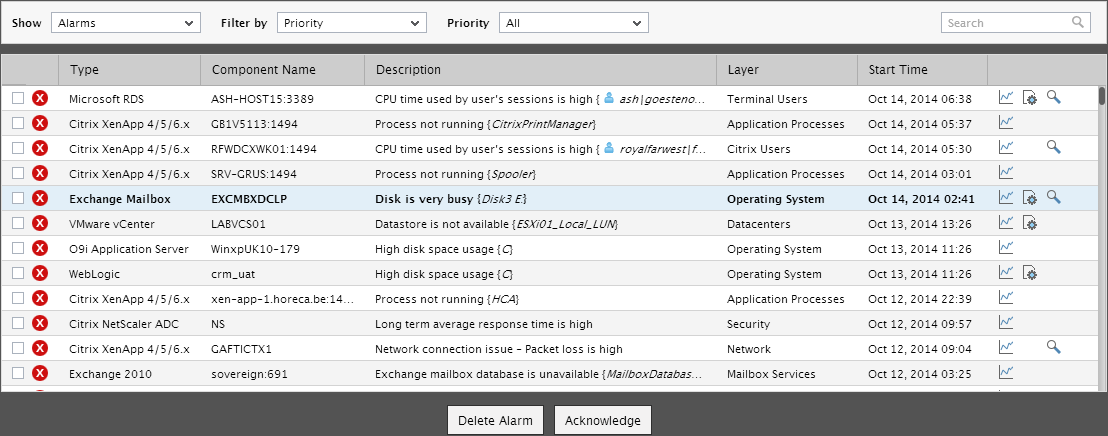
Figure 16 : The ALARMS window with the option to ACKNOWLEDGE alarms
Doing so will invoke Figure 16, where you can provide a Reason for deleting the chosen alarm. You may also decide not to provide any Reason for the deletion, if you so desire. Click the Submit button to save the reason, and to confirm the deletion of the alarm.
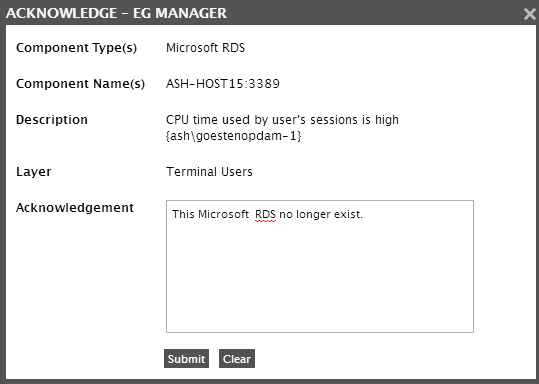
Figure 17 : Providing a reason for the alarm deletion
Note:
- If required, you can delete multiple alarms simultaneously, by selecting the check boxes corresponding to the alarms and clicking the Delete button. A common Reason can then be provided for such a deletion.
- Even after an alarm is deleted, the problem measure for which the alarm was originally raised will continue to remain in the abnormal state, until the problem in question is actually resolved. However, the component, layer, and test associated with the problem measure will be in the normal state.
Optionally, an acknowledgement can be provided for an alarm displayed in the eG monitor interface (see Figure 18). By acknowledging an alarm, a user can indicate to other users that the issue raised by an alarm is being attended to. In fact, if need be, the user can even propose a course of action using this interface. In such a case, a user with Admin or Supermonitor privileges (roles) can edit the acknowledgement by providing their own comments/suggestions on the proposed action. The acknowledgement thus works in three ways:
- Ensures that multiple members of the administrative staff do not unnecessarily invest their time and effort in working on a single issue;
- Serves as a healthy forum for discussing and identifying permanent cures for persistent performance ills;
- Indicates to other users the status of an alarm
In the CURRENT alarms window of Figure 4 select the check box corresponding to the alarm to be acknowledged, and click on the acknowledge button therein. This button will appear only if the current user is authorized to either acknowledge an alarm / edit an acknowledgement.
Figure 16 will then appear using which the alarm can be acknowledged. To save the acknowledgement, click the submit button in Figure 17.
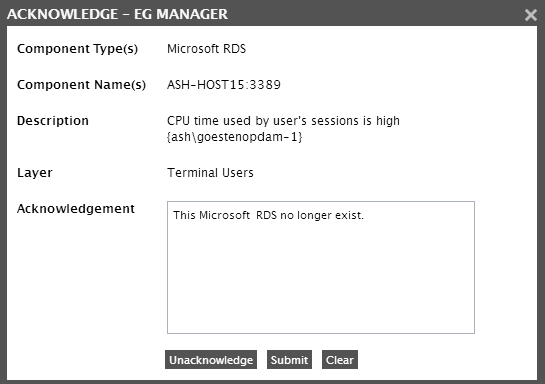
Figure 18 : Submitting an acknowledgement
Doing so will lead you back to the CURRENT alarms window, but this time, a symbol indicated by Figure 18 will prefix the acknowledged alarm. Moving your mouse pointer over the symbol will reveal the details of the acknowledgement such as its description, and the user who has acknowledged the alarm, and the date and time specifications of the acknowledgement.

Figure 19 : Figure 5.31: The acknowledgement description
In large environments, it is but natural that the same set of components are assigned to multiple users for monitoring. In such environments, some/all the users with monitoring rights to a component might want to post their comments for an alarm related to that component. If acknowledgment rights are granted to all these users, then each of them can login to the monitor interface and provide an acknowledgement description for the same alarm using the procedure discussed in Section 1 above.
eG Enterprise maintains a history of the acknowledgement descriptions provided by multiple users with rights to monitor a single component, and lists the entire history the next time one of these users attempts to view the acknowledgement details (see Figure 19) in the current alarms window. This way, the administrative staff can share the responsibility for resolving critical issues, brainstorm online to identify accurate remedies, and even provide each other with quick updates on problem status.
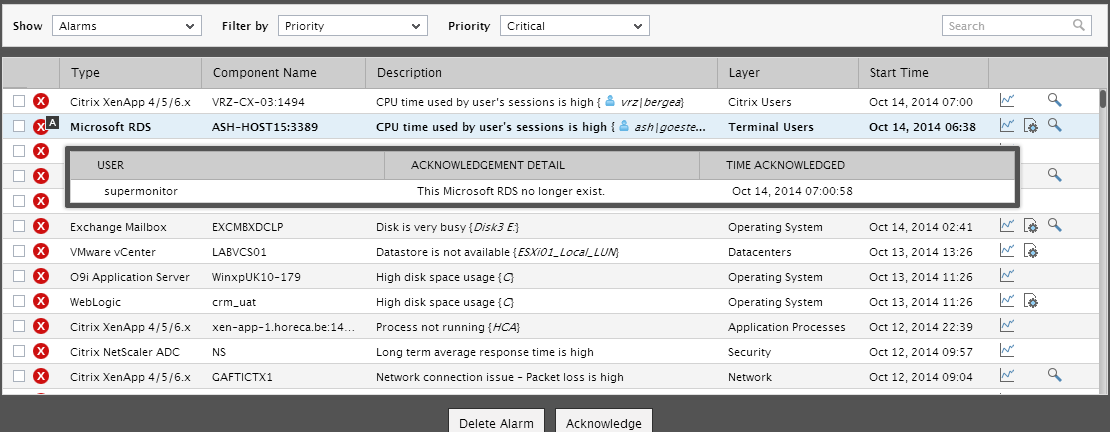
Figure 20 : Details of the acknowledgement
An alarm can also be unacknowledged, but only by the user who originally submitted the acknowledgement.
For unacknowledging, once again, select the check box corresponding to the acknowledged alarm in the CURRENT alarms window and click the acknowledge button therein. When Figure 19 appears, click on the unacknowledge button in it. This will make sure that the ‘acknowledgement’ symbol is removed from CURRENT alarms window.
Note:
A user can edit/unacknowledge only those acknowledgement descriptions that he/she originally provided.
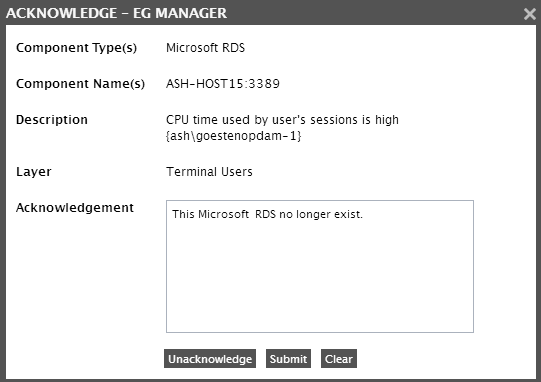
Figure 21 : Unacknowledging an alarm
The alarm window will refresh periodically to show the latest set of alarms.
Note:
The default refresh period of the alarm page is 60 seconds. This however, can be changed by modifying How frequently alarm page is refreshed in the refresh section of the monitor settings page in the eG administrative interface.
Clicking on an alarm will lead monitor users to a page that displays the layer model, tests, and measurements pertaining to the problem component (see Figure 21).
Note:
In large environments where Real User Monitor component is monitored, multiple alerts may be generated during a short span of time for the component which may overload the CURRENT ALARMS window. To avoid alarms being displayed in the CURRENT ALARMS window for such tests- components combination, administrators can configure those tests/measures for which alerts are to be suppressed in the [HIDE_MEASURES_FROM_UI_ALARMS] section of the eg_dashboardConfig.ini file located in the <EG_INSTALL_DIR>/manager/config location. The tests/measure combinaion should be of the following format:
<Internal name of the test>=<Internal name of measure 1>,<Internal name of measure 2>...<Internal name of measure n>
For example, if you wish to suppress the alerts for the Page views and Slow page views (Tolerating & Frustrated) measures of the Page Groups test, then your specification under the [HIDE_MEASURES_FROM_UI_ALARMS] section should be as shown below:
RUMGrpTest=Page_Requests,Slow_Requests
If you wish to suppress the alerts for all the measures of a test, then you can specify All against the test name. For example, if you wish to suppress the alerts for all the measures of the Page Groups test, then you should specify the following:
RUMGrpTest=All
Likewise, to suppress the alerts through email/SMS and SNMP traps, you can use the [HIDE_MEASURES_EMAIL_SMS_SNMP_TT] section of the eg_dashboardConfig.ini file located in the <EG_INSTALL_DIR>/manager/config location.
Besides open issues, you can also use the current alarms window to view the tests that are currently in an unknown state in the environment. A test can switch to an unknown state when the eG Enterprise system is unable to determine the state of one/more metrics that test reports - this could be because of any of the following reasons:
- The test could have been wrongly configured;
- The eG agent executing the test could have suddenly stopped;
- The eG agent may have been unable to pull out metrics from the server;
- The eG agent executing the test may not be able to transmit the metrics collected by that test to the eG manager, owing to say, poor network connectivity;
To enable administrators to receive a heads-up on the Unknown tests in the environment, so that issues such as the ones mentioned above can be isolated and resolved, the Show list in the left top corner of the current alarms window includes a special Unknowns option.
Selecting the Unknowns option from the Show list invokes Figure 21, where the tests in an indeterminate (i.e., unknown) state, the layers to which the tests are mapped, the names of the components they are associated with, and their corresponding component types will be listed.
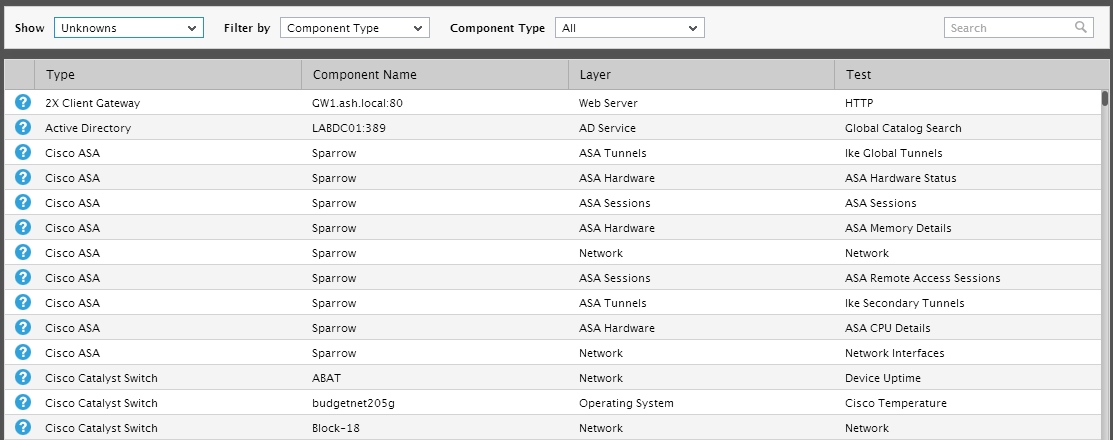
Figure 22 : The components, tests, and metrics in an Unknown state
By moving your mouse pointer over any test in Figure 22, you can determine which measure(s) of the test is in the unknown state currently and which services are impacted by this (see Figure 23).
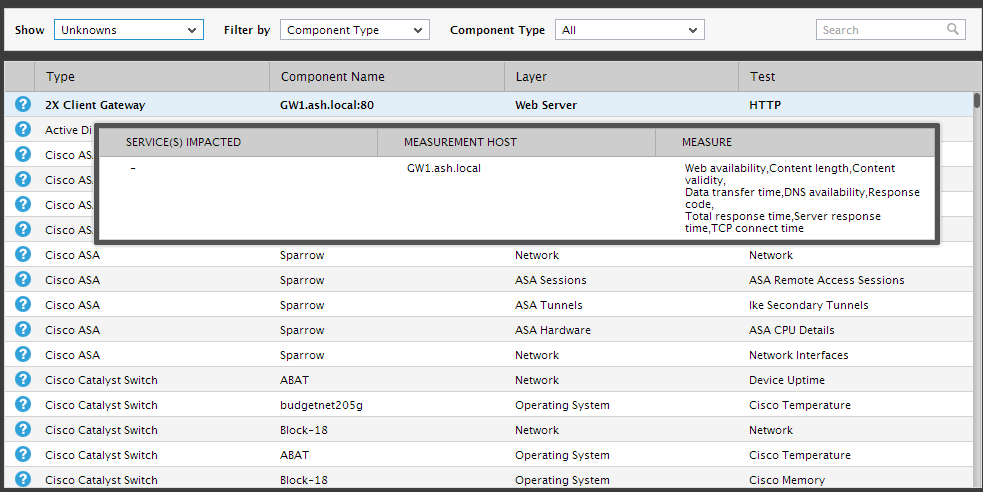
Figure 23 : Viewing additional information related to the Unknown alerts
By default, the eG Enterprise system displays the unknown tests across all managed component types in the environment in Figure 22 and Figure 23. This is why, the Filter by list is set to Component Type by default and the Types list is set to All by default in Figure 24. To view the Unknowns related to a specific component type, pick any type of your choice from the Types list. Doing so will list only those unknown tests that are associated with the components of the chosen Type (see Figure 24).
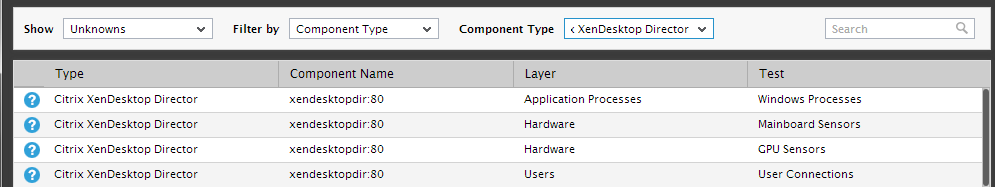
Figure 24 : Viewing the details of Unknowns related to a specific component type
You can even filter the Unknowns list on the basis of service and segment names, so that you can quickly figure out which service/segment components have been affected by Unknowns and what tests and metrics are causing this. For instance, to view the Unknown tests in a service, select Services from the Filter by list of Figure 24 and pick a service from the Services list. The service components with Unknowns, their corresponding component types, the layers to which the unknown tests are mapped, and the unknown tests themselves will then be listed, as depicted by Figure 24.
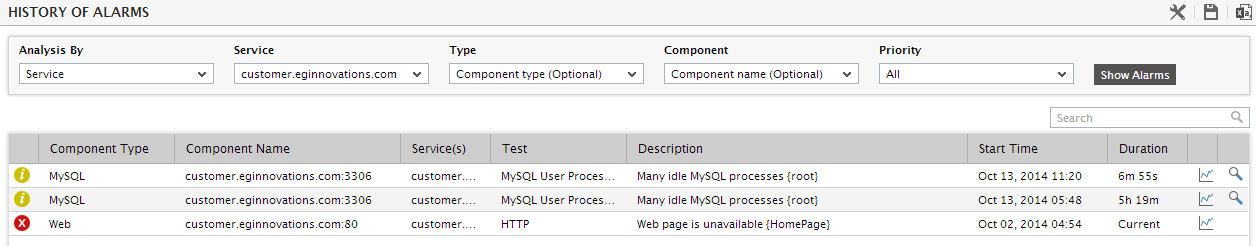
Figure 25 : Viewing the list of Unknowns in a particular service
Likewise, to view the details of Unknowns in a particular segment, pick Segments from the Filter by list, and select the Segment of interest to you. will then appear, where you can view the segment components with Unknowns, their corresponding component types, the layers to which the unknown tests are mapped, and the unknown tests themselves.
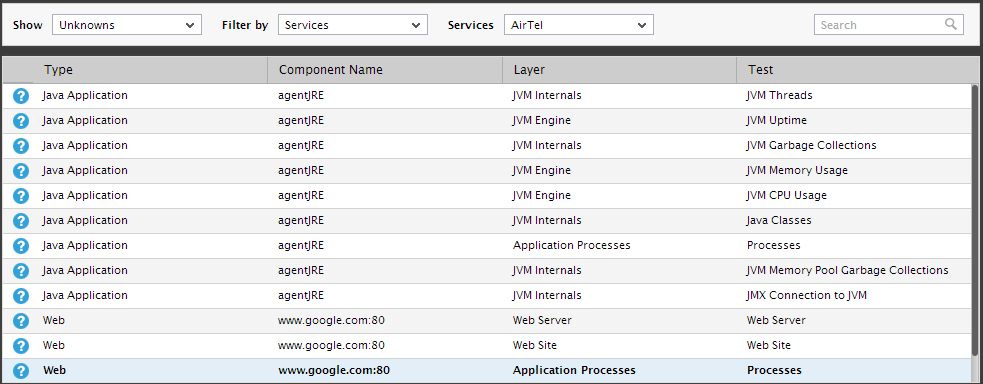
Figure 26 : Viewing the list of Unknowns in a particular segment
Where there are numerous components with Unknowns, you can quickly zoom into the Unknowns of specific interest to you using the search utility that the Unknowns window embeds. For instance, to view the Unknowns related to particular component type, pick the Type criterion from the Search by list and specify the whole or part of the component type to search for in the text box next to it. Then, click on the 'magnifying glass' icon within. This way, you can instantly access information related to the Unknowns in all component types with names that match the specified search string (see Figure 26).
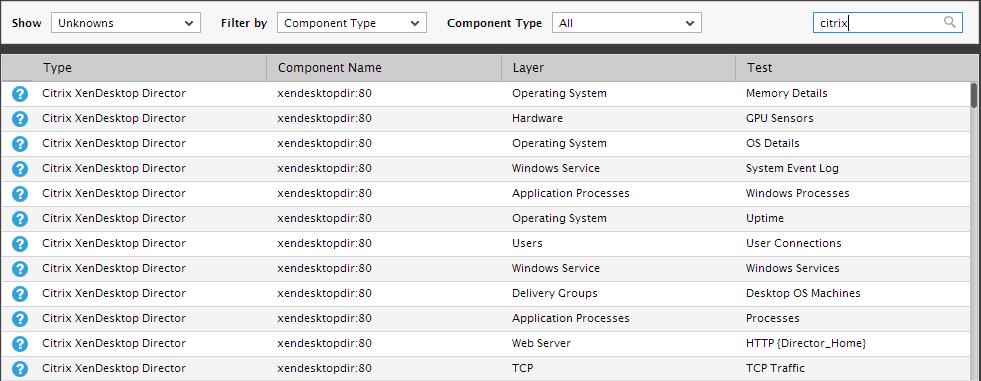
Figure 27 : Searching for the details of Unknowns in a particular component
Besides component Type, you can build search conditions on the basis of Component name, Test name, and Layer name by selecting the desired search criterion from the Search by list and specifying the corresponding search string in the adjacent text box.
Also, with a single mouse click, you can change the order in which the Unknowns are sorted. By default, Unknowns are sorted in the ascending order of the contents of the type column. This is indicated by the 'up arrow' symbol next to the column label - type. To arrange the Unknowns in the descending order of type, just click on that column label. This will automatically sort the Unknowns list in the descending order of component type and will suffix the column heading type with a 'down arrow' symbol (see Figure 27). To sort the Unknowns on the basis of any other column, simply click on that column heading.
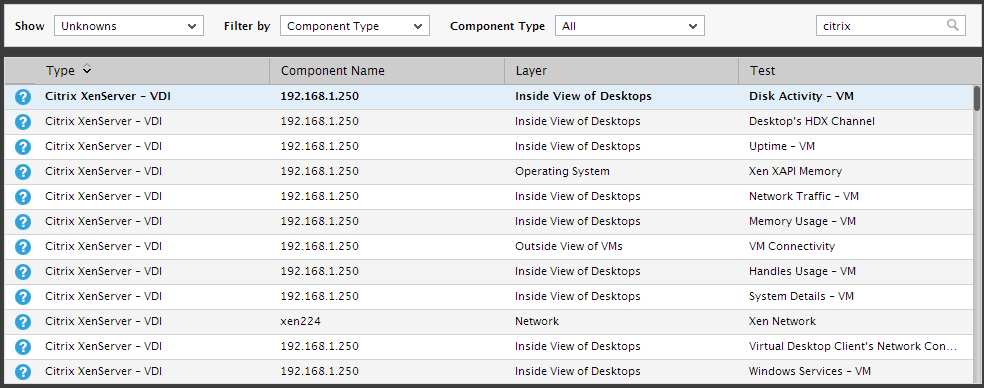
Figure 28 : Unknowns arranged in the descending order of component type