Alarms
Alarms
As we have seen in this chapter, eG Enterprise can be configured such that as and when a situation for an alarm arises, the manager automatically generates an email alert to the supermonitor. He/she can choose to view the current set of alarms or the entire history of alarms from the Alarms tile in the eG monitor interface.
When the supermonitor selects the History of Alarms option, he/she gets to view the entire list of alarms pertaining to the entire infrastructure over a period of time as in Figure 41.
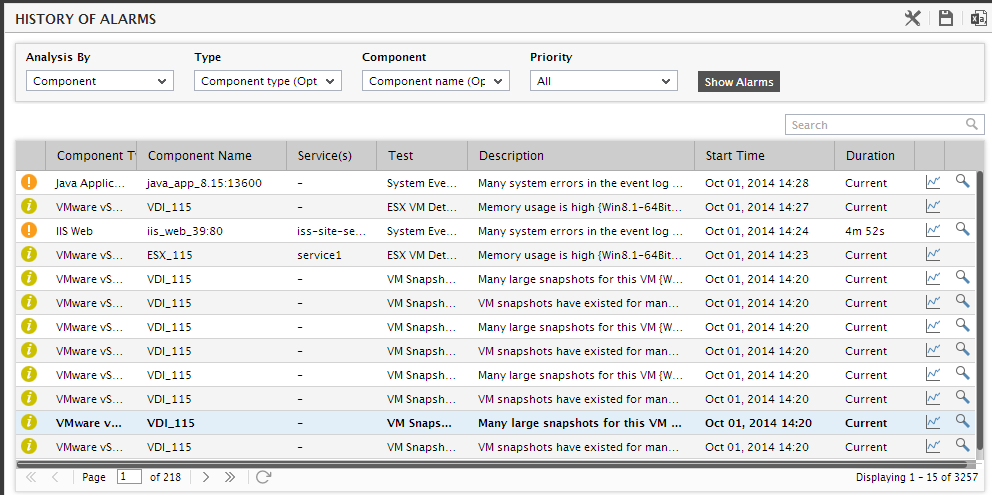
Figure 41 : History of alarms that the supermonitor can view
-
By default, as soon as you access the history of alarms page, you will view the alarm history of all managed components in the environment (see Figure 41). If required, you can build filter conditions using this page so that, you can selectively view the alarm history of the following infrastructure elements alone:
- Any managed component type in the environment;
- Any managed component;
- A component of a particular type;
- A specific segment / service / zone;
- A component-type that is part of a segment / service / zone;
-
A component that is part of a segment/service/zone;
The first step towards building these filter conditions is selecting a basis for the filter. This can be achieved by picking an option from the Analysis By list. The options available here are as follows:
- Component : This is the default selection in the Analysis By list. Owing to this default setting, the history of alarms page displays the alarm history of all managed components in the environment, by default. If you proceed with the default selection, then, you will find that the Component Type and Component lists in Figure 41are populated with all the managed component types and components (respectively) in the environment. If you want to view the alarm history of a particular component-type, pick that type from the Component Type list. Likewise, if you want to view the alarm history of a particular managed component, pick the name of that component from the Component list. If the Component list has too many components to choose from, then, you can condense the list by first picking a Component Type; this will make sure that the Component list consists of only those managed components that are of the chosen type. You can then easily pick the component of your choice from the Component list.
-
Zone: Selecting this option from the Analysis by list will invoke a Zone list. Select a particular zone from this list, if you want to view the history of alarms related to that zone. An Include Subzone flag also appears. By setting this flag to Yes, you can make sure that the alarm history also includes those alarms that are associated with the sub-zones of the chosen zone.
Once a Zone is selected, the Component Type and Component lists will be populated with those types and components (respectively) that are part of the selected zone. To view the alarm history of a particular component-type that is part of a zone, pick that type from the Component Type list. Similarly, to view the alarm history of a component that is part of a zone, pick that component from the Component list. If the Component list still has too many components to choose from, then, you can condense the list further by first picking a Component Type; this will make sure that the Component list consists of those components in the selected zone that are of the chosen type. You can then easily pick the component of your choice from the Component list.
Note that the 'Zone' option will not be available in the 'Analysis By' list if no zones are configured in the environment.
-
Segment: If this option is chosen from the Analysis By list, a Segment list will additionally appear. In order to view the alarm history pertaining to a specific segment, pick a segment from the Segment list.
Once a Segment is selected, the Component Type and Component lists will be populated with those types and components (respectively) that are part of the selected segment. To view the alarm history of a particular component-type that is part of a segment, pick that type from the Component Type list. Similarly, to view the alarm history of a component that is part of a segment, pick that component from the Component list. If the Component list still has too many components to choose from, then, you can condense the list further by first picking a Component Type; this will make sure that the Component list consists of those components in the selected segment that are of the chosen type. You can then easily pick the component of your choice from the Component list.
Note that the 'Segment' option will not be available in the 'Analysis By' list if no segments are configured in the environment.
-
Service: If this option is chosen from the Analysis By list, a Service list will additionally appear. In order to view the alarm history pertaining to a specific service, pick a service from the Service list.
Once you choose a Service, the Component Type and Component lists in Figure 41 will be populated with those types and components (respectively) that are engaged in the delivery of the said service. If you want to view the alarm history of a particular component-type that is part of the selected service offering, then, pick that type from the Component Type list. Similarly, if you want to view the alarm history of a component that supports the selected service offering, pick that component from the Component list. If the Component list still has too many components to choose from, then, you can condense the list further by first picking a Component Type; this will make sure that the Component list consists of those components in the selected service that are of the chosen type. You can then easily pick the component of your choice from the Component list.
Note that the 'Service' option will not be available in the 'Analysis By' list if no services are configured in the environment.
- Next, to view the alarms that have remained unresolved for a time period that is in excess of a specified duration, select the greater than option from the Duration is list, enter a value in the adjacent text box, and then select a unit of time from the list box alongside. For example, to view the history of the alarms that have remained unresolved for over 1 hour, select the greater than option, enter 1 in the text box alongside, and select hours from the list box adjacent to it.
- Similarly, you can view the history of alarms that have remained unresolved for a time period lesser than a specified duration. To achieve this, select the lesser than option from the Duration is list, specify a value in the adjacent text box, and select a unit of time from the list box.
- You can even choose to view the details of past alarms that are of a particular priority, by selecting that priority from the Priority list.
To override the default settings of the History of Alarms page, click on the  icon. The settings pop-up window appears:
- For viewing the details of alarms that were generated during a specific time window, select a fixed Timeline, or choose Any to provide a date/time range.
- If you want to view the alarm history of components with names that embed a specified string, enter the string to search for in the Component Search text box.
- You can even search based on alarm description. By providing the whole/part of an alarm description in the Description search text box, you can view the details of alarms with descriptions carrying the given search string.
- By default, you cannot view the acknowledgement/deletion history of alarms in the history of alarms page. Accordingly, the Show acknowledgements flag is set to No by default. To view the acknowledgement/deletion history of alarms, set this flag to Yes.
- Next, select the column by which the alarm history is to be sorted from the Sort by list.
- In addition, you can configure the number of event records to be displayed per page of the event history. By default, 15 records are displayed per page. To display more records, select an appropriate value from the Events per page list.
- Finally, click the Show Alarms button to generate the history of events.
- The details pertaining to every alarm like the start time, duration, name of the component, component-type, test, alarm description, and the service (if any) that is impacted by the issue, are available. Every row of alarm information will be accompanied by a colored indicator, that indicates the corresponding alarm priority. Critical alarms will be of the color red, major alarms will be in orange, and the minor ones come in pink. An alarm with the end time set to current denotes a problem that has still not been fixed.
-
Typically whenever an alarm is raised for the problems at the host-level of a component, the HISTORY OF ALARMS page automatically sets the Component type to Host system, even if the component affected is say, an Oracle Database server or a Web server. From this alarm information, users cannot determine the exact Component type of the affected component. Moreover, help desk personnel may prefer to view the operating system of the problem host as part of the alarm information displayed in the history of alarms page, as such information will greatly simplify the troubleshooting process. To make sure that the history of alarms page enables help desk to easily understand, interpret, and solve problems affecting a host's performance, you can optionally configure the eG Enterprise system to display the actual Component type, Host system, or the affected Operating system for host-level alarms in the history of alarms page. To enable this capability, do the following:
- Edit the eg_ui.ini flag in the <EG_INSTALL_DIR>\manager\config directory
-
In the [HOST_SYSTEM] section of this file, set the Show_HostSystem flag to any one of the following values mentioned below:
- Set the Show_HostSystem flag to HostSystem if you want the component type to be displayed as Host system for the host-level alarms;
- Set the Show_HostSystem flag to CompType if you want to display the affected component; This is the default setting that is provided; By default, this flag is set to CompType.
- Set the Show_HostSystem flag to OS if you want to display the operating system of the host;
- In the [alarm_history] section of this file, set the Show_Layer flag to yes to view the layer name for which the alarm is generated.
- Finally, save the file.
Note:
This configuration affects the current alarms window, email/SMS alerts, and SNMP traps as well.
Figure 42 : The Operating system of the host shown instead of Host System in the Comp Type column
-
If you had chosen a particular component name from the Component list, then, clicking the Show Alarms button will result in an alarm history that pertains to that component alone (see Figure 42).
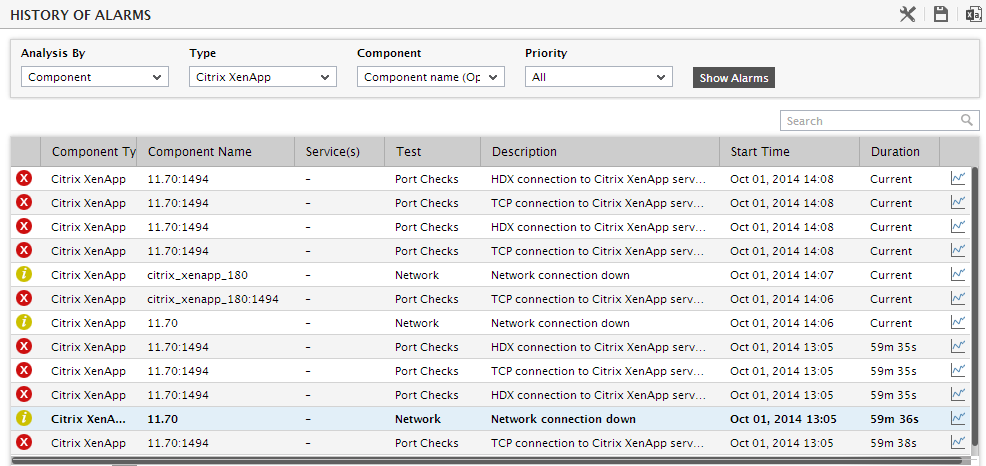
Figure 43 : Viewing the alarm history of a particular component
-
If you had chosen to view only those alarms that have remained unresolved over or within a specified Duration, then, clicking the Show Alarms button will result in an alarm history that displays only the alarms that fulfill the specified duration condition (see Figure 43).
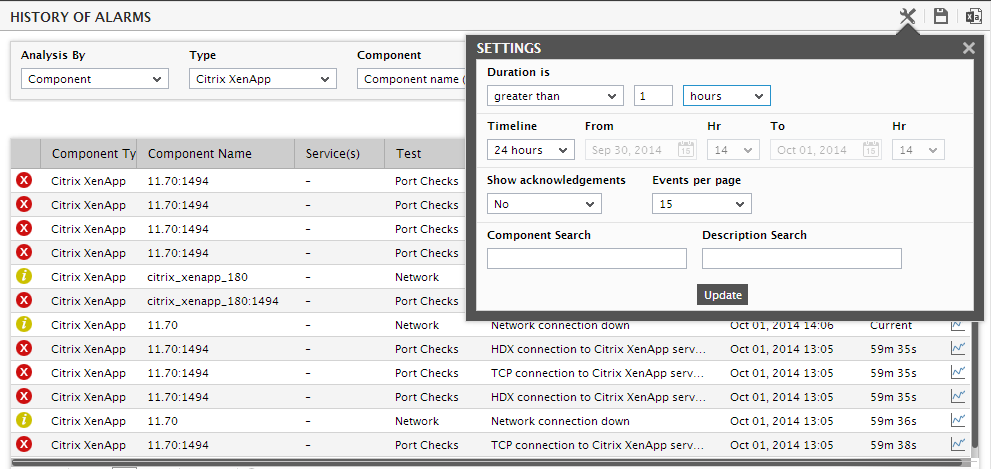
Figure 44 : History of alarms that have remained open for a duration greater than 1 hour
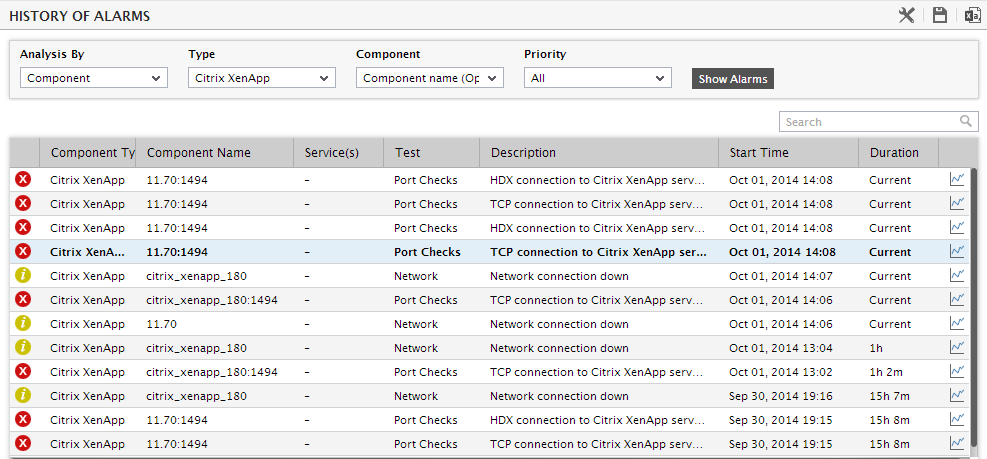
Figure 45 : The History of Alarms
-
Clicking on the Show Alarms button after specifying a Component search string will display the details of only those alarms that pertain to components with names that embed the specified search string (see Figure 44).
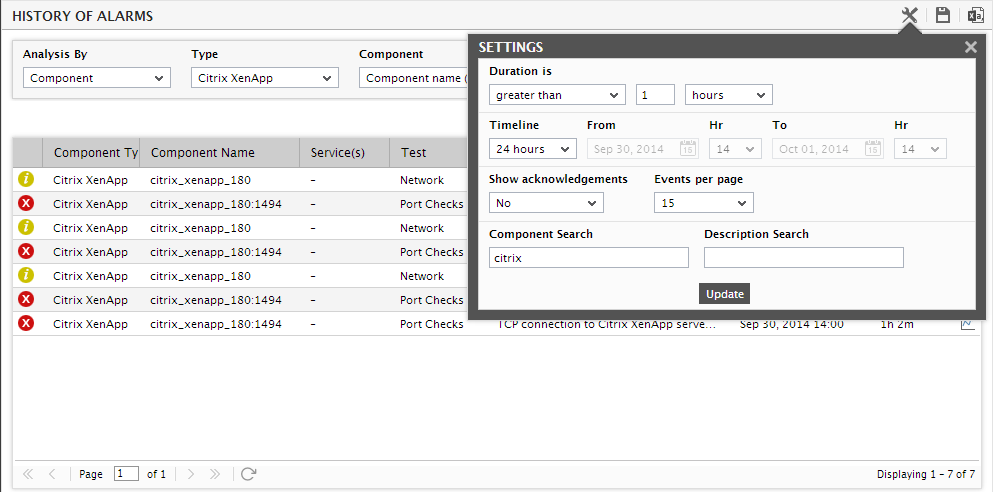
Figure 46 : Alarm history of components settings page
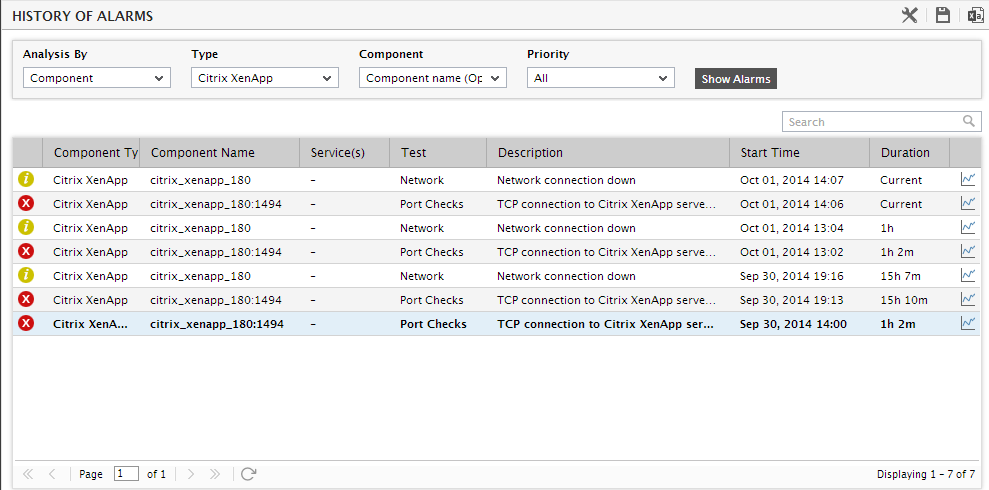
Figure 47 : The Alarms for a specific component
-
In the same way, if you click on the Show Alarms button after specifying a Description search string, then, only those alarms with descriptions carrying the specified search string will be displayed in the history of alarms page (see Figure 46).
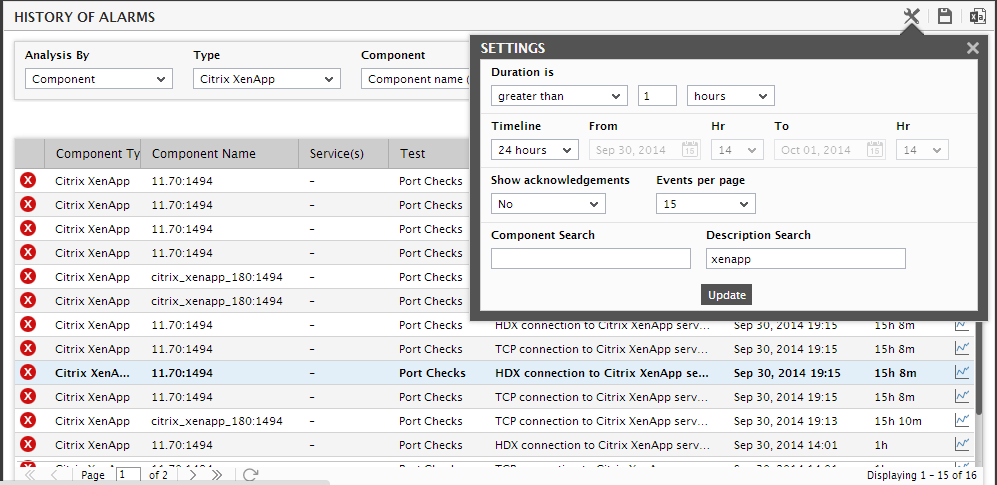
Figure 48 : Alarm history with alarm descriptions carrying a specified search string
-
If the Show Acknowledgements flag is set to Yes, then, upon clicking the Show Alarms button, the acknowledgement/deletion history of alarms will appear as depicted by Figure 49 below.
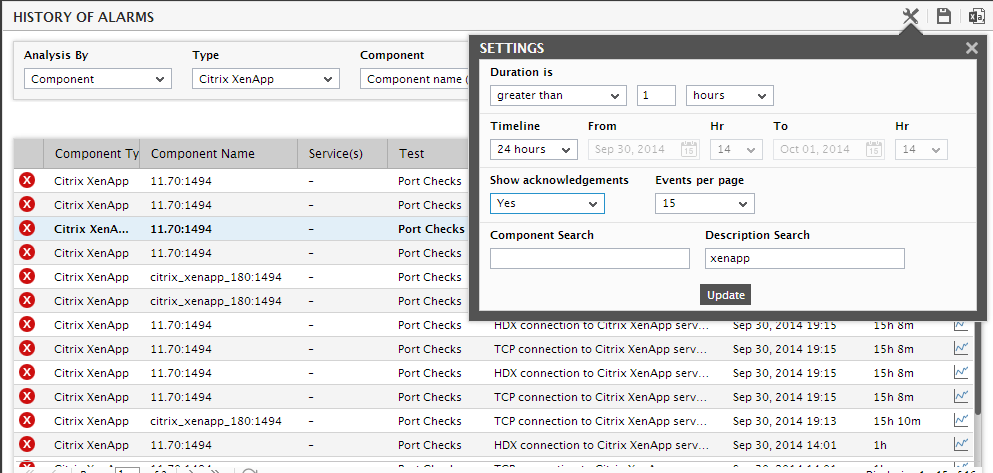
Figure 49 : Acknowledgment/deletion history displayed in the alarm history page
-
By default, the alarm history will not provide information on the users who are responsible for fixing the problems indicated by an alarm - i.e., the users who have been assigned the server/device on which an alarm has been raised. To ensure that every alarm displayed in the history of alarms page is accompanied by this useful user information, do the following:
- Edit the eg_ui.ini file in the <eg_install_dir>\manager\config directory.
- Set the Show_Users flag in the [alarm_history] section of the file to true.
- Save the file.
When this is done, the alarm history will include an additional User(s) column, where the names of users who are responsible for fixing the problems indicated by each alarm will be displayed. With this information, the alarm history page will not only enable help desk managers to instantly identify those problems that have remained unresolved for the longest time, but also pin point those help desk personnel who were unsuccessful / had taken a long time to resolve those problems - the efficiency of the help desk staff can thus be ascertained. Moreover, a User(s) list will also additionally appear, which will be set to All by default. If need be, you can pick a particular user name from this list and click the Show Alarms button. Doing so will invoke the history of alarms associated with the chosen user alone (see Figure 50).
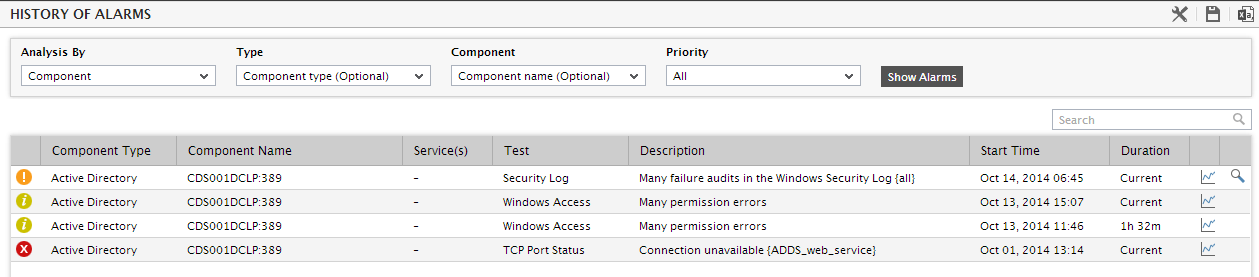
Figure 50 : Alarm History of a particular user
Note:
Only users with the privilege to monitor all managed components in the environment (eg., users with the Admin or Supermonitor role) can view user information in the HISTORY OF ALARMS page.
-
Sometimes, a single alarm raised by the eG manager could have undergone many transitions/changes during the specified Timeline. An alarm can change under any of the following circumstances:
- A change in the alarm priority: This could be a switch to a higher or lower priority.
- A change in the alarm description: For example, originally, a usage-related alarm may have been raised on disk 'D' of a server. Later, disk 'C' of the same server might have experienced a space crunch, causing another alarm to be raised.
- A change in the list of impacted services
-
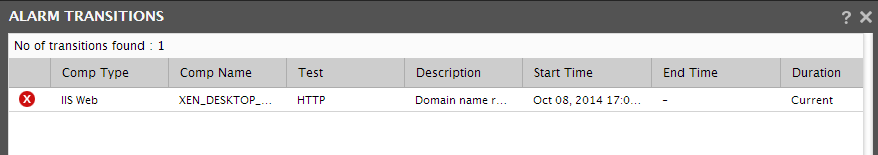
Using the history of alarms page, you can now even view the history of transitions experienced by a particular alarm. For this, just click on an alarm in the history of alarms page. If the alarm has not undergone any transitions, then the Alarm Transitions window that appears will once again display the details of the alarm that was clicked on. On the other hand, if the alarm had experienced one/more transitions during the given Timeline, then the Alarm transitions window will provide the details of each transition - such details include, the alarm priority at the time of the transition, the component name, test, and alarm description during the transition, when the transition began (start time), when it ended (end time), and the total duration of the transition (see Figure 51).
-
Using the details provided in the Alarm transitions window, you can understand how many transitions have occurred for an alarm in a specified time window, and what they are. To focus only on the state (critical/major/minor) changes that an alarm experienced, click on the left-arrow button to the right of the Alarm transitions window. Alternatively, you can click on any of the alarm transitions in this window. This will invoke a distribution pie chart that reveals the percentage of time during the total transition period the alarm has been in the critical, major, and minor states. This reveals how alarm priorities have changed during the entire transition period (see Figure 52).
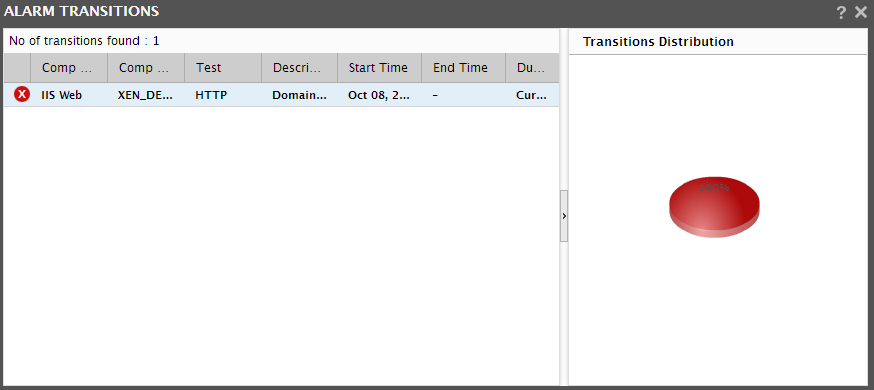
Figure 52 : Distribution of problems encountered during the transition period
-
The history of alarms page also comprises of a GRAPH icon, which when clicked, allows you to view the graph of the corresponding measure for the last one hour. If the detailed diagnosis capability has been enabled for the eG installation, then problem measures for which detailed diagnosis is available will be accompanied by the DIAGNOSIS icon. When this icon is clicked, the detailed diagnosis of the measure will appear, throwing greater light on the problem condition. By default, the graph and detailed diagnosis information will be displayed in the same window as the event history. If you want to view the graph and detailed diagnosis in a separate window, click on the check box preceding the
 symbol, and then click on the GRAPH or DIAGNOSIS icons.
- You can save the event history in the CSV format by clicking on the CSV button in this page. To save it as a PDF document, click on the PDF icon.
- The NEXT and PREVIOUS buttons, and the hyperlinked page numbers are provided to enable you to easily browse the alarm information that runs across pages.