The Monitor Home Page
Behind the alarms window is the monitor home page (see Figure 1). If no alarms exist in the environment, then this is the first page that will be displayed in the monitor interface.
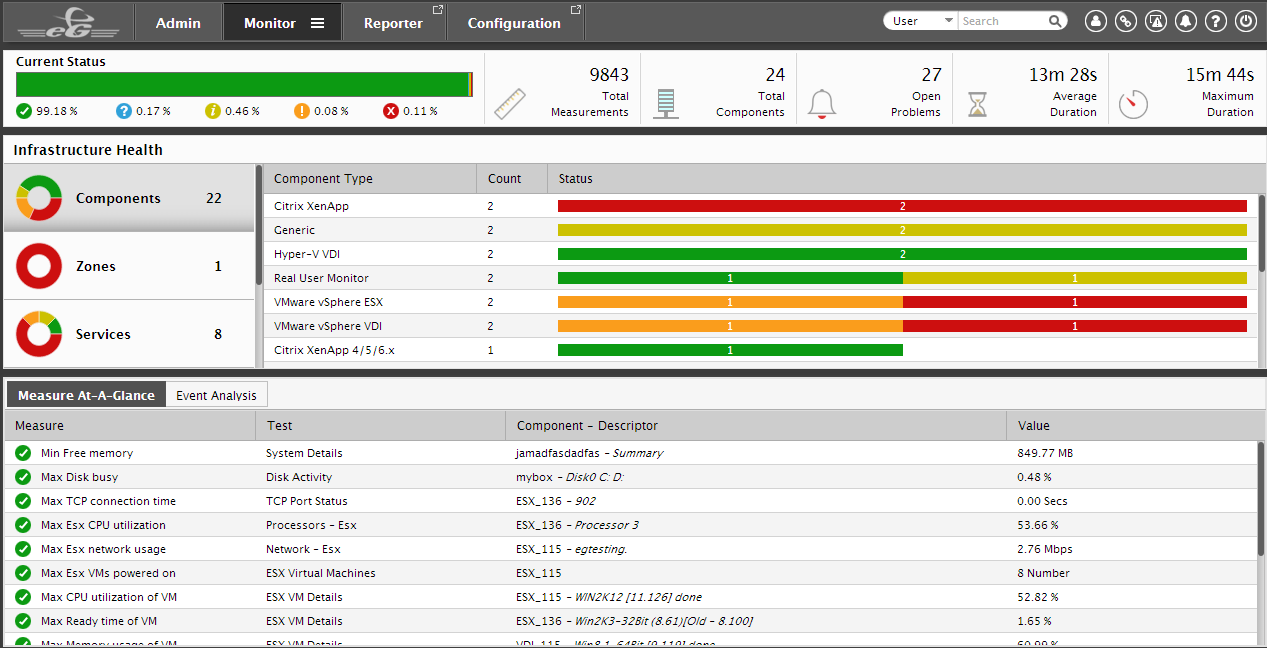
Figure 1 : The Monitor Home page
This page quickly updates a user with the health of his/her monitored environment. The page reveals the following information:
- The first section is the Current Status section that reveals at a glance, the status of the measurements reported to the eG manager. Besides displaying the total number of monitored components and the number of performance metrics collected by the eG agents from these components, this section also reveals the percentage of total measurements that are in the critical, major, minor, normal, and unknown states. Using this information, an accurate assessment of the overall infrastructure performance can be made. Clicking on any of the states will take you to the Current Alarms window, where you can view all open alarms of the corresponding priority.
- Below the Current Status section, is the section that reveals the Infrastructure Health. Since the health of an infrastructure depends entirely upon the performance of each of its key ingredients - namely, the Components, Zones, Services, Service Groups and Segments - this section takes the help of a bar graph to clearly indicate the number of zones, services, service groups, segments, and components that are in the Critical, Major, Minor, Normal, and/or Unknown states.
-
The table below explains the color-coding scheme adopted by eG for indicating the states of the services/segments/components:
Color State Red
Critical
Orange
Major
Yellow
Minor
Green
Normal
Blue
Unknown
If you click on a division in the Zones doughnut graph, you will be lead to a page that lists the zones which are in that particular state (see Figure 2).
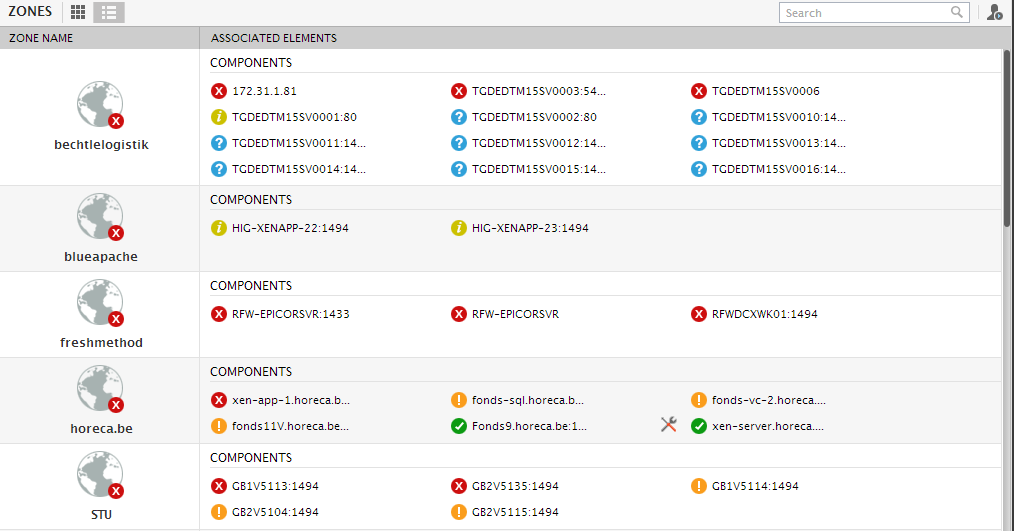
Figure 2 : The zones in a particular state
Against every zone in this page, the infrastructure elements (which could be subzones/segments/services/components within a zone) that are part of the zone, and the current state of each element will be listed (see Figure 2).
Note:
By default, against each zone displayed in the zone list page, the top-10 Components included in that zone will be displayed. Typically, to identify the top-10 components, eG Enterprise automatically sorts all the components included in the zone on the basis of their current state, arranges the sorted list in the alphabetical order of the component names, and picks the first 10 components of this list.
If you want more number of components to be displayed against each zone, do the following:
- Login to the eG administrative interface.
- Click on the
 icon available in the Admin tab. Then, select the Monitor option in the Settings tile.
 - Click the Other Settings sub-node under the General node in the tree-structure in the monitor settings page.
- In the right panel, modify the default value 10 that is displayed in the Components count in segment/service/zone list text box.
- Click the Update button to save the changes.
Clicking on the Zones link in the Infrastructure Health section reveals the complete list of configured zones and their state.
Note:
While listing the Components associated with a zone, if you want the component-types listed instead of the component names in Figure 6, then you will have to set the Display component types in segment/service list flag in the monitor settings page of the eG administrative interface, to Yes.
Clicking on an abnormal component in Figure 2 will lead you to a page that displays the layer model, tests, and measurements of the component. Clicking on a zone Figure 2, reveals a Zone Dashboard that summarizes the performance of all the zone elements. For more information on the zone dashboard, refer to Service Health of this manual.
Clicking on a division in the Service Groups doughnut graph will lead you to a page that lists the service groups, which are in that particular state.
Clicking on a division in the Services doughnut graph in the Infrastructure Health section will lead you to a page that lists the services, which are in that particular state (see Figure 3). By default, against every service in this page, the components engaged in the delivery of the service will be displayed along with their state.
Note:
By default, against each service displayed in the service list page, the top-10 Components associated with that service will be displayed. Typically, to identify the top-10 components, eG Enterprise automatically sorts all the service components on the basis of their current state, arranges the sorted list in the alphabetical order of the component names, and picks the first 10 components of this list.
If you want more number of components to be displayed against each service, do the following:
- Login to the eG administrative interface.
- Click on the icon available in the Admin tab. Then, select the Monitor option in theSettings tile.
- Click the Other Settings sub-node under the General node in the tree-structure in the monitor settings page.
- In the right panel, modify the default value 10 that is displayed in the Components count in segment/service/zone list text box.
- Click the Update button to save the changes.
Note:
By default, only the components associated with a service will be displayed in the service list page. If you want the segments associated with the service also to be displayed, then, do the following:
- Login to the eG administrative interface.
- Click on the icon available in theAdmin tab. Then, select the Monitor option in the Settings tile.
- Click the Other Settings sub-node under the General node in the tree-structure in the monitor settings page.
- In the right panel, set the Show segment(s) in service list flag to Yes.
- Click the Update button to save the changes.
To make sure that service list page does not display the list of components associated with a service, set the Show component(s) in service list flag in the other display settings panel of the monitor settings page to No.
If both the segment list and component list are disabled, then the SERVICE LIST page will only display a vertical list of services and their current state.
Clicking on the Services link in the Infrastructure Health section reveals the complete list of configured services and their state.
Note:
While listing the Components associated with a service, if you want the component-types listed instead of the component names in Figure 3, then you will have to set the Display component types in segment/service list flag in the monitor settings page of the eG administrative interface, to Yes.
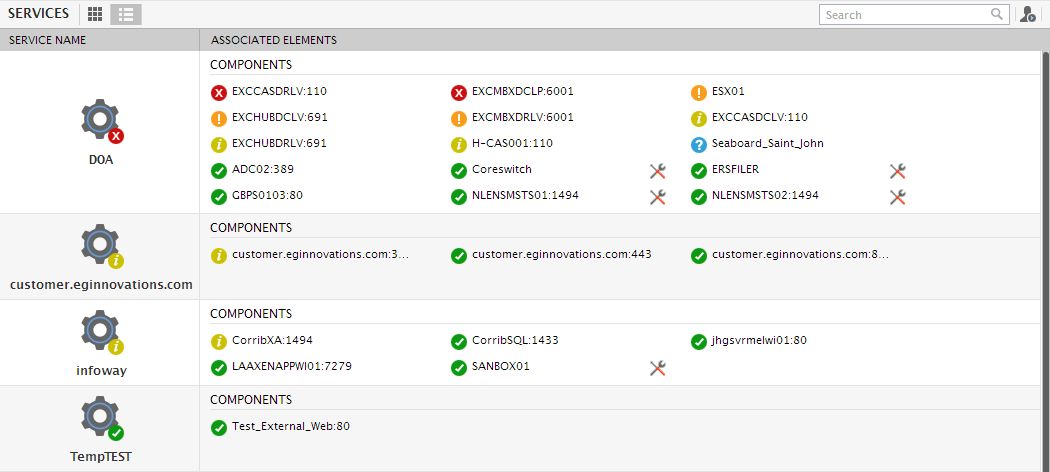
Figure 3 : Viewing the list of services in a particular state
Clicking on an abnormal component in Figure 3 will lead you to a page that displays the layer model, tests, and measurements of the component. Click on a service name in Figure 3 to view the topology of the service (in case of a non-web-site service) (see Figure 4) or the transactions configured for that service (in case of a web site service). However, if a problem service constitutes more than one problem segment, then clicking on the service name in Figure 3 will take you to a page that lists the problem segments, indicates the current state of each segment, and the problem components (if any) in every segment.
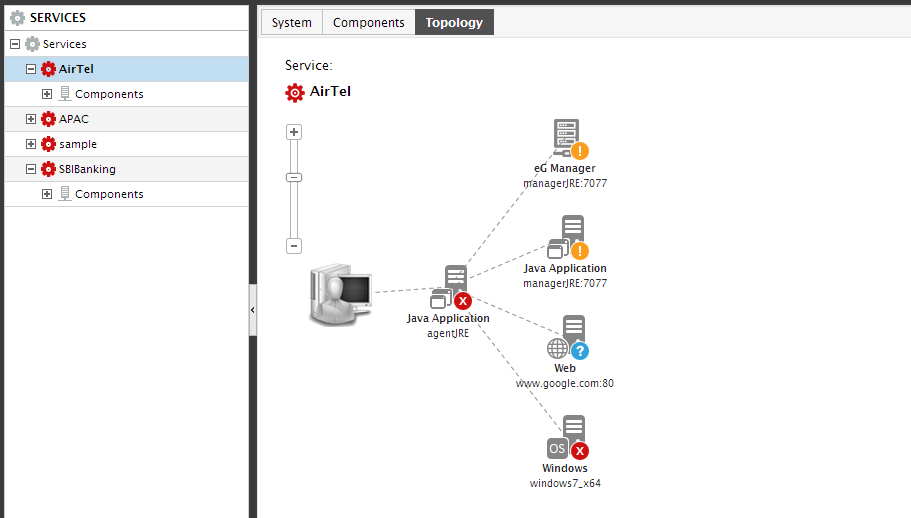
Figure 4 : The topology of the web site buy.abc.com
Next, to know how well every segment configured in the environment has fared, take a look at the Segments doughnut graph in the Infrastructure Health section. Clicking on a division in this graph will enable you to view the list of segments in a particular state (see Figure 4). Alongside each segment, the IP/hostname of the top-10 (by default) the segment components (i.e., components that are part of the segment) will be displayed along with their state.
Note:
By default, against each segment displayed in the segment list page, the top-10 Components included in that segment will be displayed. Typically, to identify the top-10 components, eG Enterprise automatically sorts all the components associated with that segment on the basis of their current state, arranges the sorted list in the alphabetical order of the component names, and picks the first 10 components of this list.
If you want more number of components to be displayed against each segment, do the following:
- Login to the eG administrative interface.
- Click on the icon available in the Admin tab. Then, select the Monitor option in the Settings tile.
- Click the Other Settings sub-node under the General node in the tree-structure in the monitor settings page.
- In the right panel, modify the default value 10 that is displayed in the Components count in segment/service/zone list text box.
- Click the Update button to save the changes.
Note:
While listing the Components associated with a segment, if you want the component-types listed instead of the component names, then you will have to set the Display component types in segment/service list flag in the monitor settings page of the eG administrative interface, to Yes.
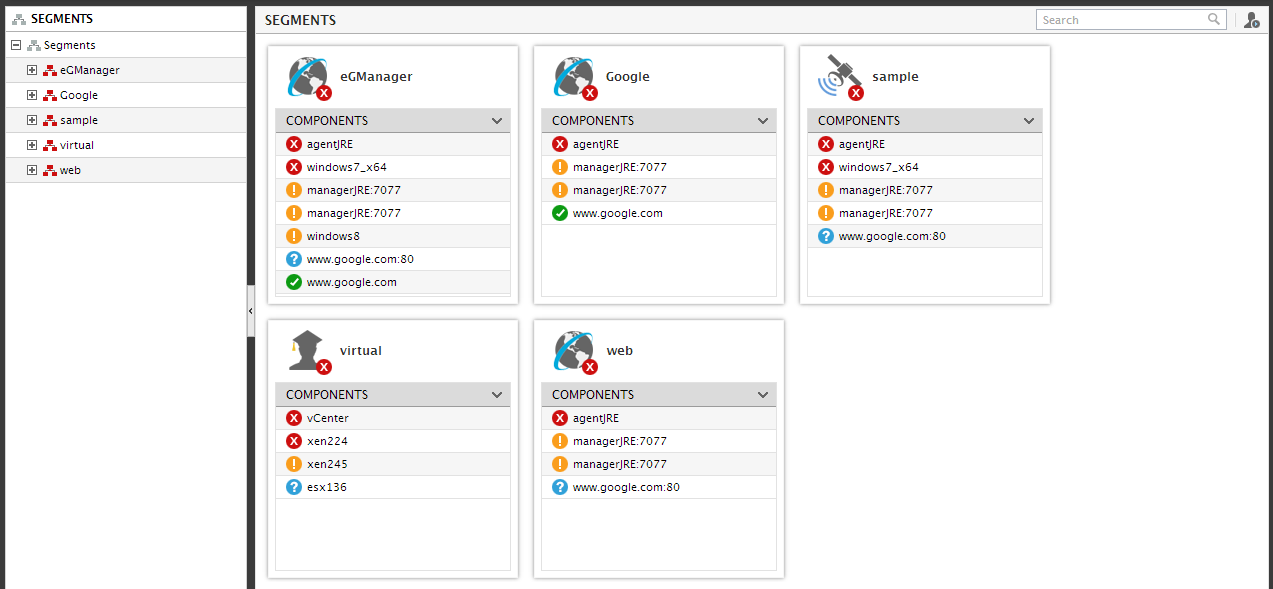
Figure 5 : The list of segments that are in a particular state
Click on a segment name in Figure 5 to view the topology of the segment. If you click on a component, then the layer model, tests, and measurements of that component will appear.
Clicking on the Segments link in the Infrastructure Health section reveals the complete list of configured segments and their state.
Finally, click on a division in the Components bar graph in Figure 1 for a quick update on components that are currently in a particular state.
Clicking on the Components link in the Infrastructure Health section reveals the complete list of configured components and their state.
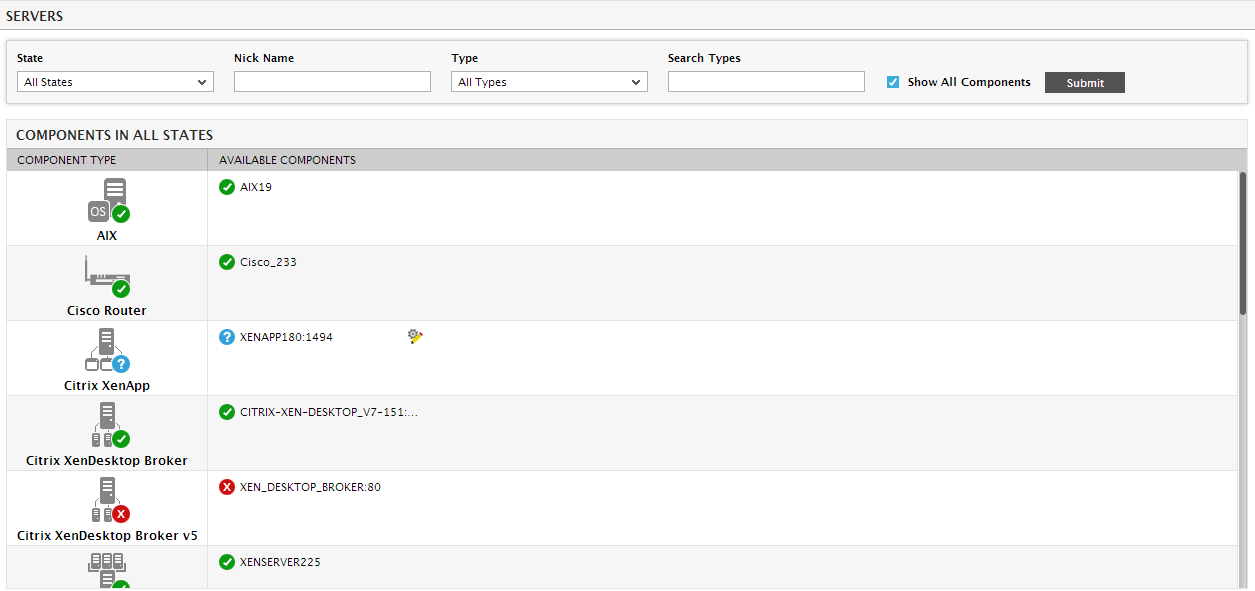
Figure 6 : The components that are in a particular state
For a closer look at the issues affecting a component's performance, click on the component listing in Figure 5. The page depicting the problem layers, tests, and measurements of the chosen component will then appear.
Note:
By default, components that are newly managed will be in the normal state. The state will change as the agent starts reporting measures to the eG manager. You can change this default setting to ensure that newly added components are initially in the unknown state, instead of normal. To achieve this, set the NewTestsUnknown parameter in the [misc_args] section of the eg_services.ini (in the <EG_INSTALL_DIR>\manager\config directory) to Yes (the default value is No).
Also, there will be a 30 second time lag between when a component is managed and when its state changes to normal.
-
Below the Infrastructure Health section you will find a Measures At-A-Glance section that provides the min/max values of critical measurements updated in real-time. By default, using this section, you can quickly find answers to the following critical performance queries:
- Which host across the environment is consuming the maximum CPU?
- Which host in the monitored infrastructure has very little free memory to its credit?
- Which disk partition on which host is utilized the maximum?
- Which is the Citrix server that supports the maximum number of active sessions?
- Across all monitored Citrix servers, which application is CPU-intensive and which Citrix server is it executing on?
- Which is the web server that services the maximum number of requests over time?
- Which network interface is using up a lot of bandwidth?
- On which host are TCP retransmits very high?
- Where in the target environment is network latency the maximum?
- TCP connections to which port are taking too long?
- Which host is currently not available over the network?
You can however, change this default setting to reveal more or less - i.e., you can add to the measure list displayed here, or remove a few measures from the displayed list. To achieve this, do the following:
- Login to the eG administrative interface as admin.
- Click on the icon available in the Admin tab. Then, select the Monitor option in the Settings tile.
- Click on the Measures At-A-Glance node in the Monitor Settings tree.
- The resulting measurEs at-a-glance configuration page will display the default measure configurations for the Measures At-A-Glance section. To know how to manipulate the controls in the page to add more measures or remove a few of the pre-configured measures section.
The min/max values of the configured measures will then be displayed in the Measures At-A-Glance section of the Monitor Home page. The first column of the Measures At-A-Glance section in Figure 6 indicates the current state of the measure (whether Normal/Critical/Major/Minor/Unknown). The Measure column is where the configured measures will be displayed. Similarly, each of the configured tests will appear in the Test column. Besides, a Server column exists, which displays the name of the component and the descriptor, which has currently registered the maximum/minimum value (as the case may be) for every chosen measure. For example, in Figure 8, the tomcat process executing on the Generic server named generic, is the process that is currently consuming a lot of memory. Finally, the current value of the measures for the displayed components will be displayed in the Value column.
Note:
The measures will be displayed in the order of the configuration.
Using the information provided by the Measures At-A-Glance section, administrators can receive instant status updates on sensitive performance parameters, and can also accurately determine, at a glance, the component on which the parameter is currently experiencing issues (if any), thereby simplifying problem identification.
Clicking on the contents of any cell in this section, will lead you to the layer model of the corresponding component.
Optionally, you can even switch off the Measures At-A-Glance section. To do so, you will have to set the Compute top metrics parameter in the measures at-a-glance configuration page of the eG administrative interface to No. By default, this parameter is set to yes indicating that, by default, the monitor home page will contain the maximum/minimum computations for measures (i.e., the Measures At-A-Glance section). When it is set to no, the Measures At-A-Glance tab is hidden from the home page, and the Event Analysis tab alone appears.
The Event Analysis tab page, when clicked, lists the top-5 layers that were most affected by performance issues. Figure 7 depicts a sample monitor home page with the Event Analysis section.
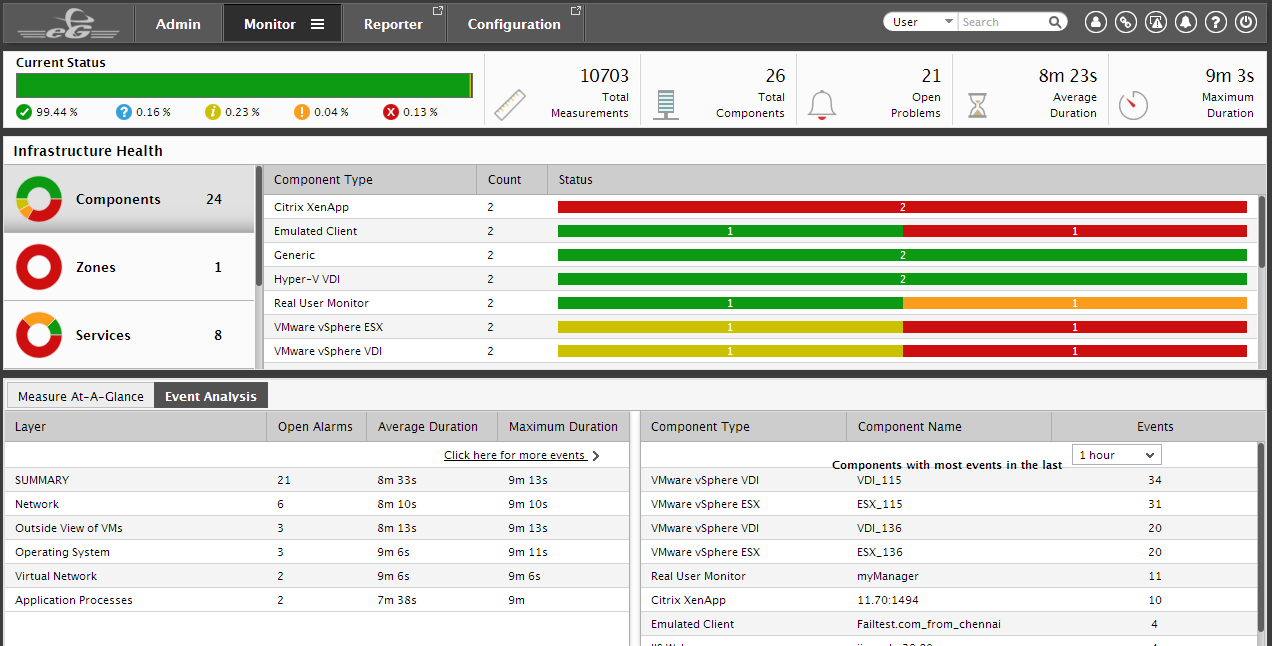
Figure 7 : A Monitor Home Page with the Event Analysis section
Corresponding to every layer name in the Event Analysis section, you will see the number of alarms that are currently open for that layer, the average duration of the open alarms, and the maximum duration for which an alarm had remained open (see Figure 7). To the right of the tab page, you will find a list of components that experienced the most number of performance issues during the last one hour (by default). Against every component listing, the corresponding component-type, and the number of events the component encountered during the default period of one hour, is displayed. This information brings to light the most problem-prone components in the environment. Clicking on a component/component-type in this list, reveals the layer model, tests, and the last set of measurements that the eG agent reported for that component. To analyze events across a broader time window in the past, select a different timeline from the Components with most events in the last list box here.
The details available in the Event Analysis section serve as an effective indicator of the efficiency of the administrative staff in resolving performance issues. To view the complete history of alarms in the environment, click on the Click here for more events >> link.
-
The Components At-A-Glance section comprises of a bar graph depicting the number of components of each type that are being monitored, and their respective states. Clicking on a bar will take you to a page that lists the individual components of the corresponding type and their current state (see Figure 8).
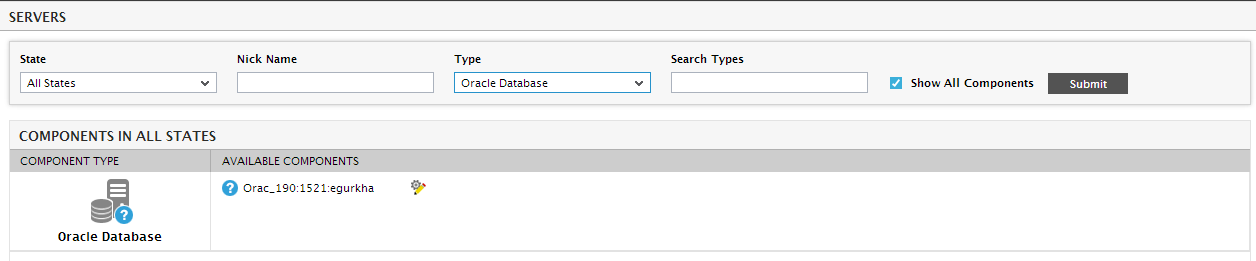
Figure 8 : Viewing the list of components of a particular type
By clicking on each Server type in the Components At-A-Glance section, you can view all components of that type and their current state. For instance, clicking on Generic in the Components At-A-Glance section of Figure 8, will reveal all managed components of type Generic and their current state.
Note:
By default, in the Components At-A-Glance section, the component-types are sorted in the descending order of the total number of monitored components of every type - in other words, in the descending order of the values in the Count column of the section. To change the sort order - i.e., to sort the component-types in the ascending order of the contents of the Count column - simply click on the down-arrow icon next to Count. To sort by a different column, say, the Server Type column, simply click on the corresponding column heading. This will instantly sort the contents in the alphabetical order of the names of the displayed server types. You can even override the default sort order, so that the component-types are by default arranged in the alphabetical order of their names, and not on the basis of the Count. To achieve this, Click on the
icon available in the Admin tab. Then, select the Monitor option in the Settings tile. In the OTHER DISPLAY SETTINGS section of the MONITOR SETTINGS page, set the Sort components in dashboards flag to By component types. This ensures that the contents of the Components At-a-Glance section are by default sorted in the ascending order of the component-types. Accordingly, the down-arrow icon, by default, appears next to the column heading, Server Type.The menu at the top of this page permits monitor users to view the status of the monitored elements such as zones, Services, Segments, and individual components (see Figure 8).
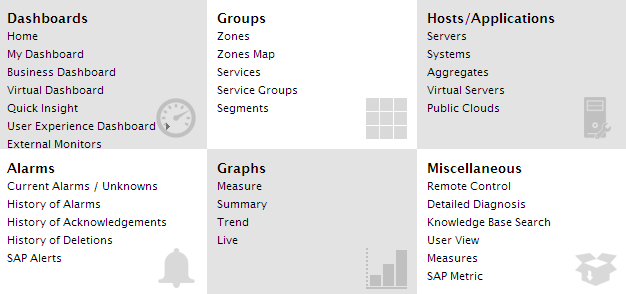
Figure 9 : The Monitor menu
In addition to this, the menu also facilitates the following:
- Switching to the monitor Home page from anywhere in the monitor interface
- Browsing for any measure across the environment and focusing on its current status
- The viewing of the current alarms, and the complete alarm history
- The generation of a wide variety of graphs including, measure, summary, and trend graphs
- The viewing of detailed diagnostic measures and the execution of remote control on agent hosts
Note:
The detailed diagnosis and remote control capabilities will be available only if the license permits them.
The menu at the right top corner of the page (see Figure 8) provides for the following:
- Signing out of the monitor interface
- Viewing and modifying the profile of the current monitor user
- Invoking a context-sensitive help topic