Getting Familiar with Monitor Interface
The eG agents monitor crucial components of an IT infrastructure such as web servers, SSL servers, web application servers, database servers, LDAP servers, DNS servers, payment gateways, WAP gateways, and connections to ISPs, partner sites, and back-end order fulfillment systems. By pseudo-periodically monitoring the entire infrastructure and by comparing the current status of each component with historical data, eG Enterprise detects problems in the IT infrastructure. Using a unique, patented top-to-bottom, end-to-end correlation approach, eG Enterprise can quickly identify and report the root cause of the problem. A graphical representation of the IT infrastructure topology enables a user to quickly drill down to the exact cause of a problem and perform detailed analysis. By enabling speedy diagnosis, eG Enterprise can enable IT infrastructure providers serve their customers better, with minimal downtime.
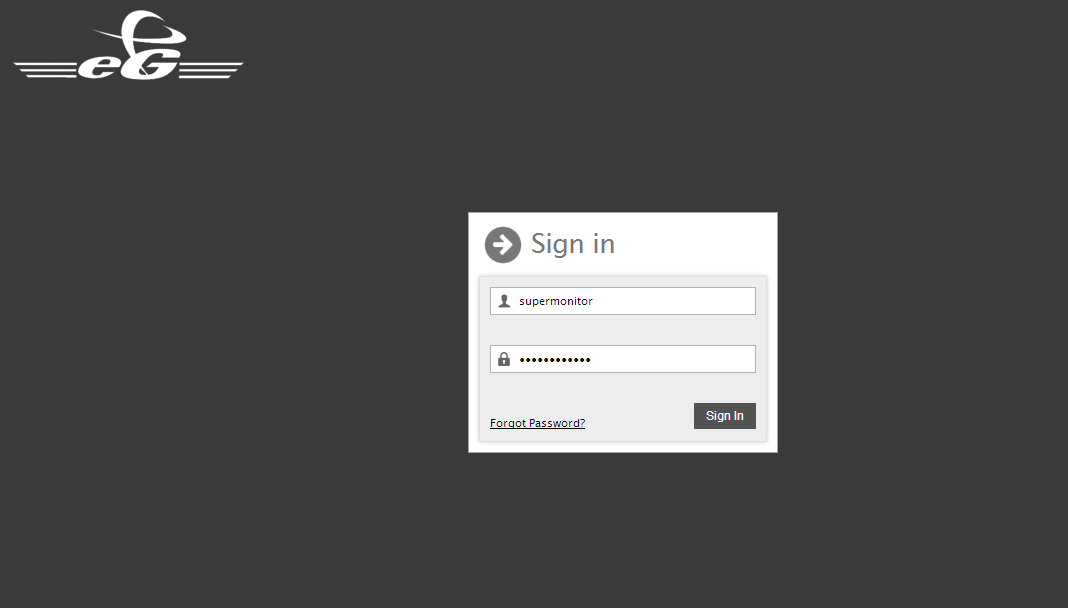
Figure 1 : Login to eG Enterprise as the supermonitor
This chapter is intended to enable a user to effectively monitor the target IT infrastructure using eG Enterprise. To start monitoring IT infrastructure, a user has to first login to eG Enterprise.
The eG Enterprise system is predefined with a default monitor user account with a login of supermonitor and password supermonitor. A user can also login using any other Username also, provided the role assigned to that user name allows him/her monitoring privileges. To know more about user roles and user profile creation in the eG Enterprise system.
If a user forgets his/her login Password, he/she can click on the Forgot Password link in Figure 1. Doing so invokes Figure 2 wherein the user would have to provide the Username for which the password details are required, and then click the Get password button to retrieve the password.
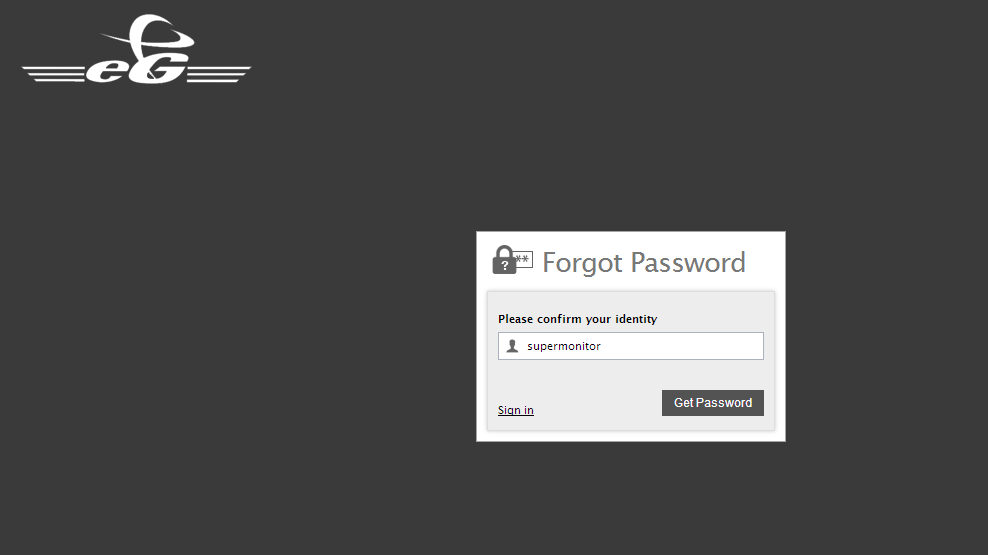
Figure 2 : Retrieving password
If the Username specified is valid, then the password will be emailed to the user with the given Username.
Note:
The eG manager will be able to send password details by mail to a user, only if:
- The Username specified in Figure 2 has been configured to receive email alerts, and a valid email ID has been assigned to the user; please refer to this manual to know how to configure a user profile to receive email alerts of issues.
- The mail server has been properly configured to handle eG alerts. In the mail/sms settings page of the eG administrative interface (see Figure 2) a valid mail host and eG Administrator maild ID should have been configured. Please refer to Section Figure 3 of this manual for more details with regard to the same.
If the user logging in is a domain user or is a user who belongs to an AD group registered with the eG Enterprise system, then the Username specified at login should be of the format: DomainName/Username, as depicted by Figure 3 below:
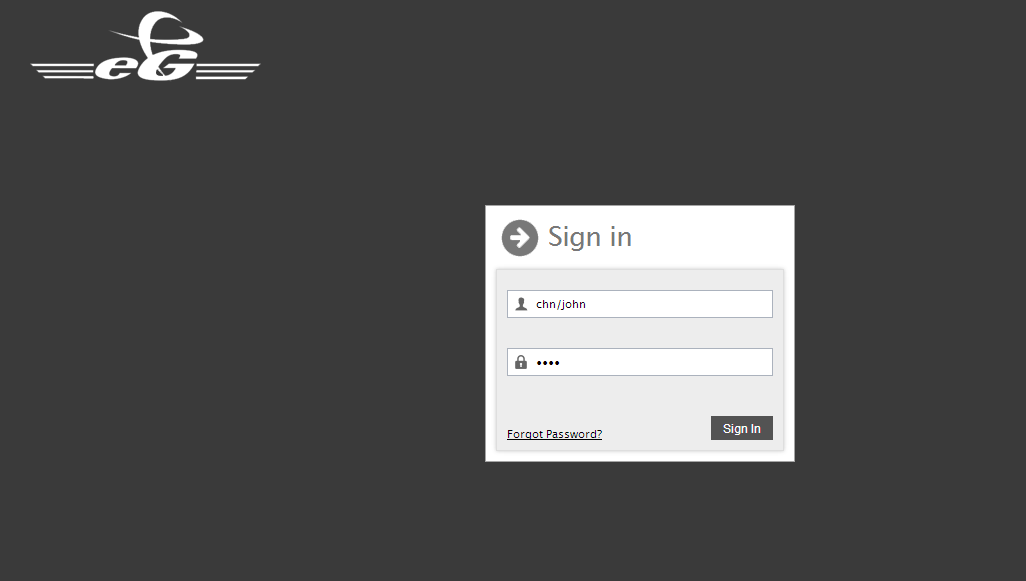
Figure 3 : A domain user logging in
If a domain user attempting to login to the eG monitoring console belongs to more than one AD group that is created in the eG Enterprise system, then, when the authenticate button is clicked, Figure 4 will appear listing the registered groups to which the user belongs.
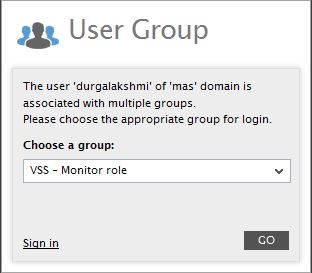
Figure 4 : Selecting the group to login as
Selecting a group from the Choose a group list in Figure 4 and clicking the go button soon after enables the user to automatically inherit the access rights and monitoring scope defined for that group.
Note:
Sometimes, users may not want to login via the login interface provided by eG Enterprise. For instance, if a user is already logged into a web portal, he/she may not want to login again to gain access to the eG user interface; instead, they may want to directly connect to the eG management console from the portal. To access the eG web-based interface without logging in, you can use the following URL:
http://<eGmanagerIP>:<eGmanagerport>/final/servlet/com.egurkha.EgLoginServlet?uname=<username>&upass=<password>&accessKey=eGm0n1t0r
If the eG manager you want to connect to is SSL-enabled, then, use the following URL:
https://<eGmanagerIP>:<eGmanagerport>/final/servlet/com.egurkha.EgLoginServlet?uname=<username>&upass=<password>&accessKey=eGm0n1t0r
Make sure that you configure the URL with the correct <eGmanagerIP> and <eGmanagerport>. Also, ensure that the name of a user with rights to access the eG management console is provided against uname. You can, if you so need, provide the password of the given user against upass, or can leave the password blank. If the URL is not configured with a password, the eG Enterprise system will automatically pick the password that corresponds to the specified uname from the database. However, note that the 'accessKey' provided in the URL should not be changed.
A sample URL (with a blank password) is provided below:
Users who are assigned the Admin role (for e.g., the default admin user) or the ServerAdmin role can access the monitor interface of eG Enterprise directly from the admin interface, without having to log out of the admin interface first. For this, the user will have to select the monitor tab present next to the admin tab in the eG user interface (see Figure 5).
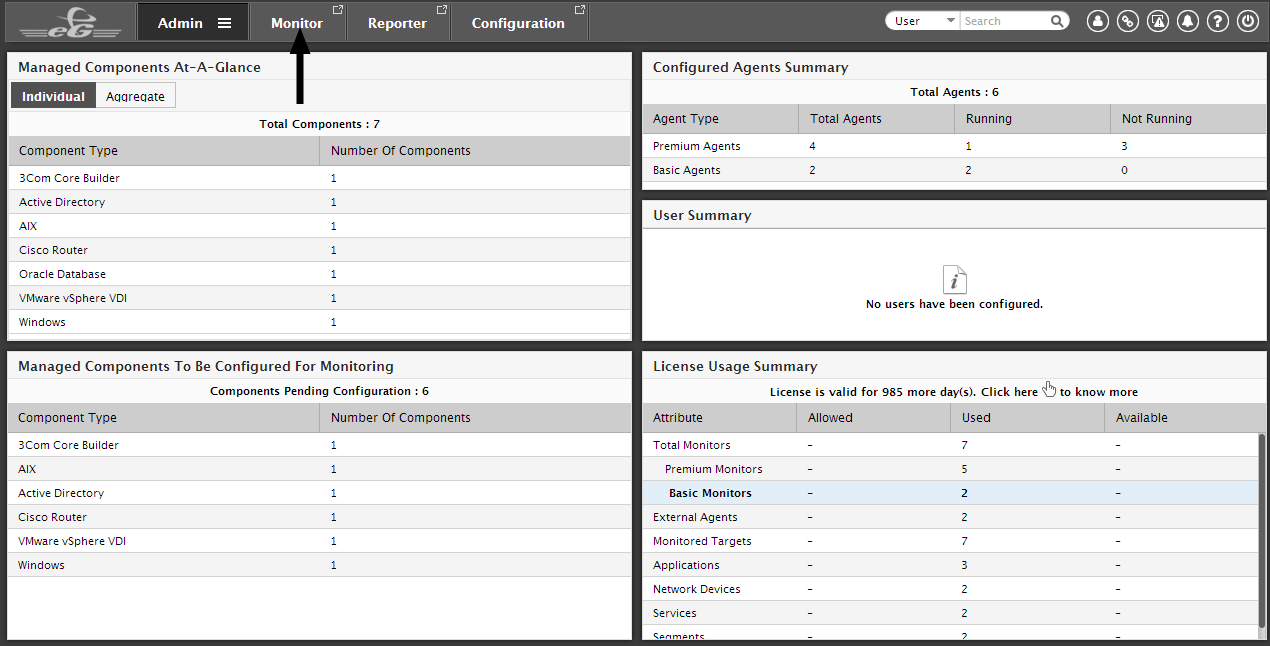
Figure 5 : Clicking on the MONITOR option to directly connect to the monitor interface
Users who are assigned any other role (Supermonitor, Monitor, AlarmViewer, or SuperAlarmViewer) will have to connect to the eG manager, and then explicitly login to the monitor interface of eG Enterprise.
To begin with, the monitor interface gets to view the current alarms window that displays the list of current alarms to the eG Enterprise system (see Figure 6), in the order of their priority.
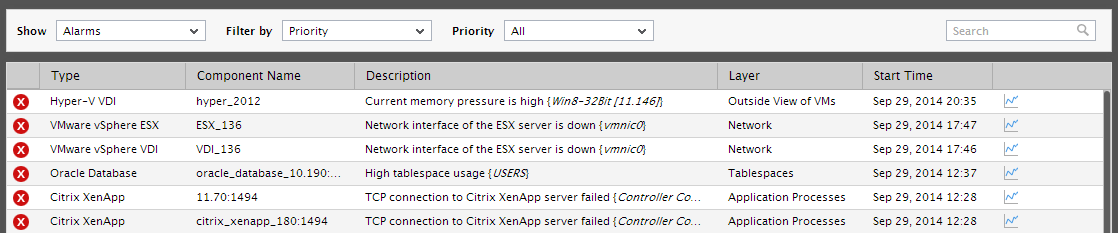
Figure 6 : The CURRENT ALARMS window displaying the current alarms
Note:
To know more about the current alarms, refer to the Alarms
Behind the alarms window is the monitor home page (see Figure 7). If no alarms exist in the environment, then this is the first page that will be displayed in the monitor interface.
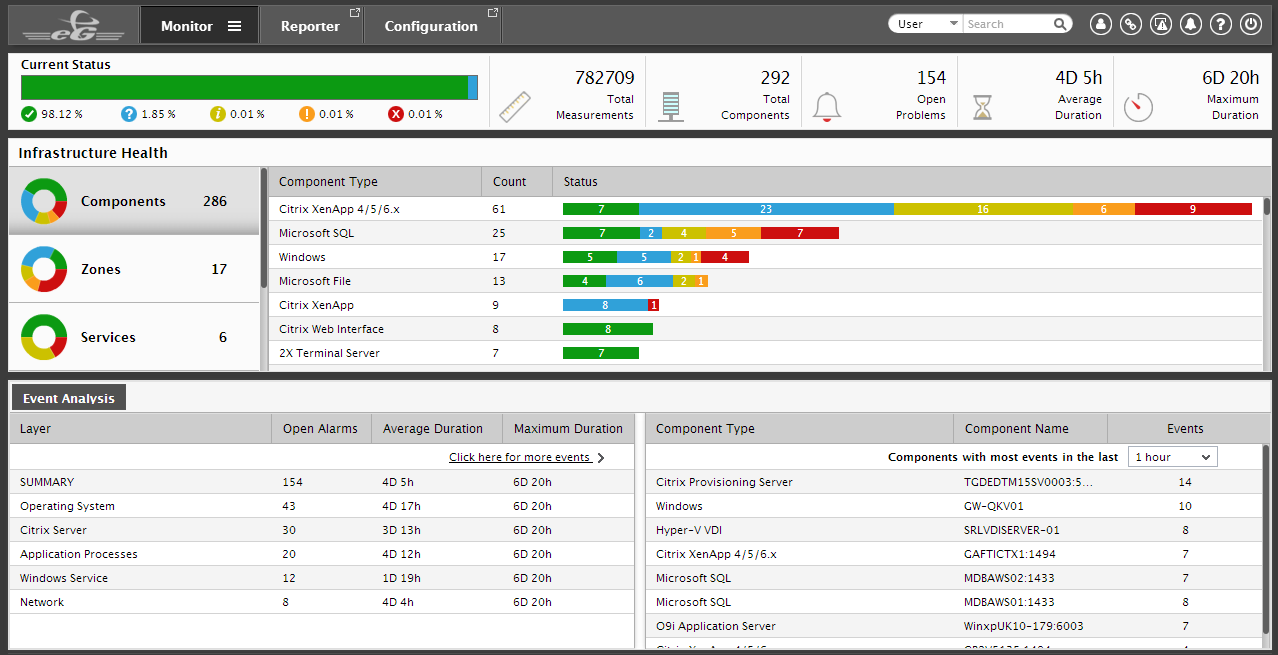
Figure 7 : The Monitor Home page
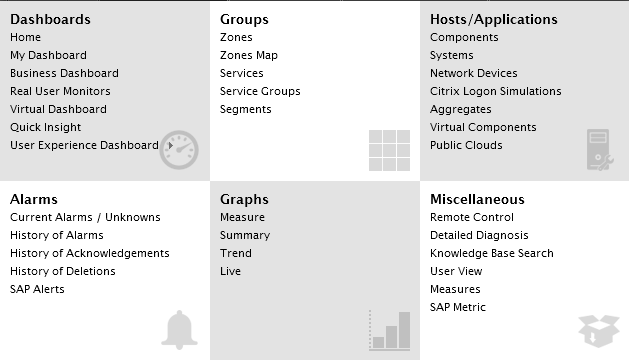
The menu at the top of this page permits monitor users to view the status of the monitored elements such as zones, Services, Segments, individual Components, etc.
Note:
The SAP Alerts option in the Alarms tile and the SAP Metric option in the Miscellaneous tile (see Figure 8) will appear only if SAP servers are monitored in the target environment. By default, these options will not appear in the respective tiles. For these options to appear, set the Enable_SAP_Menu flag in the [SAP] section of the eg_ui.ini file (in the <EG_INSTALL_DIR>\manager\config directory) to True.
Role of a SuperMonitor
As stated already, when a user logs in as the supermonitor, he/she is entitled to the privileges of the Supermonitor role. This means that a supermonitor receives an unrestricted view of the environment.
Note:
The supermonitor as well as other users will not be allowed to login to the eG interface if the instances corresponding to the managed Oracle database servers have not been properly configured by the administrator.