The Summary Tab Page
The Summary tab page serves as a single, central interface that combines ‘problem and performance information’ related to virtual infrastructures. Using this tab page, administrators can perform the following with ease:
- Oversee, by a mere glance, the composition of and the all-round performance of the virtual infrastructure as a whole or of the virtual infrastructure component chosen from the tree;
- View a consolidated list of current alarms pertaining to the node chosen from the tree, and instantly identify problem-prone virtual infrastructure elements;
- Receive real-time updates of the resource usage of physical servers and virtual machines, and instantly identify the hosts/guests experiencing a resource contention;
- Easily analyze and accurately detect disconcerting trends in the resource usage of the physical servers and virtual machines.
This section elaborately discusses the contents and usage of this tab page.
-
If the global Zones node is chosen from the tree, the Summary tab page in the right panel will, by default, provide a quick overview of the composition and performance of the monitored VMware vSphere ESX servers spread across all the managed zones in the environment (see Figure 1). To view the performance summary of a different virtualization platform, select a different option from the drop-down list in the right, top corner of the Summary tab page. By default, VMware vSphere ESX is chosen from this list.
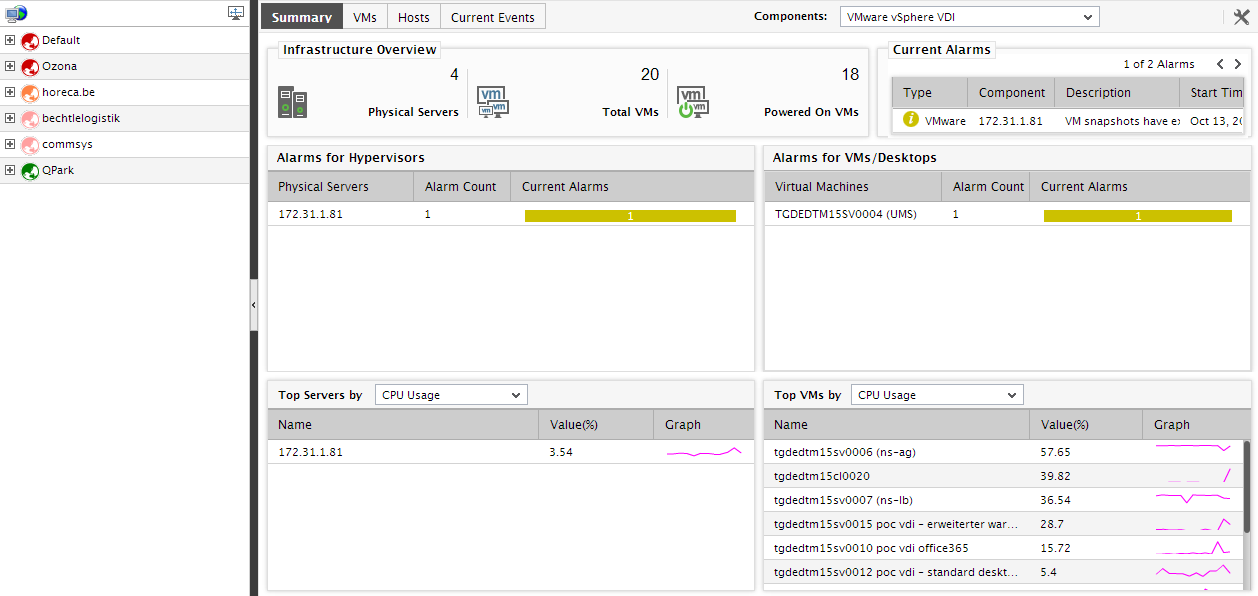
Figure 1 : The Summary tab page if the global Zones node is clicked
-
For the default VMware vSphere ESX infrastructure, this tab page provides an Infrastructure Overview section that briefly discusses the key ingredients of the virtual infrastructure - i.e., the number of managed physical servers in the target virtual environment, the total number of VMs on the physical servers, the number of VMs that are currently powered on, and the number of alarms currently open on the infrastructure elements. For more details about the target environment, simply move your mouse pointer over every value displayed in the Infrastructure Overview section. For instance, to know the names of physical servers that are being managed in the environment, simply move the mouse pointer over the value corresponding to Physical Servers in the Infrastructure Overview section. The Summary tab page will then change to display a pop-up that lists the names of the physical VMware vSphere ESX servers managed in the environment (see Figure 2). This way, you can view the names of virtual machines executing on the physical servers, the names of powered on VMs, and also the list of current alarms pertaining to the environment. Besides helping you identify VMs that are powered-off currently, the Infrastructure Overview also enables you determine the number and nature of the unresolved problems in the environment.
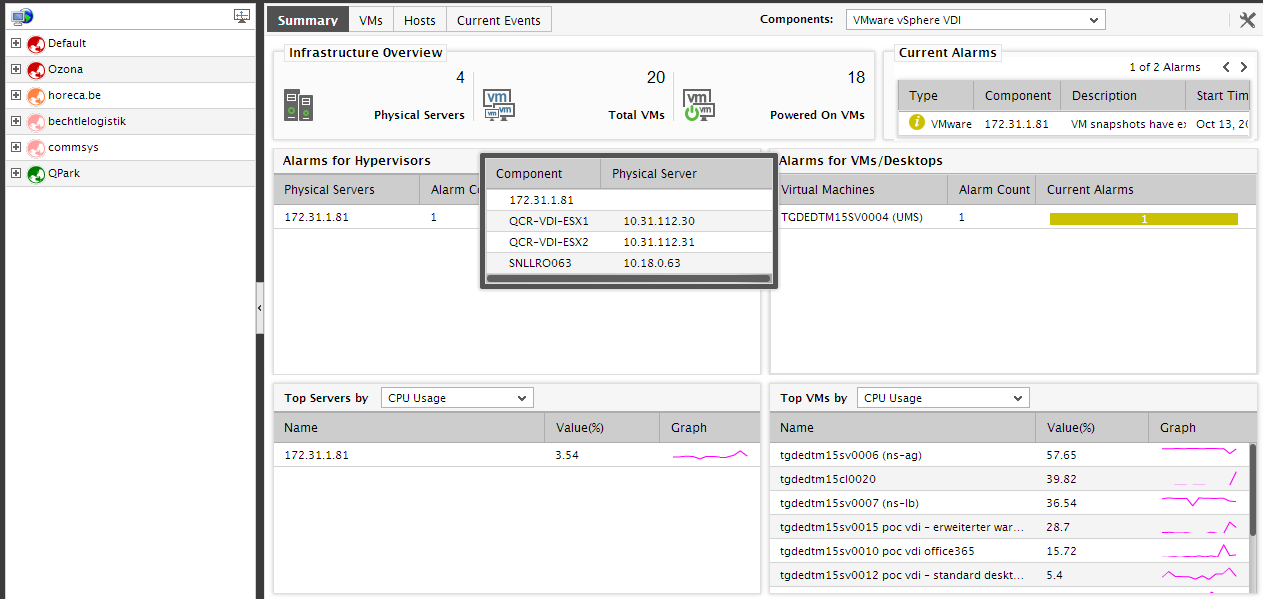
Figure 2 : The names of physical VDI servers displayed in a pop-up
-
Now that you know the names of the physical servers, you might want to analyze the current resource usage of each of these servers to ascertain whether they are experiencing any resource shortages or not. For that, click on the Physical Servers label in the Infrastructure Overview section of Figure 4. This leads you straight to the Hosts tab page of the global Zones node, which displays the physical servers, their current state, and also the resource usage metrics pertaining to each server (see Figure 4).
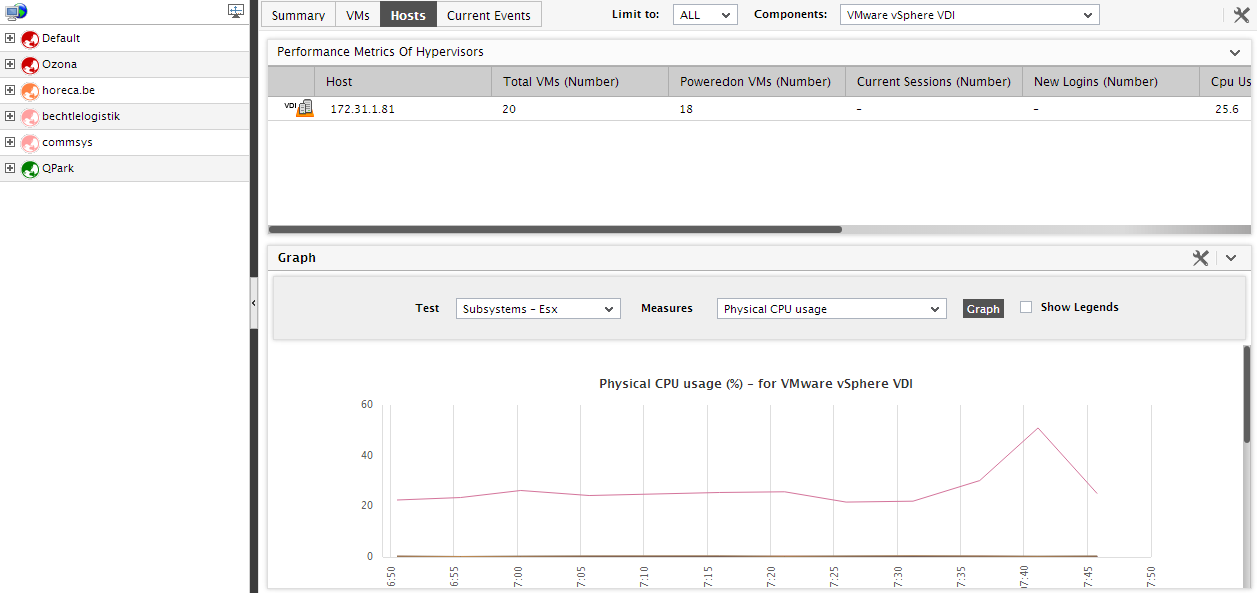
Figure 3 : The Hosts tab page appears when the ‘Physical servers’ label in the Summary tab page is clicked
-
Similarly, you can click on the Total VMs label in the Infrastructure Overview section of to switch to the VMs tab page of the Zones node, focus on the performance of the individual VMs, and identify the VM that could be consuming resources excessively (see ).
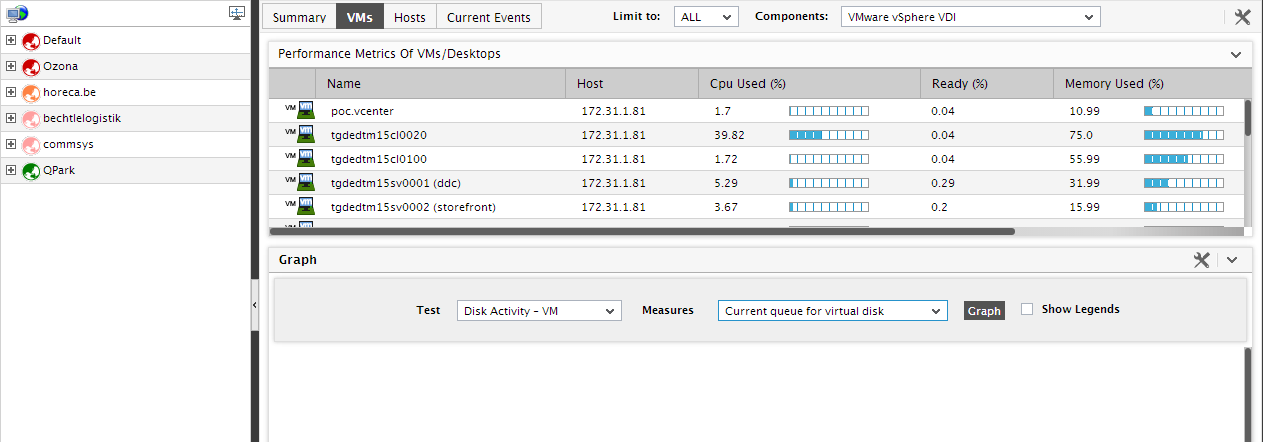
Figure 4 : The VMs tab page that appears when the ‘VMs’ label in the Summary tab page is clicked
-
While clicking on the Powered On VMs label in the Infrastructure Overview section takes you to the vms tab page and allows you to analyze the resource usage of powered-on VMs alone (see Figure 5), clicking on the Current Alarms label leads you straight to the Current Events tab page, where you can view the complete list of problems the target virtualized environment (see Figure 6) is currently experiencing.
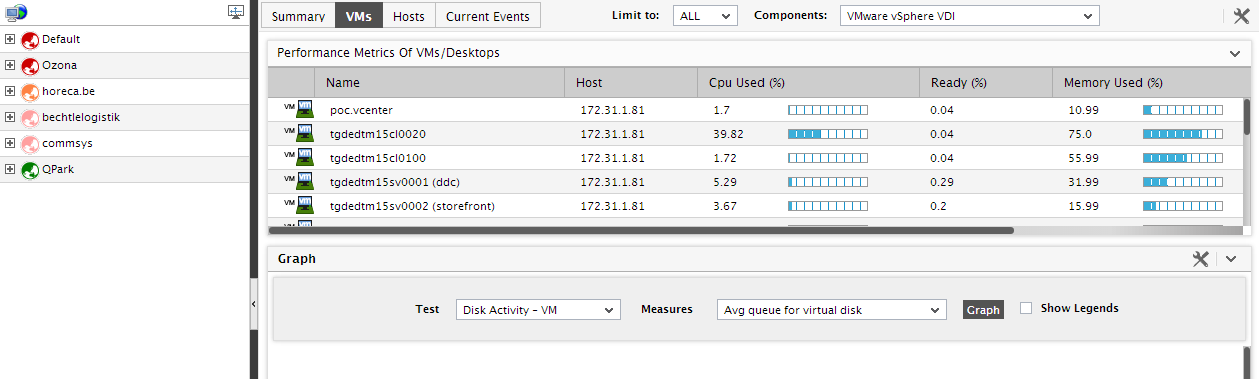
Figure 5 : The VMs tab page listing only powered-on VMs

Figure 6 : The Current Events tab page listing all the current problems related to the virtualized infrastructure
- If you want to focus on each problem closely, then, you can use the Current Alarms section adjacent to the Infrastructure Overview section in the Summary tab page. Use the arrow buttons (<< and >>) above an alarm to navigate to the next alarm. Move your mouse pointer over an alarm to know which test has reported the problem.
-
The Physical Servers section below the Infrastructure Overview section enables you to determine how problem-prone the physical servers in your environment are, by revealing the number of critical, major, and minor issues that are currently unresolved for each physical server. By moving your mouse pointer over an alarm priority corresponding to a physical server, you can view the details of current alarms of that priority (see Figure 6).
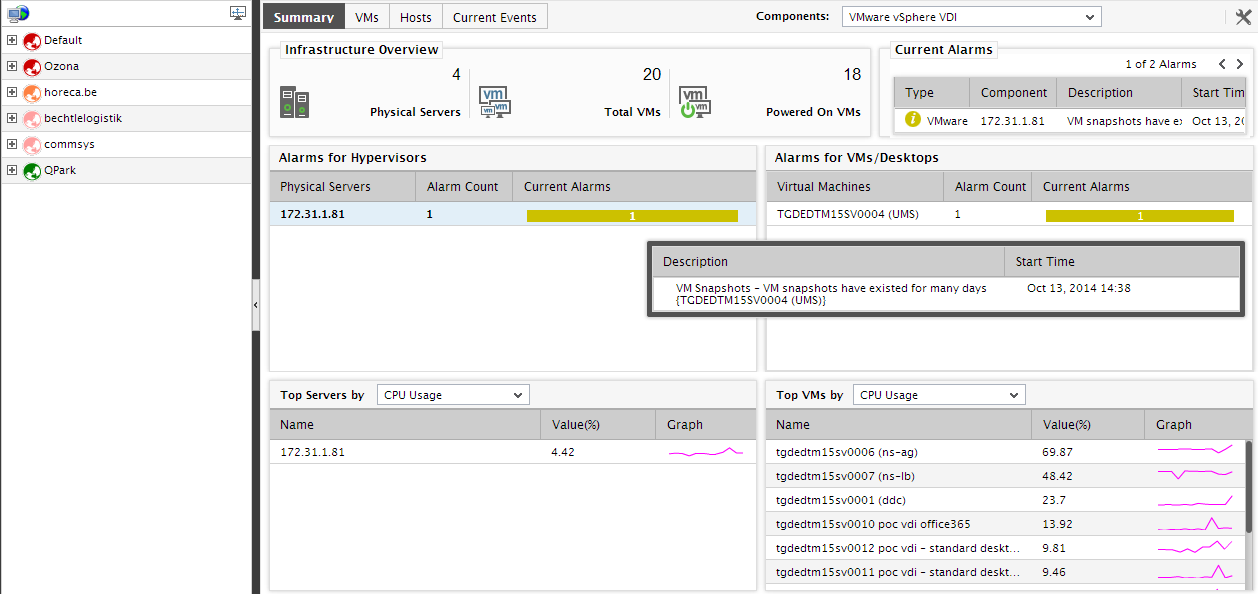
Figure 7 : Moving the mouse pointer over an alarm priority that corresponds to a physical server
-
By clicking on a physical server in the Alarms for Hypervisor section, you can zoom into the layer model of that server; this will indicate all the layers that have been affected by problems. From the color-coding of the layers, you can easily infer from which layer the problem originated (see Figure 7). Click on that layer to view the problem tests, and then, click on a problem test to view the measures that have reported anomalies (see Figure 7).
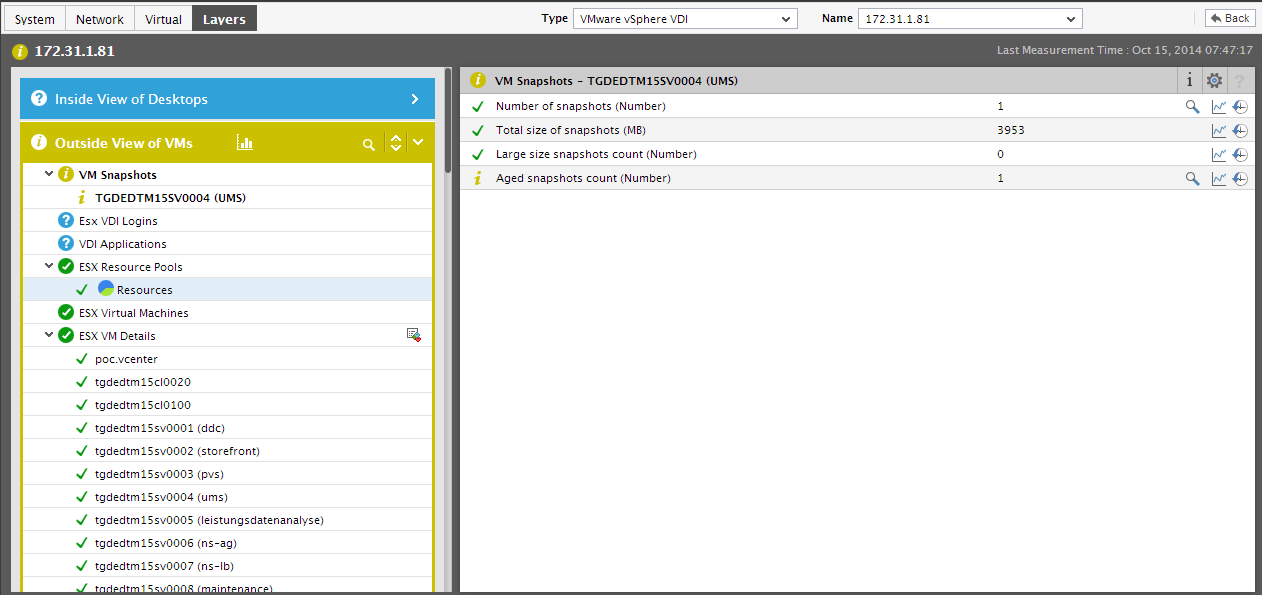
Figure 8 : The layer model of a physical server indicating the layer where the root-cause of a problem lies
-
The Alarms for Hypervisor section enables you to determine how problem-prone the virtual machines in your environment are, by revealing the number of critical, major, and minor issues that currently remain unresolved for each virtual machine. By moving your mouse pointer over an alarm priority corresponding to a virtual machine, you can view the details of current alarms of that priority (see Figure 8).
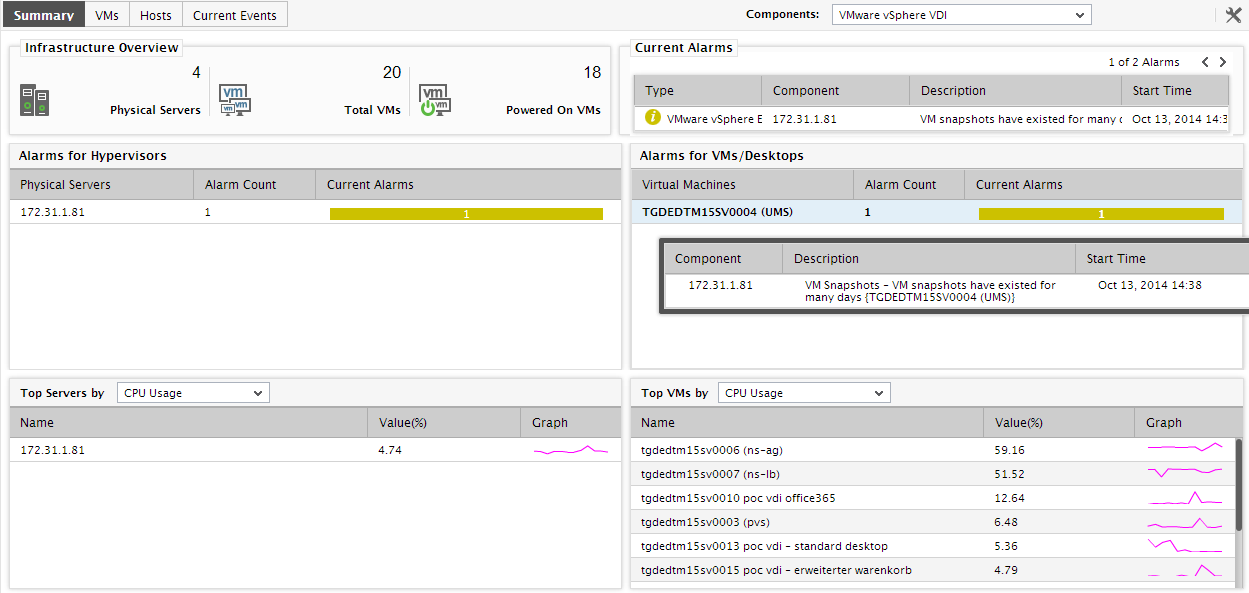
Figure 9 : The alarms of a particular priority corresponding to a virtual machine
-
To know the exact layer where the problem occurred and the test that reported the problem, click on any virtual machine in the Virtual Machines section. Figure 10 will then appear indicating the same.
Figure 10 : The layer model of the physical server on which the chosen VM executes, revealing the exact layer and test that reported the problem clicked on
-
In large virtualized environments comprising of a multitude of virtual hosts that are configured with tens of VMs, it is often difficult for administrators to instantly and accurately locate resource-intensive physical servers and/or virtual machines. Similarly, identifying the physical servers with too many VMs is also a herculean task. In order to ease the pain of the administrators, the Summary tab page provides two sections - one each for physical servers and VMs - which can be configured to list the top physical servers and VMs (respectively) in the environment, in terms of resource consumption. Also, by default, both sections will reveal the top consumers of physical CPU resources, starting with the leading consumer. Accordingly, the Physical CPU utilization measure is the default selection in both the Top Servers by and the Top VMs by lists. To view the top consumers of another resource, select a different measure from these lists.
In the Top Servers by list, in addition to the Physical CPU utilization measure, the following measures are available for selection by default: Used physical memory, Used space, Registered guests, and VM power-on state. If need be, you can override this default setting, so that new measures can be added to the list and one/more existing measures can be removed from the list. To do this, follow the steps given below:
- Click on the
 button at the right, top corner of the Summary tab page.
 -
Figure 9 then appears. To add a new measure to the Top Servers by list in the Summary tab page, first select the Add option from the Add/Delete measures section, and then pick the Summary option from the Add/Delete measures in section in Figure 9.
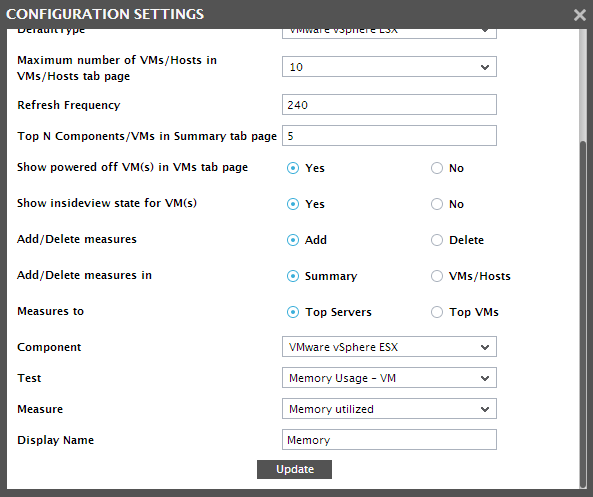
- Next, set the Measures to flag to Top Servers.
- Then, pick the Component to which the new measure pertains.
- Select the Test that reports the measure of interest.
- Select the Measure to be added, and provide a Display Name for the measure.
- To add the measure, click the Update button. Doing so ensures that the Display Name specified in Figure 10 appears as an option in the Top Servers by list in the Summary tab page.
- Similarly, you can remove a measure from the Top Servers by list. For this purpose, set the Add/Delete flag to Delete, select the Component to which the measure to be deleted pertains, select the Test reporting the measure, select the Measure to be deleted, and finally, click the Update button.
In the Top VMs by list on the other hand, in addition to the Physical CPU utilization measure, the following measures are available for selection by default: Memory usage, Disk capacity, and Percent disk usage. If need be, you can override this default setting, so that new measures can be added to the list and one/more existing measures can be removed from the list. To do this, follow the steps given below:
- Click on the
button at the right, top corner of the Summary tab page.
-
Figure 11 then appears. To add a new measure to the Top VMs by list in the Summary tab page, first select the Add option from the Add/Delete measures section, and then pick the Summary option from the Add/Delete measures in section in Figure 12.
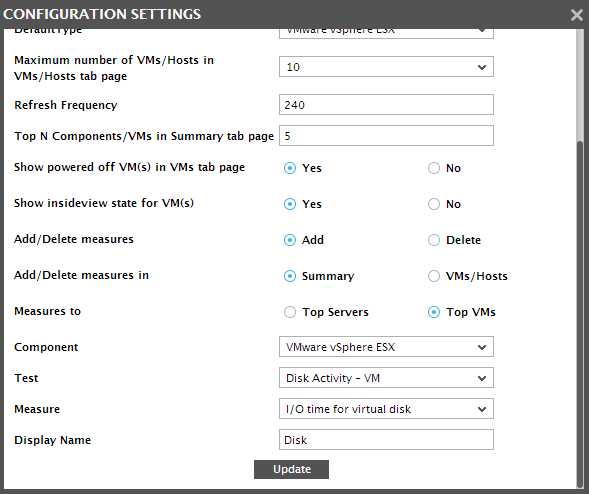
- Next, set the Measures to flag to Top VMs.
- Then, pick the Component to which the new measure pertains.
- Select the Test that reports the measure of interest.
- Select the Measure to be added, and provide a Display Name for the measure.
- To add the measure, click the Update button. Doing so ensures that the Display Name specified in Figure 12 appears as an option in the Top VMs by list in the Summary tab page.
- Similarly, you can remove a measure from the Top VMs by list. For this purpose, set the Add/Delete flag to Delete, select the Component to which the measure to be deleted pertains, select the Test reporting the measure, select the Measure to be deleted, and finally, click the Update button.
- Click on the
-
Also, by default, both lists will display the top-5 resource consumers only. This default setting can be overridden by following the steps given below:
- Click on the
button at the right, top corner of the Summary tab page.
-
Figure 13 then appears. By default, the value 5 is displayed in the Top N Component/VM in Summary tab page text box, indicating that the Summary tab page displays the top-5 resource consumers, by default.
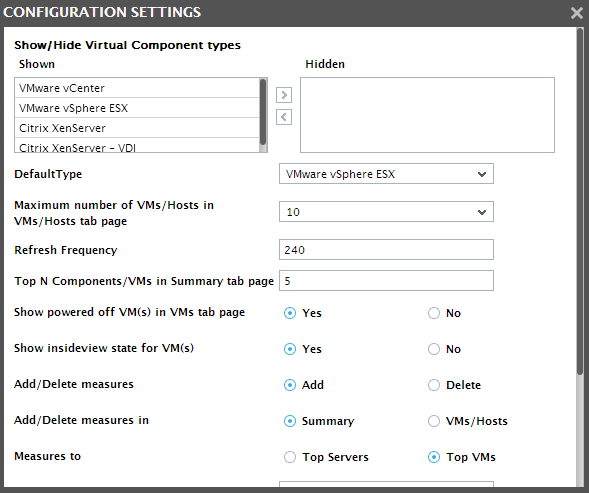
- Override this default setting by specifying a different number in the Top N Component/VM in Summary tab page text box.
- Then, click the Update button in Figure 14.
- Click on the
-
Let us now focus on the Top Servers by section alone. Against every physical server displayed in the Top Servers by section, the percentage of the chosen resource currently utilized by each physical server will be displayed, followed by a miniature graph tracking the usage of that resource over a period of time. If you click on a physical server in this section - say, the server that is the leading consumer of physical CPU resources - Figure 13 will appear revealing the layer model of that server. From the layer model, you can navigate to the test and the measure reporting the physical CPU usage of the server, perform further analysis, and accurately identify which processor supported by the server has contributed to the excessive resource usage.
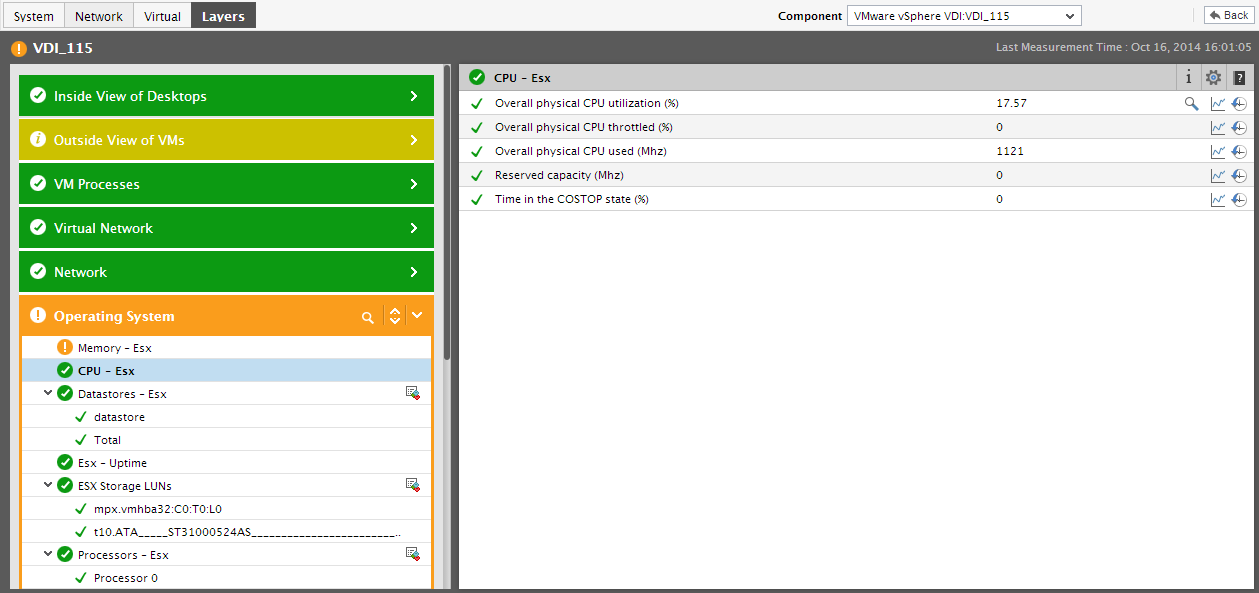
Figure 14 : The layer model of a CPU-intensive physical server revealing the processor that is excessively consuming physical CPU
-
If you click on the miniature graph that corresponds to a physical server, the graph will expand as depicted by Figure 14. By default, the expanded graph tracks the variations in the measure selected from the Top Servers by list, during the last 1 hour. With the help of this graph, you can effortlessly observe how the physical server has been using the chosen resource over the last 1 hour by default. You can change this default period by choosing a different Timeline for the graph. This analysis will enable you to effectively study usage trends, and accurately detect the exact time at which the physical server began experiencing spikes in resource usage.
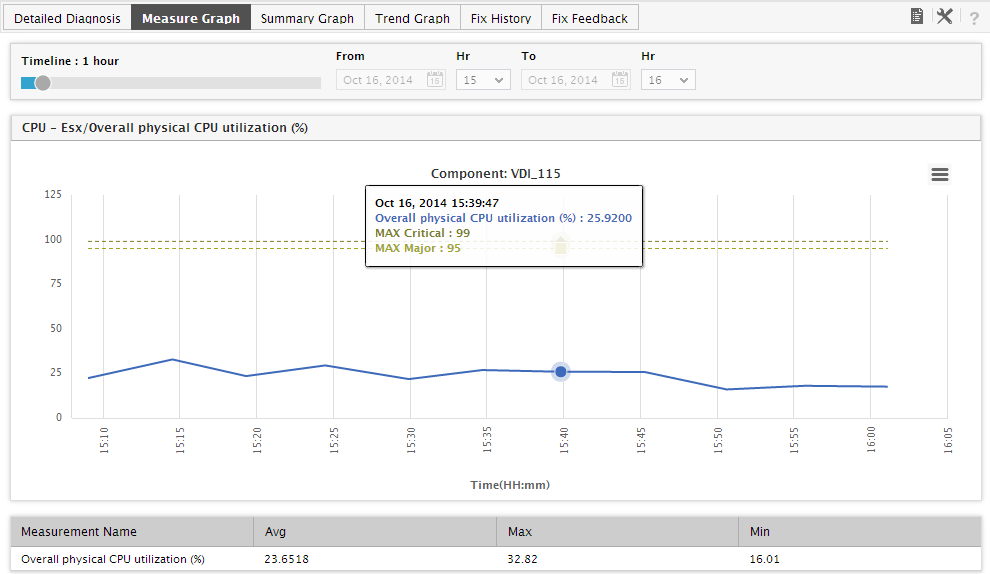
Figure 15 : The expanded resource usage graph of a physical server
-
Let us now shift our focus to the Top VMs by section in the Summary tab page. Against every virtual machine displayed in the Top VMs by section, the percentage of the chosen resource currently utilized by each VM will be displayed, followed by a miniature graph tracking the usage of that resource over a period of time. If you click on a VM in this section - say, the VM that is the leading consumer of physical CPU resources - Figure 16 will appear revealing the layer model of the physical server on which the VM is executing. By default, the test that reports the physical CPU usage of the VM in question will be selected in the layer model, and all the measures reported by that test for the chosen VM will also be displayed. Using these metrics, you can effectively assess the overall resource usage of that VM.
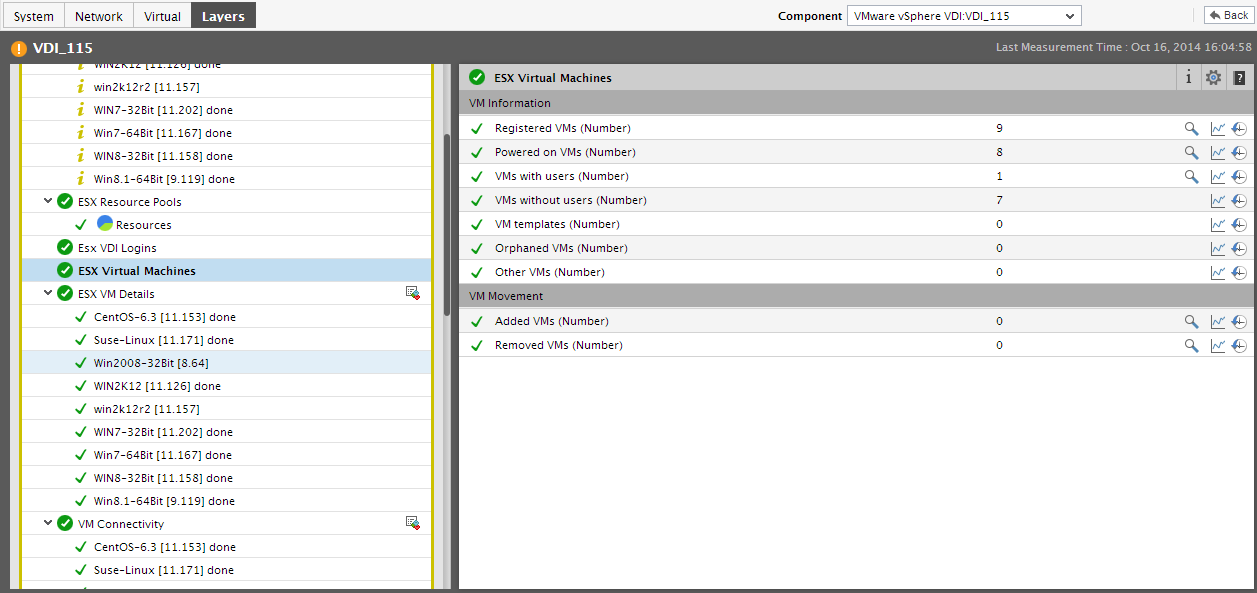
Figure 16 : The layer model of a CPU-intensive VM revealing the resource usage of the VM
-
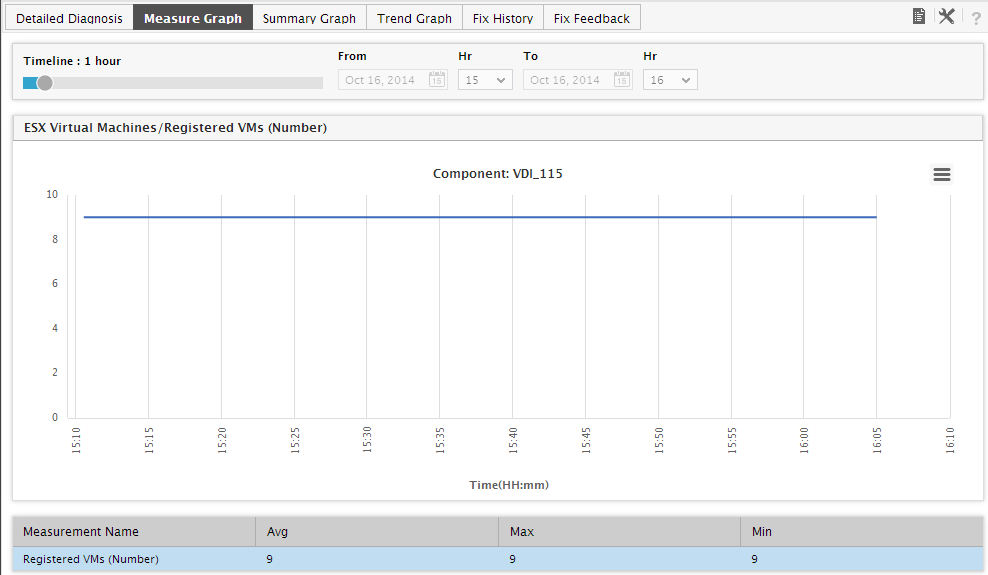
If you click on the miniature graph that corresponds to a VM in the Top VMs by section, the graph will expand as depicted by Figure 15. By default, the expanded graph tracks the variations in the measure selected from the Top VMs by list, during the last 1 hour. With the help of this graph, you can effortlessly observe how the VM has been using the chosen resource over the last 1 hour by default. You can change this default period by choosing a different Timeline for the graph. This analysis will enable you to effectively study usage trends, and accurately detect the exact time at which the VM began exhibiting unhealthy resource usage trends.
-
If the node representing a particular zone is chosen from the tree-structure in the left panel, the contents of the Summary tab page will change accordingly. Besides revealing the number of physical servers, VMs, and powered-on VMs in the chosen zone, the Infrastructure Overview section also presents a macro view of the health of the zone by indicating the number of unresolved problems in the zone. The Current Alarms section will enable you to view these unresolved problems one after another. To know which physical servers in the zone are responsible for these problems, you can take the help of the Physical Servers section, which lists the names of the servers along with the number and severity (critical/major/minor) of problems (if any) each server is associated with. Similarly, the Virtual Machines section, in addition to displaying the names of VMs that are executing on the physical servers included in the zone, also reveals the problematic VMs by indicating the number and severity of problems (if any) that each VM is currently experiencing. Besides the above, the Summary tab page for a particular zone will also enable you accurately identify the resource-intensive physical servers and VMs in a zone. The Top Servers by section of this tab page displays the top-5 (by default) resource-hungry physical servers; this enables you to quickly identify the server in the zone that is most resource-intensive. The Top VMs by section displays the top-5 (by default) resource-hungry VMs, and thus enables you to identify the most resource-intensive VM in the zone.
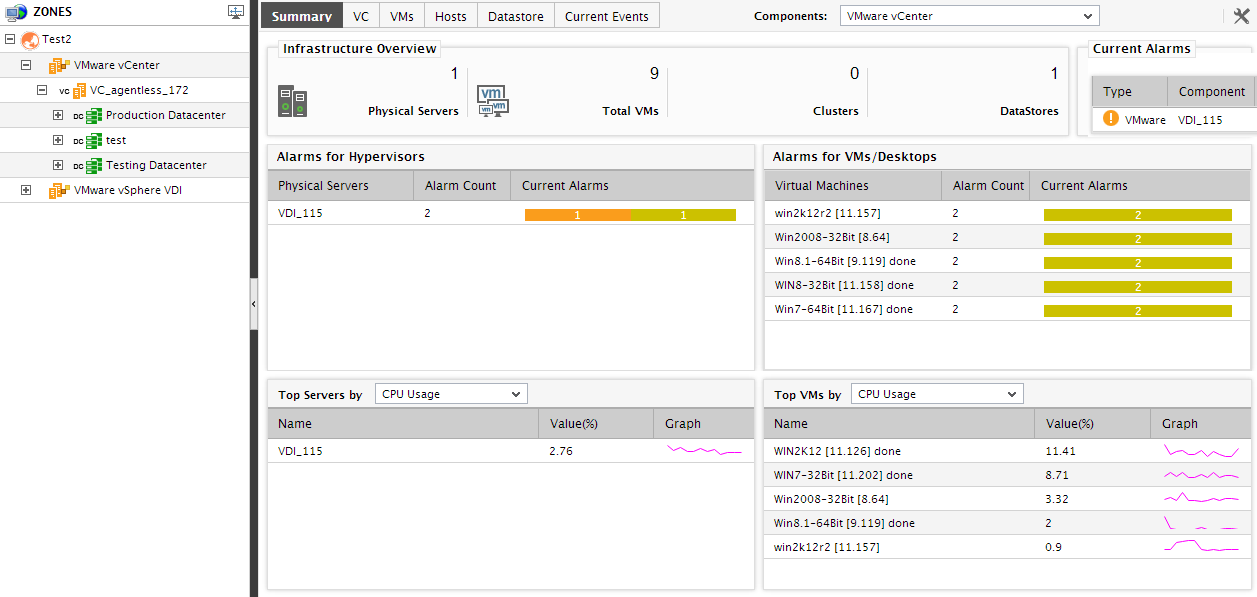
Figure 18 : The Summary tab page if a particular zone is chosen from the tree-structure in the left panel
- If a particular virtual server-type (eg., VMware vSphere ESX, Citrix XenServer, etc.) under a zone is chosen from the tree-structure, then the contents of the Summary tab page will change as depicted by Figure 16.
-
The Infrastructure Overview section in this case will provide a quick performance summary of only those servers in the zone that are of the type chosen from the tree-structure. In other words, if the VMware vSphere ESX node is chosen from the tree-structure, then the Infrastructure Overview section will display the number of ESX servers in the zone, the number of VMs and powered-on VMs executing on the ESX servers, and the current alarms related to these ESX servers. You can move your mouse pointer over any number displayed in this section, to view the corresponding details.
To pay individual attention to each alarm, view them one after another in the Current Alarms section. You would now want to know which ESX servers in the zone are the most problematic, and also determine whether any of the VMs on ESX servers have contributed to these problems. For this purpose, you can use the Physical Servers and Virtual Machines sections, which list the problem virtual hosts and guests in the zone, and also indicate the number and type of problems currently encountered by each of the displayed hosts and guests. By moving your mouse pointer over an alarm priority corresponding to a physical server/VM, you can take a quick look at the alarms of that priority that are currently open on that physical server/VM.
Also, you can receive real-time updates on the resource utilization levels of these hosts and guests from the Top Servers by and Top VMs by sections; these sections, by default, display the top-5 physical servers and VMs in terms of Physical CPU utilization. To view the toppers in a different performance realm, you can select a different measure from the list box available in both the sections. You can even add a new measure to the list or remove one/more of the existing measures using the procedure discussed in page In the Top Servers by list, in addition to the Physical CPU utilization measure, the following measures are available for selection by default: Used physical memory, Used space, Registered guests, and VM power-on state. If need be, you can override this default setting, so that new measures can be added to the list and one/more existing measures can be removed from the list. To do this, follow the steps given below: and page In the Top VMs by list on the other hand, in addition to the Physical CPU utilization measure, the following measures are available for selection by default: Memory usage, Disk capacity, and Percent disk usage. If need be, you can override this default setting, so that new measures can be added to the list and one/more existing measures can be removed from the list. To do this, follow the steps given below: of this document. Similarly, to view more number of physical servers and VMs in this section, you can change the default value 5 to a different number using the procedure discussed in page Also, by default, both lists will display the top-5 resource consumers only. This default setting can be overridden by following the steps given below: of this document. Using the information provided by these sections, you can determine the current resource usage of each displayed physical server and VM, and view graphs that can enable you to effectively assess the resource usage trends of these components over a broader period of time. Moreover, resource-intensive hosts and guests can be rapidly identified, sporadic/consistent surges in resource utilization by these hosts and guests can be promptly detected, and any potential resource contention can be diagnosed before its too late, and averted.
-
If a zone consists of a VMware vCenter server, then the node that corresponds to this zone in the tree-structure, when expanded, will also reveal a VMware vCenter sub-node. If this sub-node is clicked, the contents of the Summary tab page in the right panel will change as depicted by Figure 17.
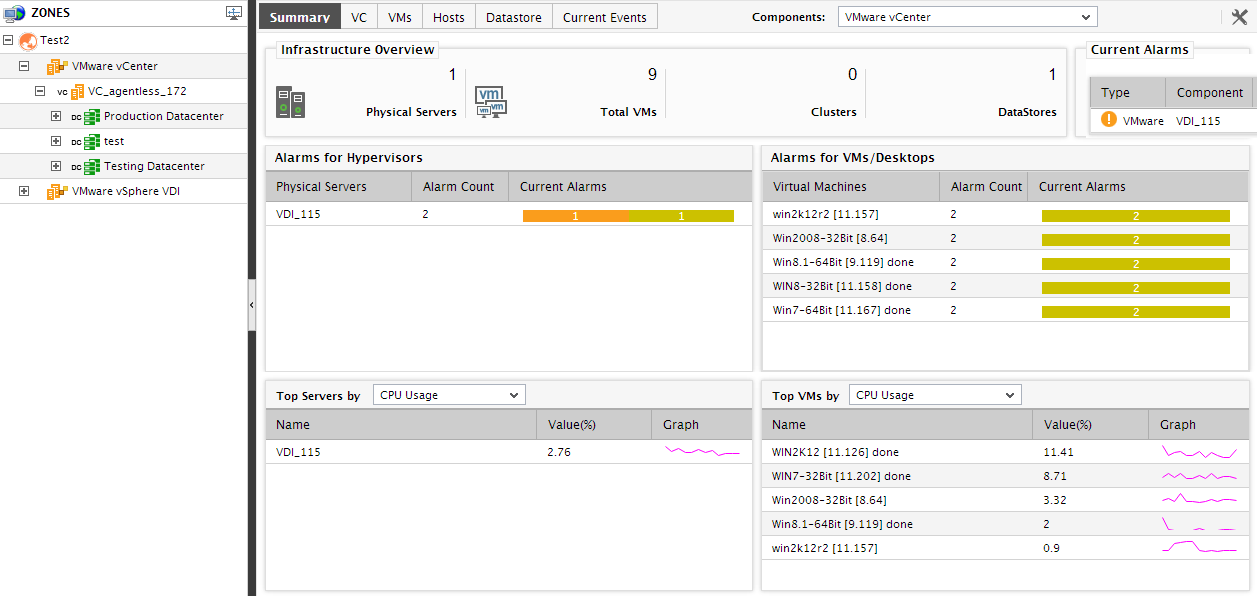
Figure 19 : The Summary tab page if the ‘VMware vCenter’ node is clicked
-
The Infrastructure Overview section of Figure 19 reveals the number of physical servers and VMs managed by all vCenter servers in a zone. Move your mouse pointer over each of these numbers to know the names of the ESX servers and VMs, and also that of the vCenter server managing them. Also, the number of unresolved issues related to these physical servers and VMs, and the number of performance degradations currently experienced by the managed vCenter servers themselves, will be added and displayed as the total number of Current Alarms in this section; this will provide you with a fair idea of how healthy the virtualized environment managed by vCenter is. To view the complete list of current alarms, move your mouse pointer over the number of current alarms. You can even focus on every performance issue individually by browsing the alarms, one after another, using the Current Alarms section in the Summary tab page.
To know which physical sever and which VM has contributed the maximum to the problems list, use the Physical Servers and Virtual Machines sections; these sections display the problem-prone ESX servers and VMs (respectively) across vCenter servers in a zone, and indicate how many problems of what severity are currently affecting each of the ESX servers and VMs. Move your mouse pointer over a problem severity corresponding to an ESX server or VM to view the details of the related alarms.
Besides, you can quickly identify the most resource-hungry ESX servers and VMs across vCenter servers in a zone, using the Top Servers by and Top VMs by sections in the Summary tab page. By default, these sections display the top-5 physical servers and VMs in terms of Physical CPU utilization. To view the toppers in the usage of a different resource, you can select a different measure from the list box available in both the sections. You can even add a new measure to the list or remove one/more of the existing measures using the procedure discussed in page In the Top Servers by list, in addition to the Physical CPU utilization measure, the following measures are available for selection by default: Used physical memory, Used space, Registered guests, and VM power-on state. If need be, you can override this default setting, so that new measures can be added to the list and one/more existing measures can be removed from the list. To do this, follow the steps given below: and page In the Top VMs by list on the other hand, in addition to the Physical CPU utilization measure, the following measures are available for selection by default: Memory usage, Disk capacity, and Percent disk usage. If need be, you can override this default setting, so that new measures can be added to the list and one/more existing measures can be removed from the list. To do this, follow the steps given below: of this document. Similarly, to view more number of physical servers and VMs in this section, you can change the default value 5 to a different number using the procedure discussed in page Also, by default, both lists will display the top-5 resource consumers only. This default setting can be overridden by following the steps given below: of this document. Using the information provided by these sections, you can determine the current resource usage of each displayed physical server and VM, and thus identify the physical server or VM that is consuming resources excessively. Also, by clicking on the miniature graph alongside a physical server or VM, you can expand the graph and effectively analyze the ups and downs in resource usage of the corresponding physical server or VM over time. This way, you can accurately determine whether the increase in resource usage (if any) occurred suddenly, or whether an upward trend in resource usage began earlier on.
-
If you click on a particular vCenter server under the VMware vCenter node, then the resulting Summary tab page will provide an overview of the performance of that vCenter server alone (see Figure 20).
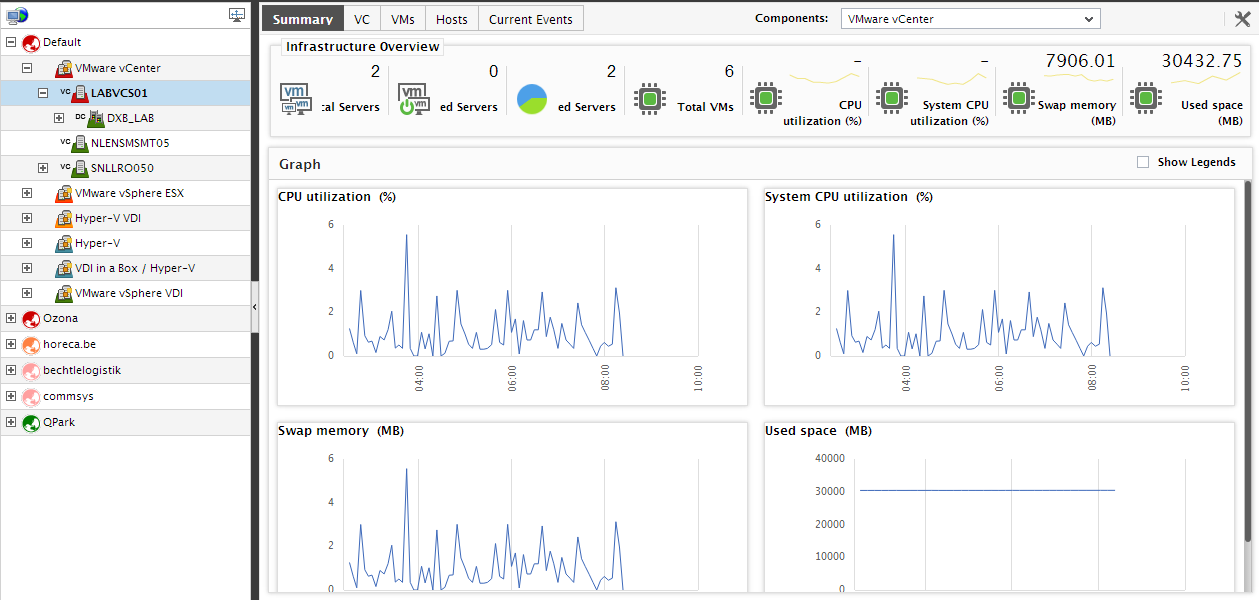
Figure 20 : The Summary tab page if the node representing a particular vCenter server is clicked in the tree
- Know how many ESX servers and VMs are managed by the chosen vCenter server using the Infrastructure Overview section of the Summary tab page. Also, determine how healthy the vCenter server and the virtualized environment it manages is by viewing the number of Current Alarms in the Infrastructure Overview section. Move your mouse pointer over any number in this section to view the corresponding details.
- Adjacent to the Infrastructure Overview section, you will find a vCenter Health section that reports in real-time, the availability and responsiveness of the vCenter server, the load on the server in the terms of current sessions to vCenter, and the current license usage of the server. You can proactively detect the non-availability or a slowdown of the vCenter server, a server overload, or excessive license usage by the server using the metrics reported by this section. Against every value displayed, a miniature graph is available, tracking the time-of-day variations in the values of the corresponding measures. Expand the graph by clicking on it. The expanded graph, by default, reveals how the corresponding measure has performed during the last 1 hour. You can plot the graph for a broader period by choosing a different Timeline for the graph. Using this graph, you can easily analyze the performance of the vCenter over time.
-
The Graphs section in the Summary tab page provides graphs that enable you to assess the CPU, disk, and memory usage of the vCenter server, over a default period of 6 hours. Resource usage trends can be accurately deduced from these graphs, and probable resource crunches can be proactively detected and averted. To zoom into a particular graph, click on it. The graph then expands (see Figure 21), so that you can study it clearly and make sound inferences. You can even change the Timeline of the graph, so that you can generate resource usage graphs for longer time periods, and perform more effective analysis.
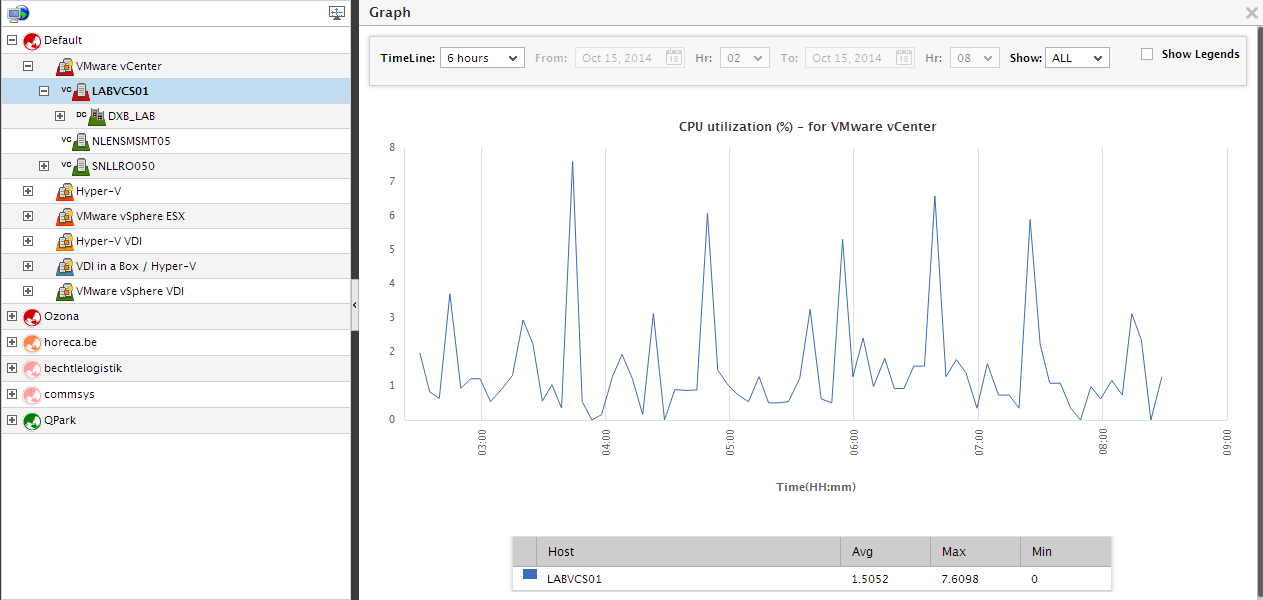
Figure 21 : Expanding a graph in the Graphs section of the Summary tab page
-
If vCenter manages the target virtualized environment as folders, then expanding a vCenter server node in the tree will reveal the folders managed by that vCenter. If you click on the folder node in the tree, the Summary tab page will change to provide an overview of the composition and current state of that folder (see Figure 22).
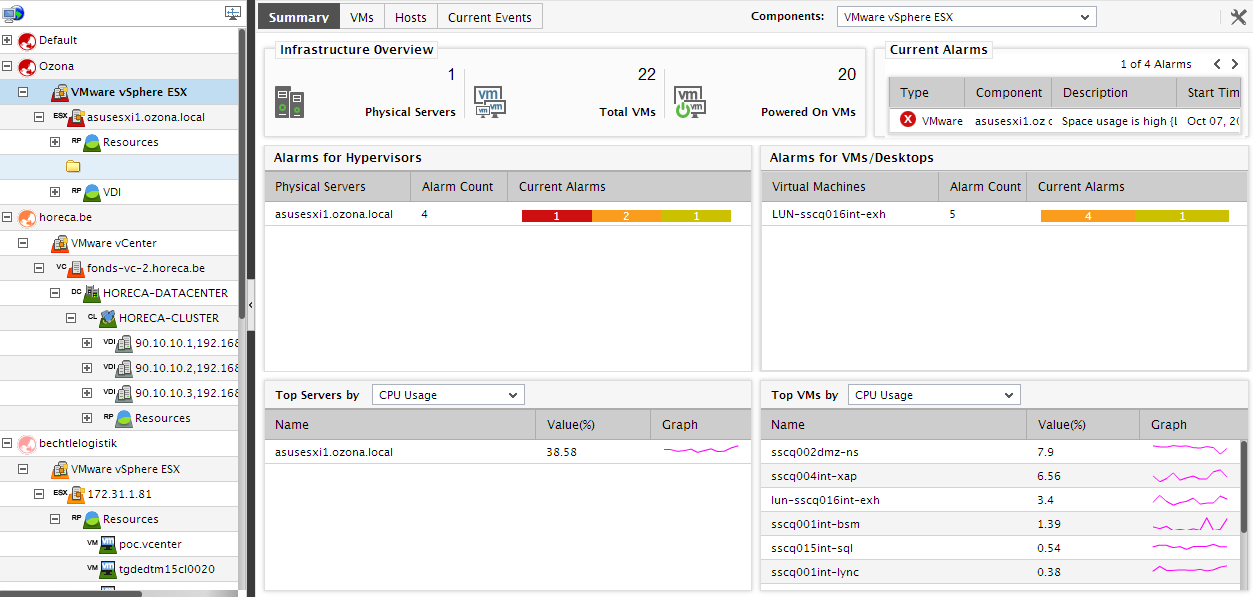
Figure 22 : The Summary tab page if a folder in the tree is clicked
-
The Infrastructure Overview section of Figure 23 displays the number of physical servers, VMs, datastores, and datacenters managed by the chosen folder. To know the names of these elements, move your mouse pointer over the corresponding element count. In addition, the section also displays the number of Current Alarms related to the elements managed by the folder, and thus enables you to quickly assess the overall health of folder. If you want to take a close look at each of the current alarms, use the Current Alarms section, and browse the alarms one after another.
In order to figure out which physical servers and VMs are responsible for these alarms, use the Physical Servers and Virtual Machines sections. These sections list the problem-prone physical servers and virtual machines (as the case may be) in the folder, along with the number and type of problems that each physical server/virtual machine is currently experiencing. Move your mouse pointer over an alarm priority corresponding to a physical server/VM to view the details of alarms of that priority that are currently open on that physical server/VM.
To track the resource usage of physical servers and VMs within a folder and to identify those physical servers and VMs that are consuming resources excessively, you can use the Top Servers by and Top VMs by sections. By default, both these sections list the top-5 physical servers and VMs (as the case may be) in terms of Physical CPU utilization. To identify the top-5 consumers of a different resource, you can select a different measure from the list box available in both the sections. You can even add more measures to these list boxes for selection using the procedure discussed in page In the Top Servers by list, in addition to the Physical CPU utilization measure, the following measures are available for selection by default: Used physical memory, Used space, Registered guests, and VM power-on state. If need be, you can override this default setting, so that new measures can be added to the list and one/more existing measures can be removed from the list. To do this, follow the steps given below: and page In the Top VMs by list on the other hand, in addition to the Physical CPU utilization measure, the following measures are available for selection by default: Memory usage, Disk capacity, and Percent disk usage. If need be, you can override this default setting, so that new measures can be added to the list and one/more existing measures can be removed from the list. To do this, follow the steps given below: of this document. Likewise, you can view more number of leading resource consumers in this section by changing the default value 5 to another number using the procedure discussed in page Also, by default, both lists will display the top-5 resource consumers only. This default setting can be overridden by following the steps given below: of this document.
-
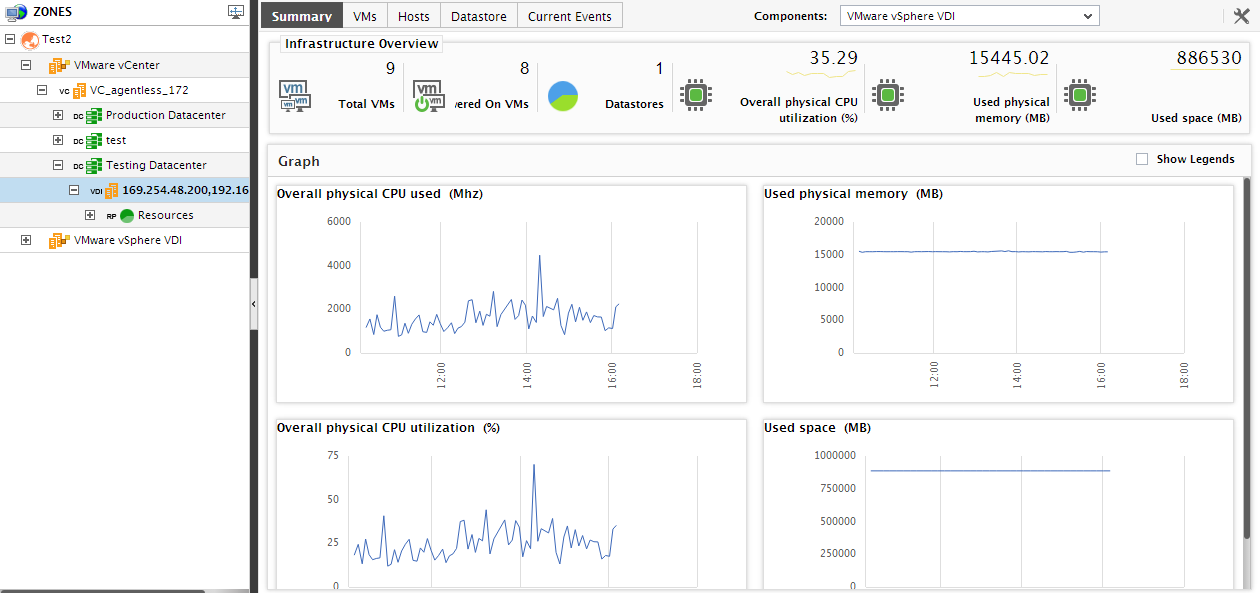
If a folder node exists, then expanding this node in the tree, will reveal the datacenters included in that folder. If no folders exist, then you would have to expand the vCenter server node in the tree to view the datacenter sub-nodes. If you click on the node representing a datacenter in the tree-structure, then the contents of the Summary tab page will change to provide an overview of the composition and health of that datacenter (see Figure 23).
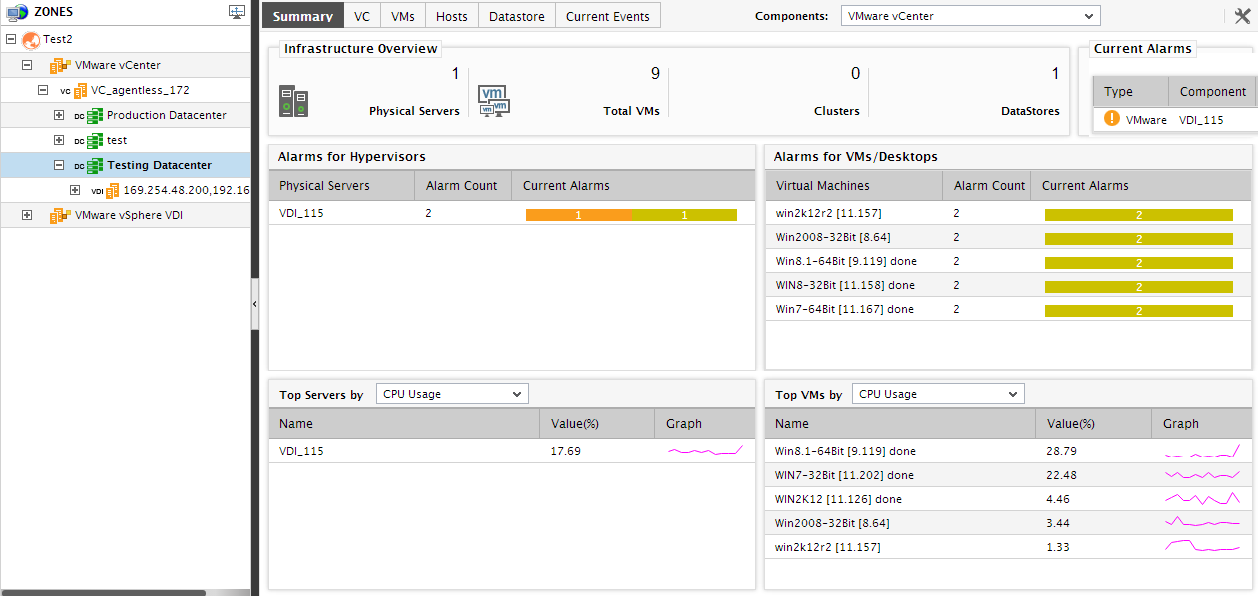
Figure 23 : The Summary tab page of a datacenter chosen from the tree-structure
-
The Infrastructure Overview section of Figure 23 displays the number of physical servers, VMs, and datastores managed by the chosen datacenter. To know the names of these elements, move your mouse pointer over the corresponding element count. In addition, the section also displays the number of Current Alarms related to the elements managed by the datacenter, and thus enables you to quickly assess the overall health of the datacenter. If you want to take a close look at each of the current alarms, use the Current Alarms section, and browse the alarms one after another.
In order to figure out which physical servers and VMs are responsible for these alarms, use the Physical Servers and Virtual Machines sections. These sections list the problem-prone physical servers and virtual machines (as the case may be) in the datacenter, along with the number and type of problems that each physical server/virtual machine is currently experiencing. Move your mouse pointer over an alarm priority corresponding to a physical server/VM to view the details of alarms of that priority that are currently open on that physical server/VM.
To track the resource usage of physical servers and VMs within a datacenter and to identify those physical servers and VMs that are consuming resources excessively, you can use the Top Servers by and Top VMs by sections. By default, both these sections list the top-5 physical servers and VMs (as the case may be) in terms of Physical CPU utilization. To identify the top-5 consumers of a different resource, you can select a different measure from the list box available in both the sections. You can even add more measures to these list boxes for selection using the procedure discussed in page In the Top Servers by list, in addition to the Physical CPU utilization measure, the following measures are available for selection by default: Used physical memory, Used space, Registered guests, and VM power-on state. If need be, you can override this default setting, so that new measures can be added to the list and one/more existing measures can be removed from the list. To do this, follow the steps given below: and page In the Top VMs by list on the other hand, in addition to the Physical CPU utilization measure, the following measures are available for selection by default: Memory usage, Disk capacity, and Percent disk usage. If need be, you can override this default setting, so that new measures can be added to the list and one/more existing measures can be removed from the list. To do this, follow the steps given below: of this document. Likewise, you can view more number of leading resource consumers in this section by changing the default value 5 to another number using the procedure discussed in page Also, by default, both lists will display the top-5 resource consumers only. This default setting can be overridden by following the steps given below: of this document.
-
To receive an overview of the performance of a cluster within a datacenter, you will have to click on the cluster sub-node under the datacenter node in the tree-structure. The Summary tab page will then change as depicted by Figure 24.
-
For a particular cluster, the Summary tab page will provide a quick summary of the performance of that cluster, so as to enable you to gauge how healthy the cluster is. The Infrastructure Overview section of the Summary tab page displays the number of physical servers, VMs, powered-on VMs, and resource pools that the chosen cluster consists of. In addition, the Current Alarms information in this section displays the number of issues related to the cluster that are still unresolved; this serves as an effective indicator of the overall health of the cluster. Move your mouse pointer over any number in this section to view the corresponding details.
To be alerted in real-time to abnormalities in resource usage by the cluster, you can use the Resources section. This section reports how well the cluster is currently using the physical memory and CPU resources available to it; alongside every usage value displayed in this section, you will find a miniature graph. Click on the graph to expand it, and view the time-of-day variations in resource usage during the last 1 hour (by default). You can even change the Timeline of the graph for analyzing usage patterns over a longer period of time. This graph helps you quickly detect disturbing trends in the usage of physical resources, and initiate corrective actions at the earliest.
The Graphs section in the Summary tab page displays a series of graphs depicts how the cluster has been using the physical memory and CPU resources available to it over a default period of 6 hours. You can magnify any of these graphs by clicking on it. You can even change the Timeline of the expanded graph, to facilitate more effective analysis of the resource usage. Using these graphs, you can determine how resource-intensive the cluster has been.
- To figure out, from a mere glance, the current state of an ESX host included in a cluster, click on the sub-node representing an ESX host under the cluster node. The Summary tab page will then change as depicted by Figure 24.
-
For an ESX host, the Infrastructure Overview section of Figure 1 reveals the number of VMs configured on the ESX host, the number of powered-on VMs, and the number of datastores used by the ESX host. By moving your mouse pointer over any of these numbers, you can view the corresponding details - i.e., the names of VMs/datastores, as the case may be. This way, you can rapidly identify the VMs that are currently powered-off. Moreover, the section also displays the number of Current Alarms related to the ESX host chosen from the tree, and thus enables you to quickly judge the current health of the ESX host. For complete details of the current alarms, move your mouse pointer over the number of Current Alarms.
The Resources section of Figure 24 reports the percentage/amount of physical CPU, memory, and disk resources that the ESX host chosen is currently using. Sudden spikes in resource consumption by the ESX host can be promptly detected by closely observing the change in the resource usage levels reported by this section. Every value displayed in this section is accompanied by a miniature graph, which when clicked, expands to reveal how well the corresponding resource usage metric has performed during the last 1 hour (by default). To analyze the behavior of the said measure over a longer period of time, you can change the Timeline of the expanded graph. In the event of excessive resource usage by the ESX host, you can use this graph to figure out when exactly the upward trend in resource consumption began, and then, proceed to investigate the reasons for the same.
In addition to the Resources section, a Graphs section is also available in the Summary tab page. This section provides a series of graphs, which track the physical CPU, memory, and disk resources used by the ESX host during the last 6 hours (by default). Click on a graph in this section to expand it. Using the expanded graph, you can even change the Timeline of the graph, so that you can observe usage patterns over longer periods of time.
-
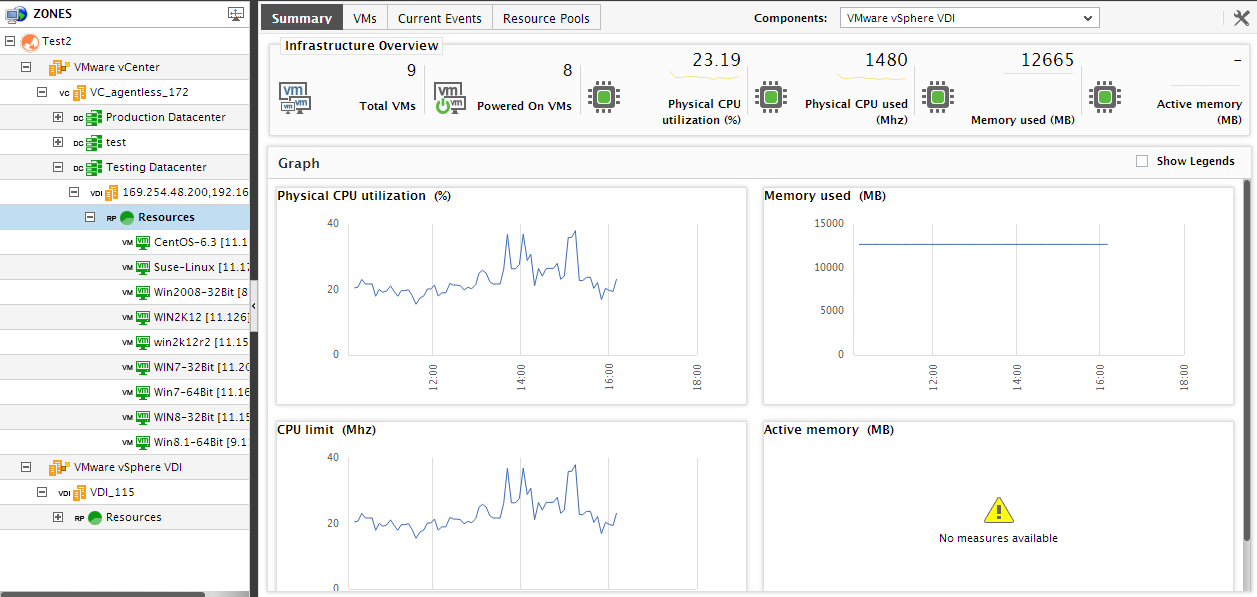
If resource pools are configured on a cluster, then each resource pool will appear as a sub-node of that cluster node. When a resource pool sub-node is clicked, the Summary tab will change as depicted by Figure 2.
-
The Infrastructure Overview section of Figure 25 reveals the number of VMs, powered-on VMs, and current alarms in the resource pool clicked on. Move your mouse pointer over any number in this section to view the corresponding details. This information enables you to swiftly identify powered-off VMs and also assess the overall health of the resource pool.
The Resources section reports the availability and usage of critical resources allocated to the resource pool, in real-time. Any sudden increase in usage of a resource can be promptly detected using the values reported by this section. Adjacent to every value, a miniature graph is provided. To track the usage of a resource over time, click on the miniature graph. The graph expands to reveal how well the resource pool used the corresponding resource during the last 1 hour (by default). You can even change the Timeline of the graph to understand resource usage trends over longer time periods.
The Graphs section of the tab page provides time-of-day graphs that reveal the variations in the physical CPU and memory usage by the resource pool during the last 6 hours (by default). Analysis of the resource consumption of the pool over time reveals whether the pool has been using resources optimally or inefficiently. Clicking on a graph expands it. You can change the Timeline to analyze resource usage over broader time periods.