The VMs Tab Page
The VMs tab page provides VM-centric information such as the name of the discovered VMs, the physical server on which each VM executes, and the metrics indicating how every VM uses its allocated and physical resources. Besides revealing resource-hungry VMs, this tab page also brings to light improper resource allocations to VMs.
This tab page, by default, provides the details of those VMs that are executing on the managed VMware vSphere ESX servers in your environment. Similarly, the details of the top-10 VMs alone will be displayed in this tab page, by default. These default settings can however be overridden by following steps given below:
- Click on the
 button at the right, top corner of the VMs tab page.
 -
Figure 1 then appears.
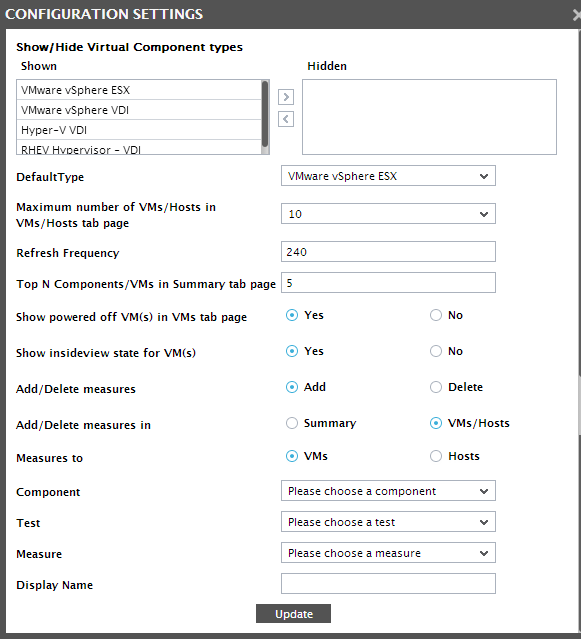
- By default, the Maximum number of VMs/Hosts in VMs/Hosts in tab pages parameter is set to 10, indicating that the top-10 VMs are by default listed in the VMs tab page. You can override this default setting by changing the value of this parameter in Figure 1.
- Similarly, you will find that the DefaultType list is set to VMware vSphere ESX in Figure 1. This indicates that, by default, only those VMs that are executing on managed VMware vSphere ESX servers in the environment will be listed in the VMs tab page. To view details pertaining to the VMs on another virtualized component-type by default, select a different option from the DefaultType list.
- Finally, click the Update button in Figure 1.
The VMs listed in this tab page change according to the node chosen from the tree-structure in the left panel. This section brings out these differences.
-
If the global Zones node is selected in the left panel, then the VMs tab page in the right panel will list the top 10 (by default) virtual machines that the eG agent auto-discovers from across all the managed virtual hosts of the chosen type (see Figure 2).
Note:
By default, the VMs displayed in the vms tab page are sorted in the order of their state - i.e., the powered-off VMs will top the list, followed by the powered-on VMs. Sometimes, administrators may want to hide the details of powered-off VMs from the vms tab page, and instead view the resource usage metrics of the powered-on VMs alone. To enable this, follow the steps discussed below:
- Edit the eg_ui.ini file in the <eg_install_dir>\manager\config directory.
- In the [vmdashboard_display] section of the file, you will find that the showPoweredOffVMs flag is set to Yes by default. This indicates that, by default, the vms tab page will display powered-off VMs as well. Set this flag to No if you want the vms tab page to only display powered-on VMs.
- Finally, save the file.
- If state is the same across VMs, then the VMs are arranged in the order of their names. Against every VM listing, the state of the VM (whether powered on or off), the physical server on which the VM executes and the current resource usage metrics pertaining to each VM are displayed, so that administrators will be able to accurately identify powered-off VMs and resource-intensive VMs across all the managed physical servers (of the chosen type) in the environment, from just a quick glance. If required, you can sort the VM listing on the basis of any of the resource usage metrics. To change the sort order on-the-fly, click on the column head that represents the usage metric you want to sort on - for instace, to sort based on the CPU usage of the VMs, click on the column heading CPU used.
- The resource usage metrics that accompany each VM displayed in this tab page are pre-configured in the eG Enterprise system.
-
If need be, you can alter this default measure list, so that more useful measures are displayed per VM or one/more unnecessary measures are removed from the display. To effect this change, follow the steps given below:
- Click on the
 button at the right, top corner of the VMs tab page.
 - Figure 2 then appears. First, select the Add option from the Add/Delete section.
-
Then, to add a new measure to the VMs tab page, select the VM/Hosts option from the Add/Delete measures in section in Figure 2.
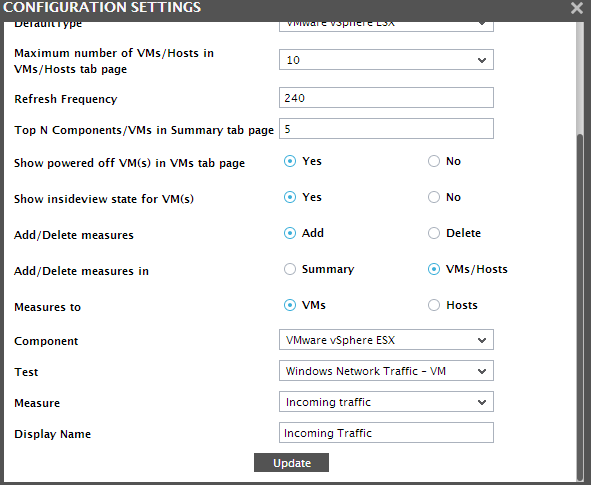
- Then, select vms from the Measures to section.
- Then, pick the virtualized Component type for which a measure is to be added to the vms tab page.
- Select the Test that reports the measure.
- Choose the Measure.
- Provide a Display Name for the measure.
- Finally, click the Update button in Figure 2 to save the changes.
- To remove an existing measure from the vms tab page, select the Delete option from Add/Delete, pick the VMs/Hosts option from the Add/Delete measures in section, set the Measures to flag to VMs, select the Component type, pick the Test that reports the measure, pick the Measure, and click the Update button.
- Click on the
-
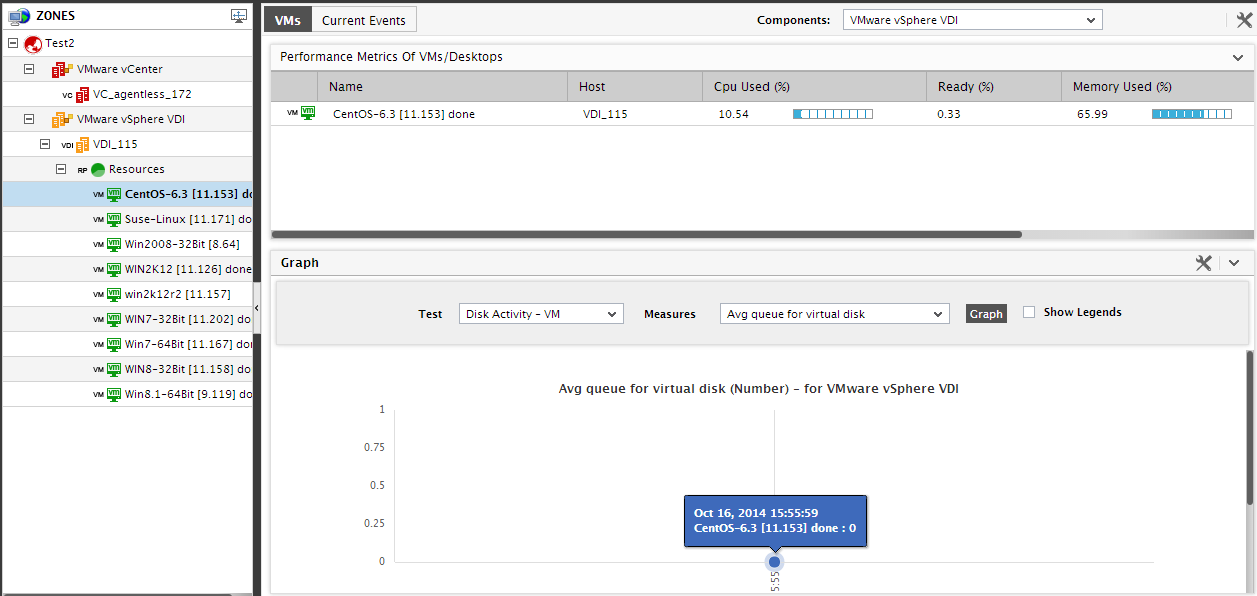
To zoom into the performance of a “powered on” VM, simply click on the VM Name in the right panel. This will invoke Figure 3 displaying all the performance metrics extracted from that VM in real-time. You are thus enabled to cross-correlate across the various metrics, and quickly detect the root-cause of current/probable disturbances to the internal health of a VM.
Note:
If you click on the Name of a powered off VM in the VMs tab page, then Figure 3 will not appear. Instead, you will be lead to the layer model page of the physical server on which the VM executes, which will allow you to verify whether the VM is indeed powered off or not.
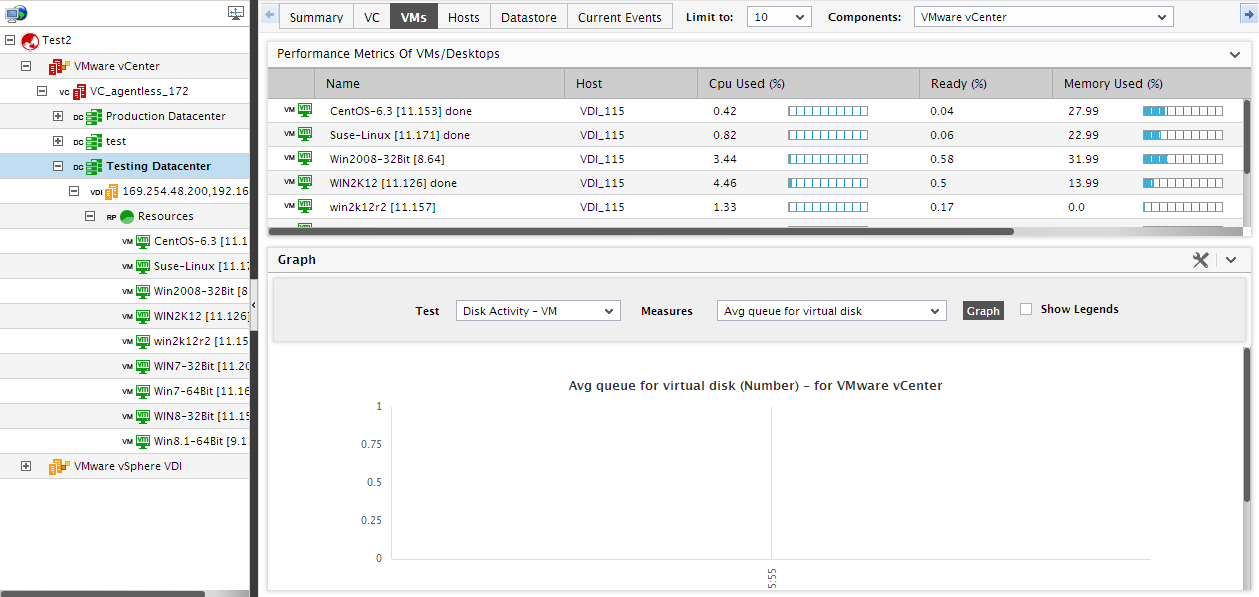
Figure 3 : The VMs tab page if the global Zones node is clicked
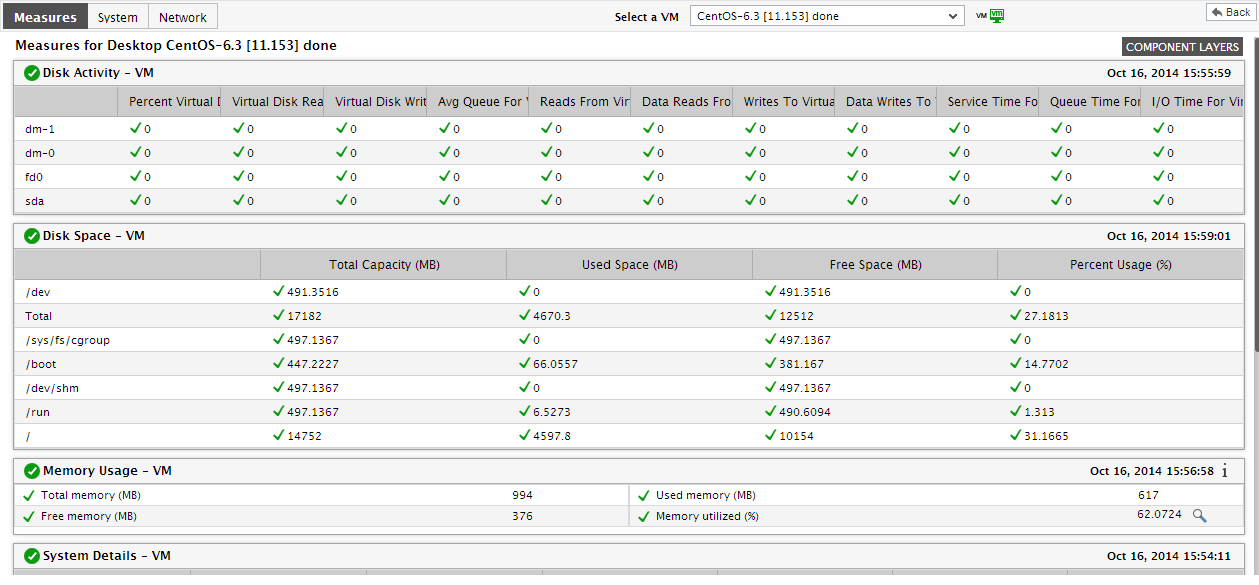
Figure 4 : Zooming into the performance of a VM from the VM dashboard
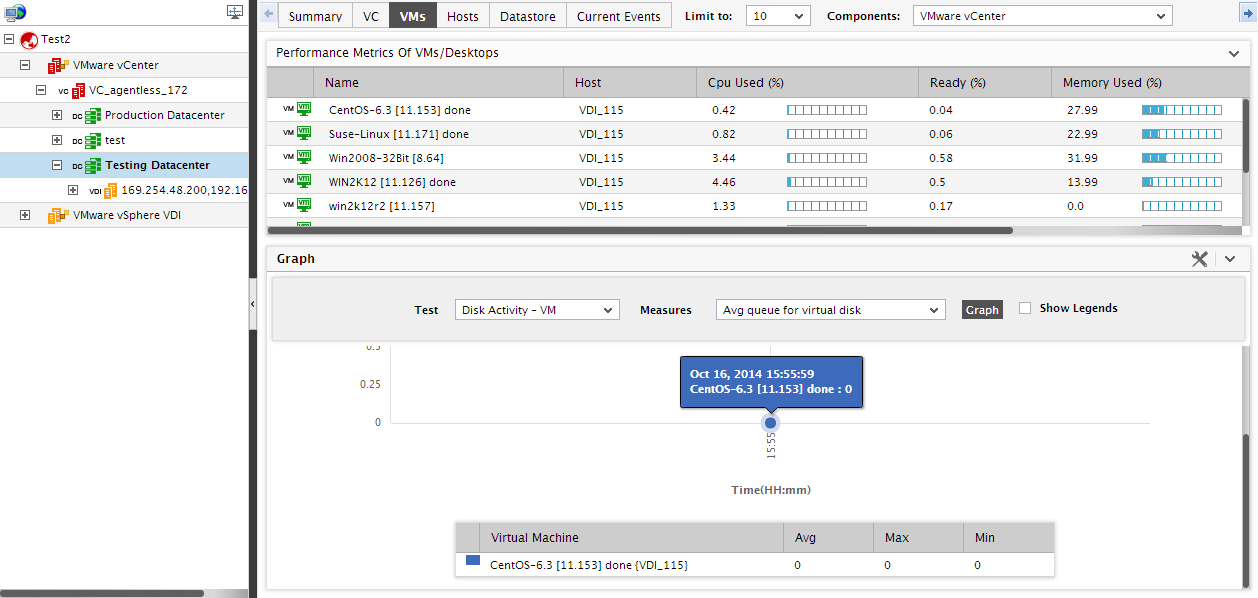
- Below the VMs list, you will find a Graph section (see Figure 4). This section will be available in every tab page in the right panel of the VM dashboard. For the VMs tab, the Test list in this section will be populated with all those tests that report metrics for each VM on the virtual hosts of the chosen type. These tests will be sorted in the order of the test names, and the top test in the sorted test list will be selected by default in the Test list box. The Measures list naturally, will be populated with those metrics that the default Test reports. Since this list too is sorted in the order of the measure names, the top measure in the sorted list will be chosen by default in the Measures list. Accordingly, for the global Zones node in the left panel, the graph that appears in this section traces the variations in the default measure across all VMs (on virtual hosts of the chosen type) during the default timeline of 1 hour. Using this graph, administrators can compare the performance of a particular measure across VMs, and accurately identify those VMs that are weak in a chosen performance arena. If need be, you can plot a comparison graph for a different Test-Measure pair, for a different timeline. To change the timeline, click on Timeline; the window depicted by Figure 4 will then pop out, allowing you to change the date and time.
-
A legend is provided at the end of every graph clearly indicating which VM is represented using which color in the graph. This is accompanied by the Avg, Max, and Min values that the chosen Measure has recorded for every VM during the chosen Timeline. To view the legend, you can scroll down the Graph section (see Figure 5):
-
To view the graph more clearly, you can enlarge it by clicking the
button indicated by Figure 5 above. The graph then zooms as depicted by Figure 6. 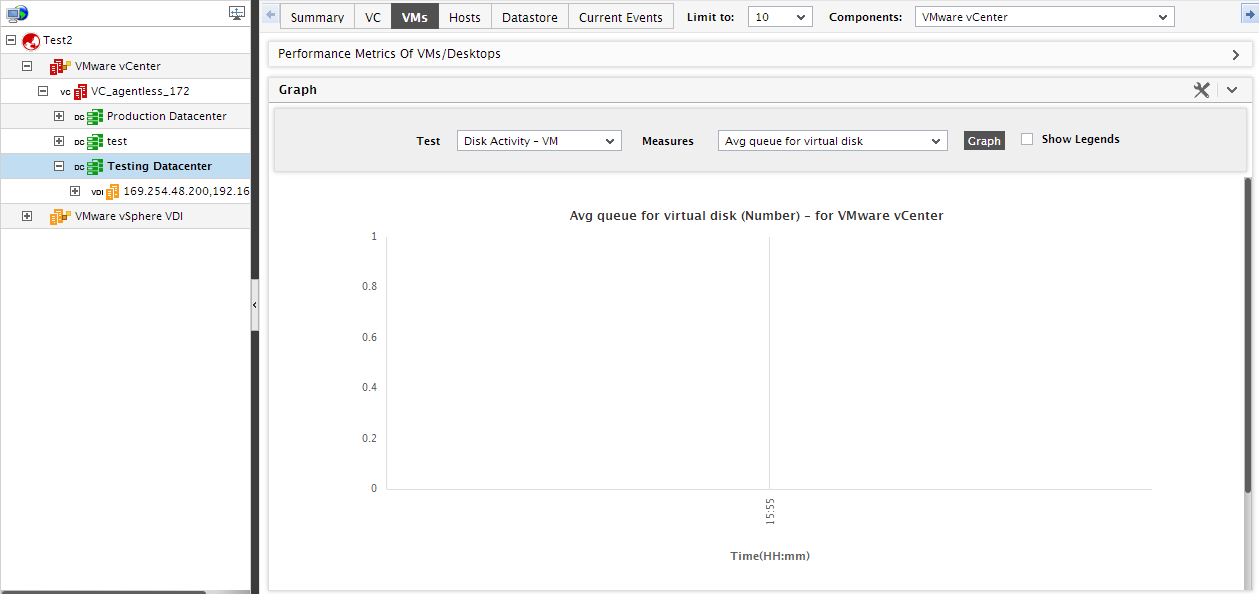
-
You can even hide the Graph section by clicking on the
 button below the VMs list. The dashboard will then look as depicted by Figure 6.
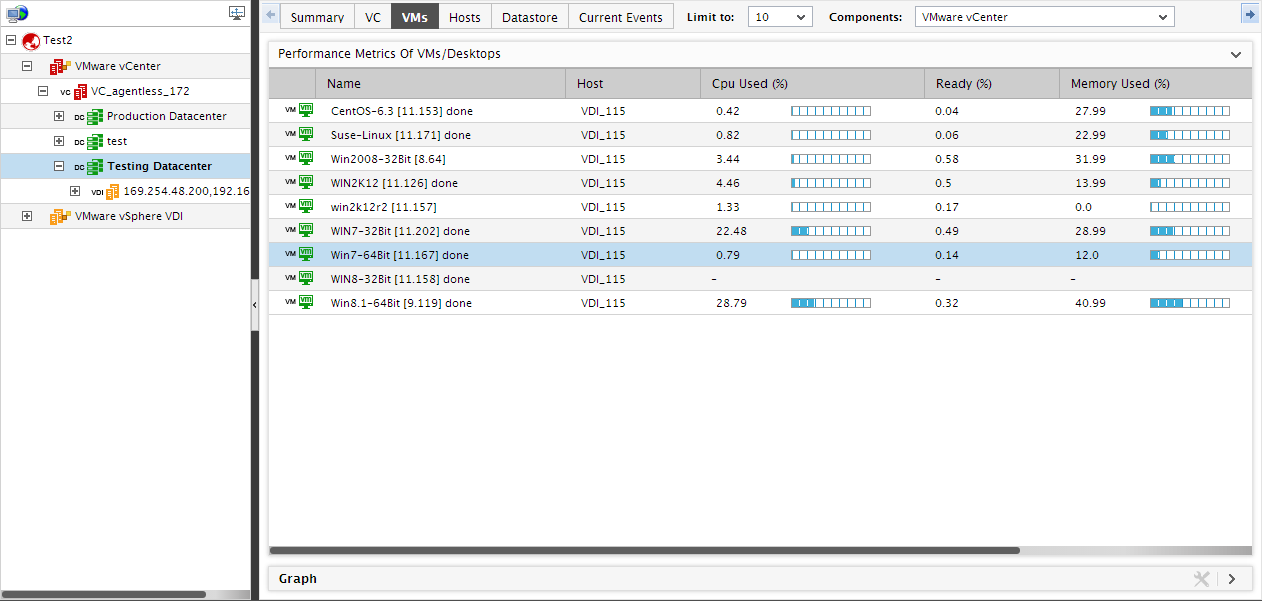
-
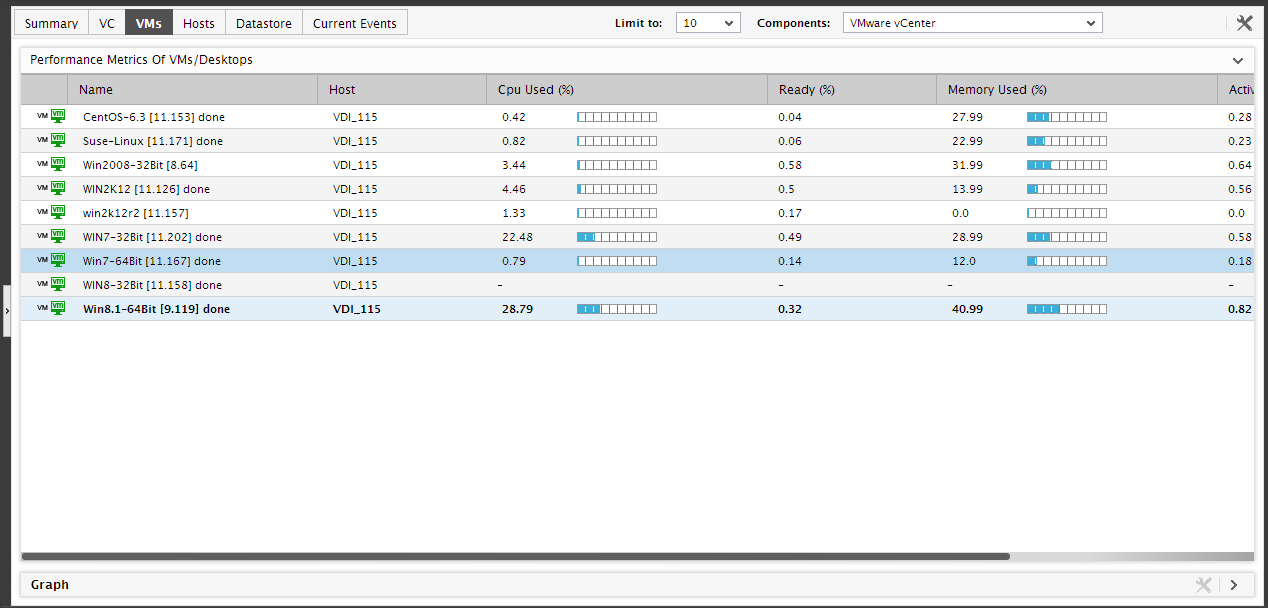
You can then click on the button indicated by Figure 7 to restore the Graph section. Similarly, you can hide the tree-structure by clicking on the button next to the tree (see Figure 8). This ensures that the right panel expands and fills the vacuum created by the tree (see Figure 8).
- To restore the tree, click on the button indicated by Figure 9.
- Now, let us see what happens if a particular zone is chosen from the tree-structure in the left panel. When this is done, the VMs list in the right panel will change to display the state and resource usage metrics related to the top-10 (by default) VMs that are executing on those physical servers (of the chosen type) that are included in the zone that is clicked on. This information helps administrators analyze how the performance of one/more VMs in a zone impact the performance of the zone as a whole (see Figure 10).
-
If you then drill down a particular zone in the tree, you will be able to view the virtual component-types that form part of the zone, and their current state. If you click on a particular component-type in the tree, the VMs tab page in the right panel will allow you to view the state and usage metrics pertaining to the top-10 (by default) VMs executing on the virtual hosts of that type that are included in the corresponding zone (see Figure 11).
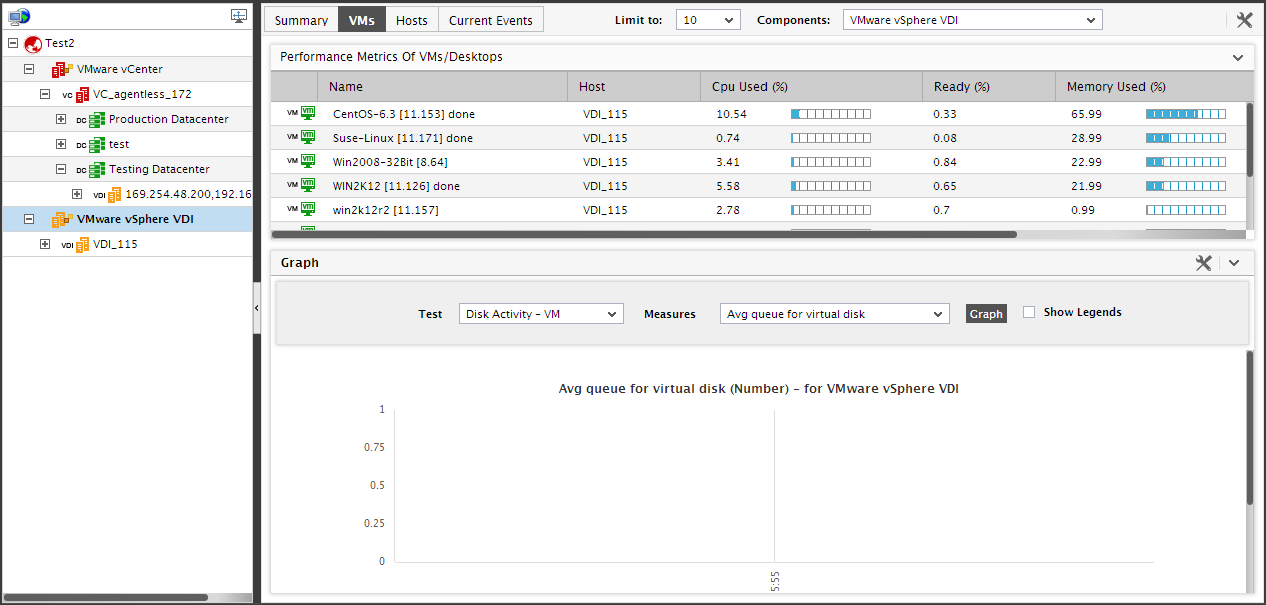
Figure 9 : The VMs tab page for a virtual component type in the tree
-
If the vCenter servers in your environment are being monitored as part of a zone, then expanding that zone’s node in the tree would reveal the VMware vCenter component-type. When this component-type is clicked on, the VMs tab page will change to display the state and resource usage metrics related to the top-10 (by default) VMs that are executing on the virtual hosts managed by all the vCenter servers included in that zone.
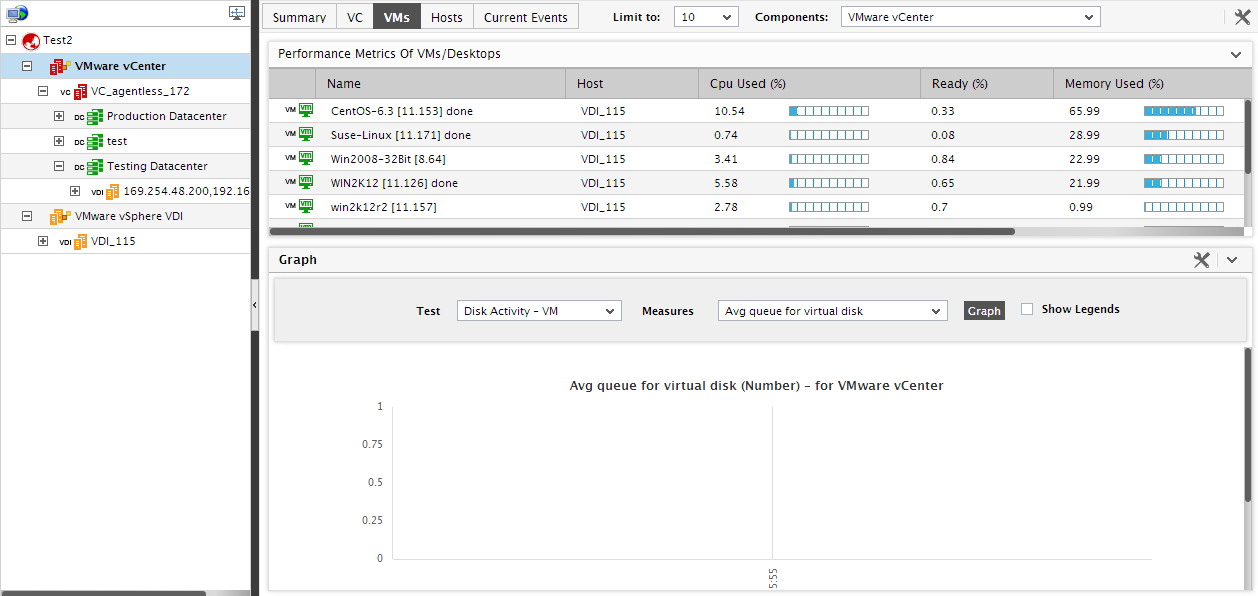
Figure 10 : The VMs tab page if the ‘VMware vCenter’ node is clicked
-
To know which vCenter servers have been added to a zone, just expand the VMware vCenter sub-node under the zone node in the tree. This will reveal the name and the current state of the vCenter servers in that zone. Clicking on a particular vCenter server in the tree will provide the complete details of the top-10 VMs (by default) executing on the virtual hosts managed by that vCenter component.
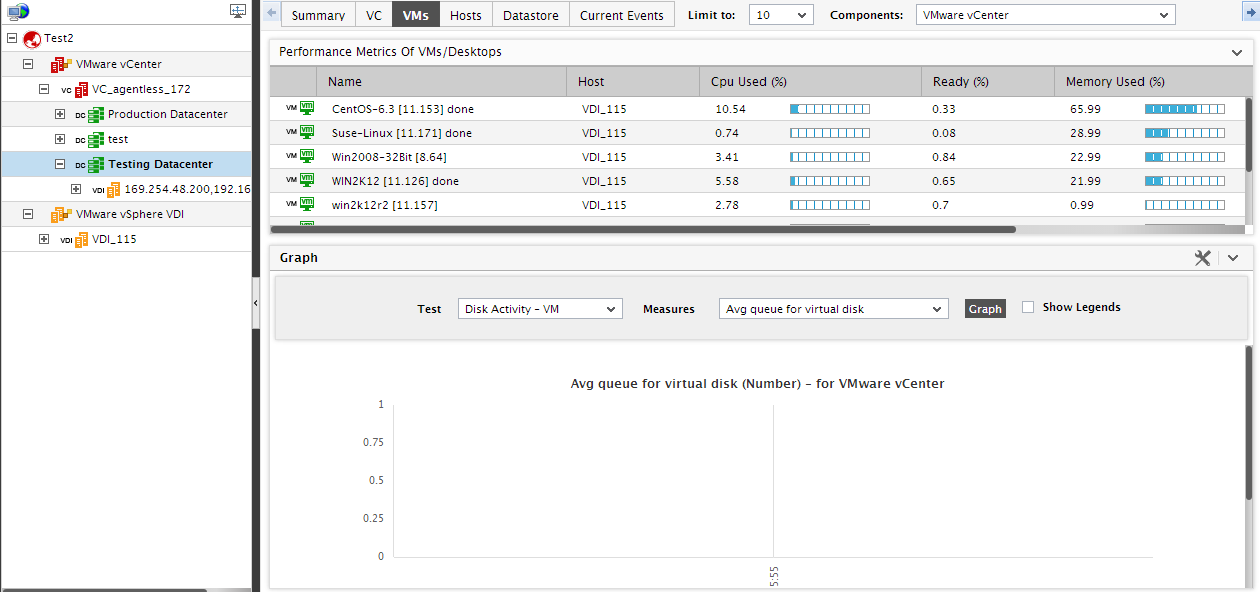
Figure 11 : The VMs tab page if a particular vCenter server is chosen from the tree
- If a vCenter server manages the virtualized environment as folders, then expanding the vCenter server node in the tree will reveal sub-nodes representing the folders configured on that vCenter server. Click on a folder to view the resource usage metrics related to the VMs executing on the ESX servers included in that folder (see Figure 11).
-
Expanding the node representing a vCenter server will reveal the datacenters that have been configured on that vCenter. If the datacenters are included in a folder, then expanding the folder sub-node under the vCenter server node will reveal the datacenters. Click on a datacenter to view the names of the VMs executing on the hosts that reside within that datacenter, and the resource usage of each VM (see Figure 12).
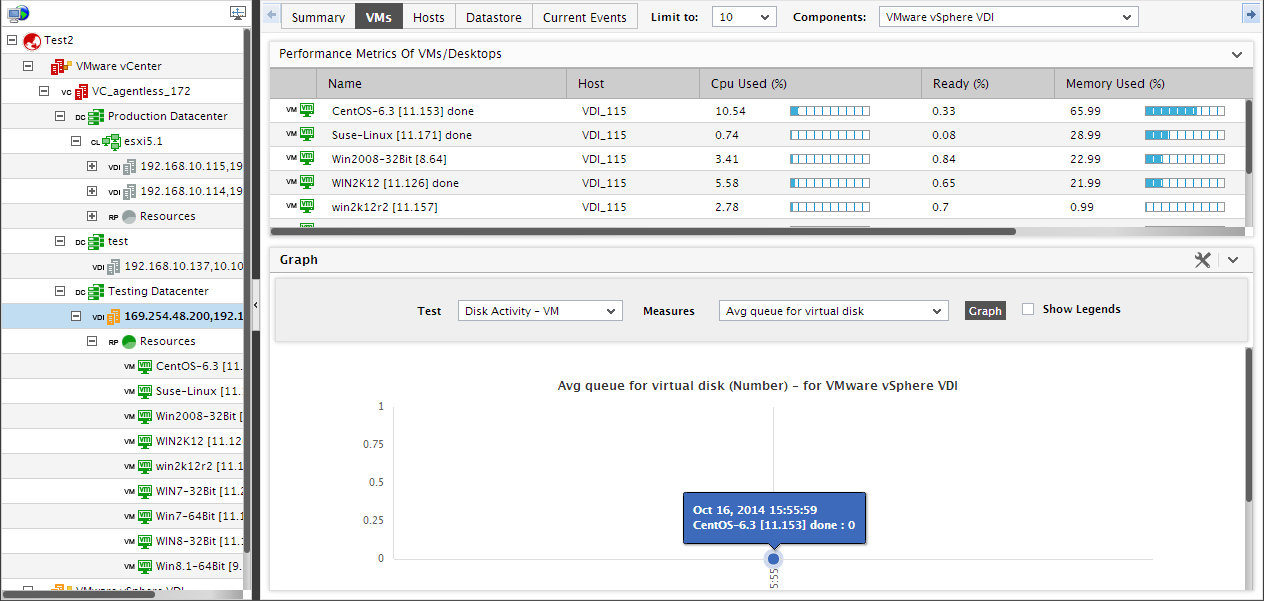
Figure 12 : The VMs tab page if a datacenter configured on vCenter is clicked
-
Typically, when you expand datacenter in the tree, all the physical ESX servers that are being managed by that vCenter server will appear.
Note:
While the vCenter server tree will list even those ESX servers that are not monitored by eG Enterprise, the tree will not indicate the current state of such servers; also, clicking on any such server will not display corresponding performance information in the tab pages in the right panel.
However, many vCenter installations manage clusters of ESX servers. If such clusters have been configured on any monitored vCenter server, then, in the Virtual Infrastructure tree, these clusters will appear as sub-nodes of that datacenter node. If you click on a cluster sub-node in the tree, the VMs tab page will reveal the state and performance information pertaining to the top-10 VMs (by default) that are executing on the ESX servers that are part of the cluster clicked on.
-
To view the individual virtual hosts that are part of a zone, do any of the following:
- Expand the nodes representing the virtual component-types in the zone;
- If the zone consists of components of type VCenter, expand the node representing the monitored vCenter server in your environment;
- If datacenters are configured on a monitored vCenter server, expand a datacenter sub-node under the vCenter server node;
- If clusters are configured within a datacenter, expand the cluster sub-node;
- If you then click on a virtual host in the tree, the VMs tab page will change to display the state and measures extracted from the top-10 (by default) virtual machines that are executing on the chosen virtual host alone (see Figure 13).
-
Similarly, if you expand the virtual host node in the tree-structure, you can view the name and state of the VMs that are executing on that virtual host. If you now click on a VM in the tree, the metrics extracted from that VM alone will be displayed in the VMs tab page (see Figure 13).
-
If resource pools are configured on a virtual host, then the resource pools also will appear as the sub-nodes of the virtual host-node. Clicking on a resource pool in the tree will reveal the current state and resource usage metrics related to the top-10 (by default) VMs present in that resource pool, in the VMs tab page (see Figure 13).
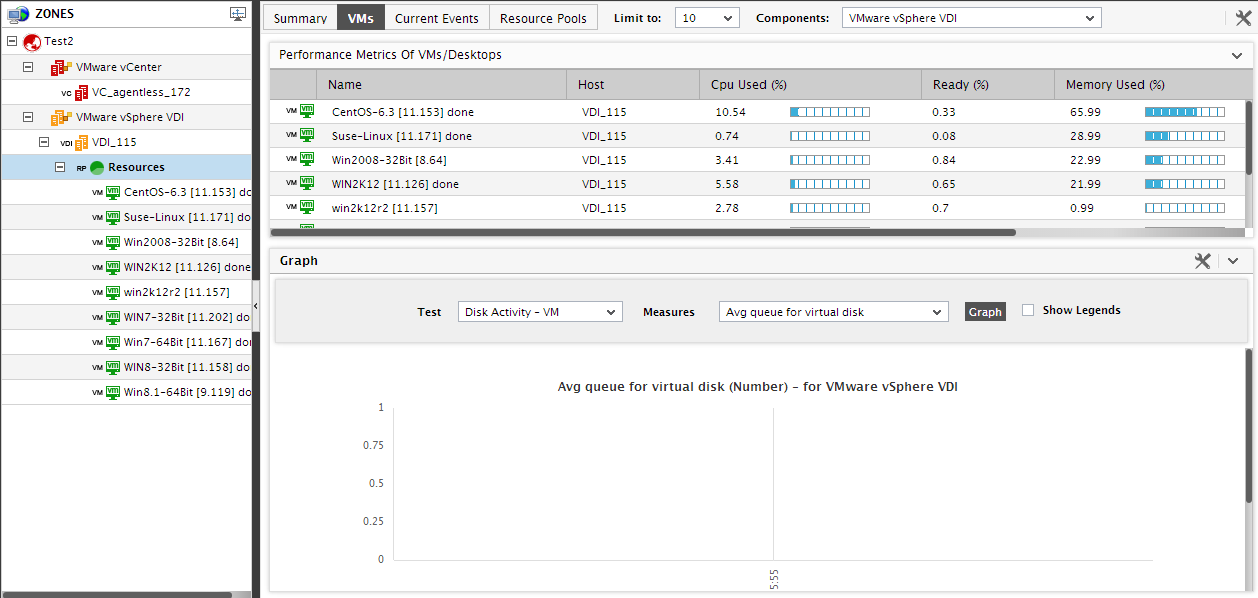
Figure 14 : The VMs tab page listing the VMs executing within a chosen resource pool