Zones Map
Typically, zones are associated with different geographies. While monitoring large infrastructures therefore, eG Enterprise allows you to drill down to view the exact geographic area where a zone operates, and instantly evaluate the performance of different zones spread across different locations worldwide. To access the map interface that provides this visual treat, select the Zones Map option from the Group tile of the eG monitor interface (see Figure 8). Figure 1 then appears indicating the zone locations and their current state. The geographic display of the maps within the eG Enterprise console is achieved through the integration of the eG management console with Google maps.
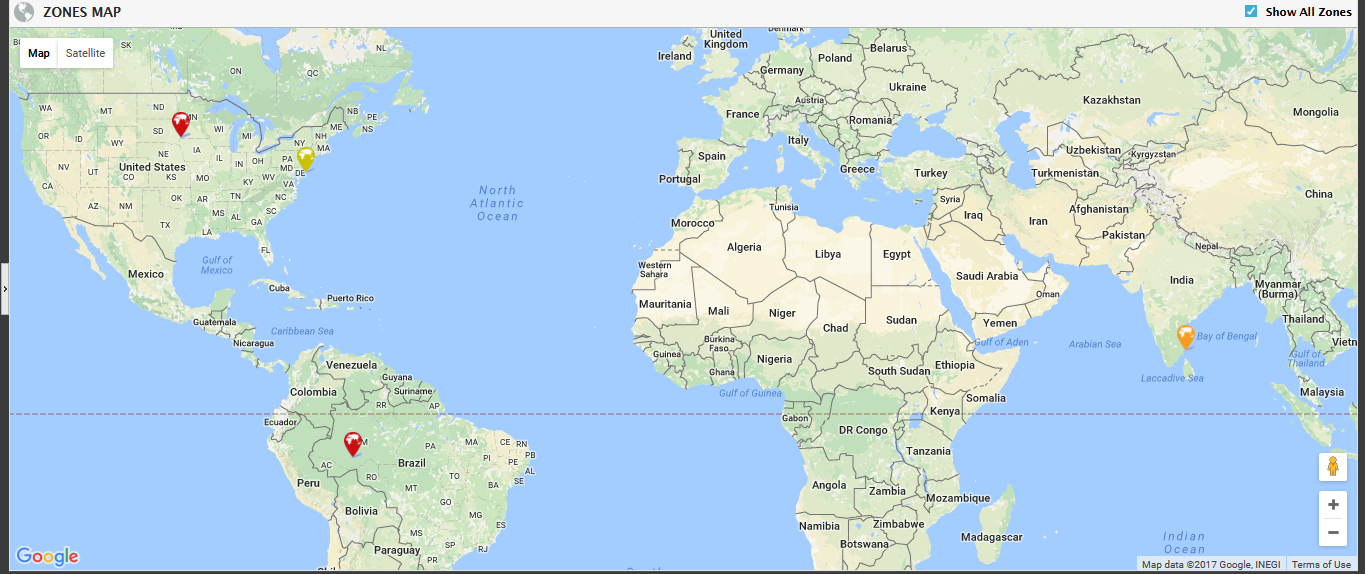
Figure 1 : The map interface revealing the zone locations and state
To the left of the zone map of Figure 1, you will find an arrow button which when clicked displays the list of zones created in the target environment.
Note:
By default, the Zones list appears alongside the map view in the eG monitoring console. To hide the tree view by default, do the following:
- Edit the eg_ui.ini file in the <EG_INSTALL_DIR>\manager\config directory.
- Set the zoneMapTree flag in the [ZONE_MAP] section of the file to no (default is yes).
- Save the eg_ui.ini file.
While the map enables you to determine the location and the current state of the zones, using the list of zones, you can quickly determine the following:
- The names of the zones for which locations have been explicitly defined in the eG administrative interface
- The state of each of these zones
-
The names of sub-zones added to a zone, provided the location of the sub-zone has been configured
Note:
This implies that zones for which locations have not been configured will neither appear in the map view, nor in the ZONES list. If location definitions do no exist for any of the configured zones, then the Zones Map option will not even appear in the Group tile of the eG monitoring console.
Typically, the parent zones and zones without any sub-zones will form the primary nodes of the Zones list. Likewise, the zone map to the right of the tree will also display only the primary zones by default. The ‘+’ sign preceding a zone name in the tree, indicates that the zone consists of one/more sub-zones. If you want to view the sub-zones of a particular zone, expand the corresponding node by clicking on the ‘+’ sign. For instance, Figure 1 indicates that the east_coast zone consists of sub-zones. Expanding the east_coast zone reveals that a newyork_zone has been included in the east_coast zone (see Figure 2).
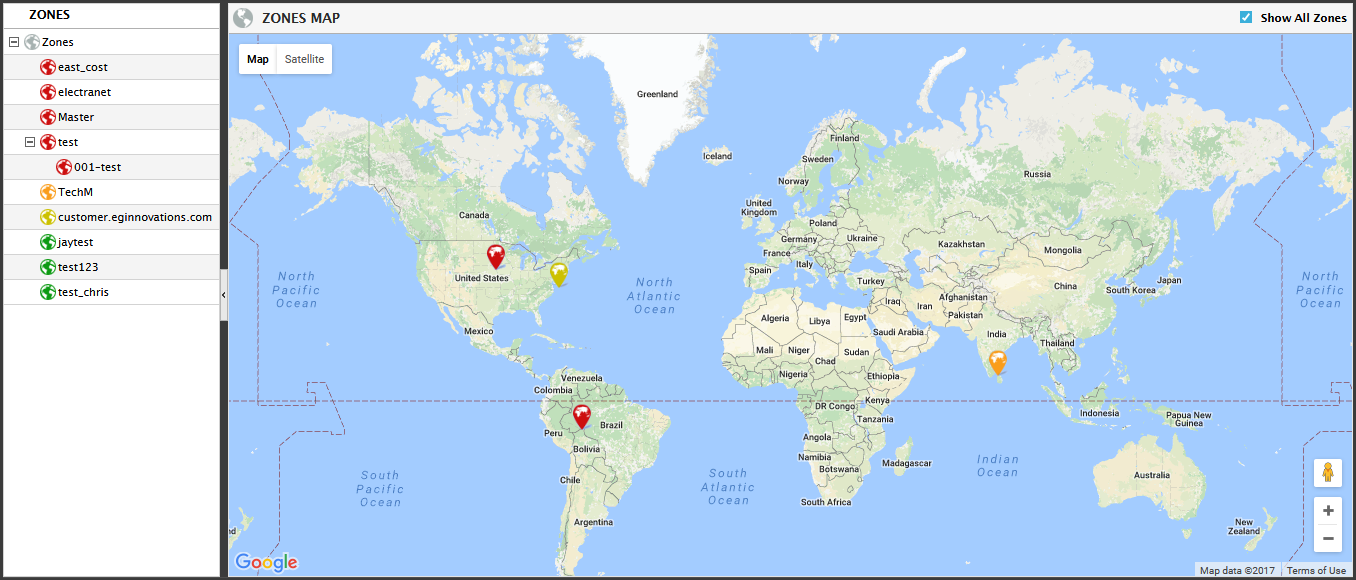
Figure 2 : Expanding a zone in the tree
As stated earlier, by default, the zone map does not indicate the location of ‘sub-zones’. To view the same, simply click on the primary zone (i.e., the parent zone) in the ZONES list. Figure 3 is thus invoked, which automatically zooms into the location of the sub-zone that is included in the parent zone that was clicked on. Figure 3 for example, displays the location of the newyork_zone that lies within the east_coast zone.
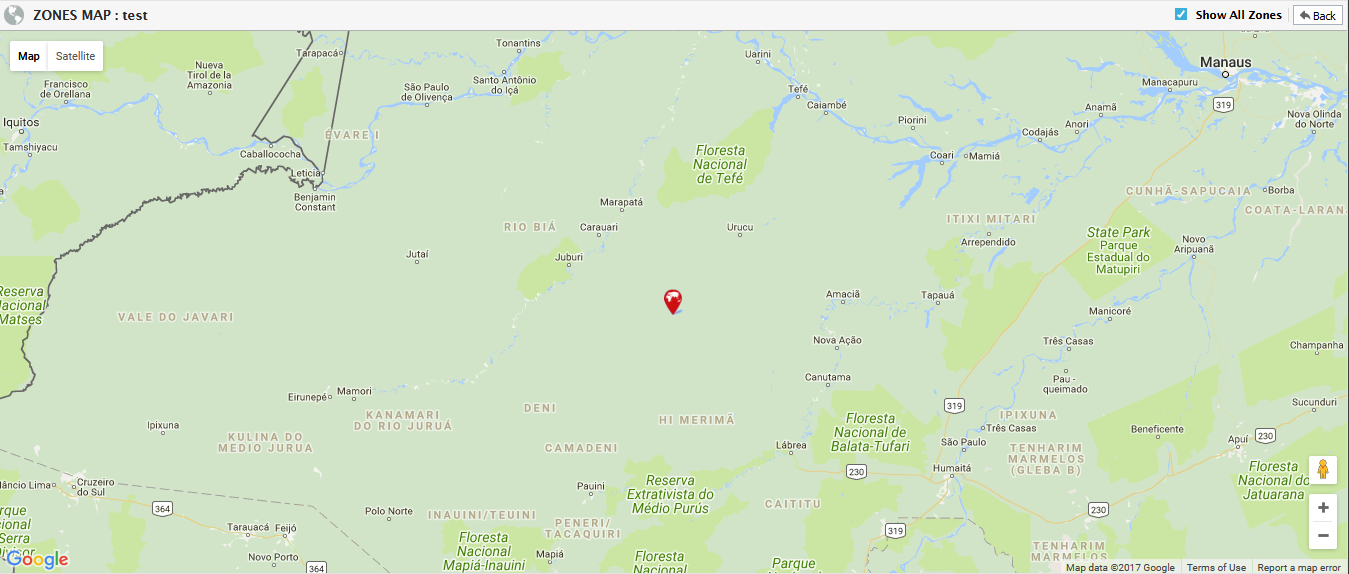
Figure 3 : Zooming into the location and state of the sub-zone within a zone
On the other hand, if you click on a zone without any sub-zones in the Zones list, then the corresponding Zone Dashboard will appear, providing an overview of the health of that zone.
To know the name of any zone displayed in the map, simply move your mouse pointer over the zone. The zone name will be displayed as indicated by Figure 3.
Besides updating you with the status of both parent zones and sub-zones, zone maps also enable you to zoom into the problems that are affecting the health of a zone, and swiftly identify the zone components that are responsible for the problem situation. For instance,Figure 2 indicates that quiet a few zones are in a Critical state. To know the reason for the abnormal state, simply click on a problem zone in Figure 2. A small window as shown in Figure 4 will then appear listing the problem components in the zone, and a brief description of the current problems. You can further drill down to the layer model, tests, and measurements of a problem component, by clicking on it. To focus on overall zone performance, click on the Dashboard link in the pop-up window; this will lead you to the Zone Dashboard, which will provide you with an overview of the health of that zone. If the zone clicked on comprises of sub-zones, then, a Subzone Map link is appended to the Dashboard link (see Figure 4). Clicking on the Subzone Map link allows you to zoom into the geographic location of the sub-zone that the zone contains and the current state of the sub-zone, as depicted by Figure 3. This also automatically expands the corresponding zone node in the ZONES list to display the names of the sub-zones.
Clicking on the sub-zone in the tree view (see Figure 4) leads you to that sub-zone’s dashboard, which reveals the overall health of the sub-zone.
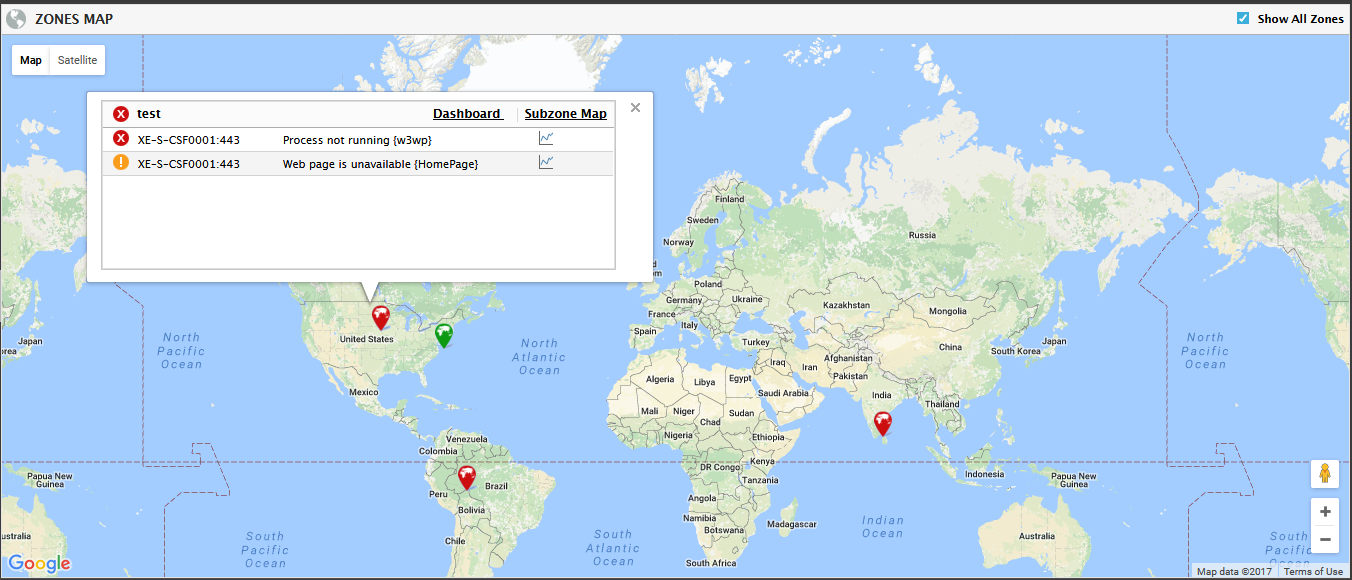
Figure 4 : Viewing the current list of problems in the zone
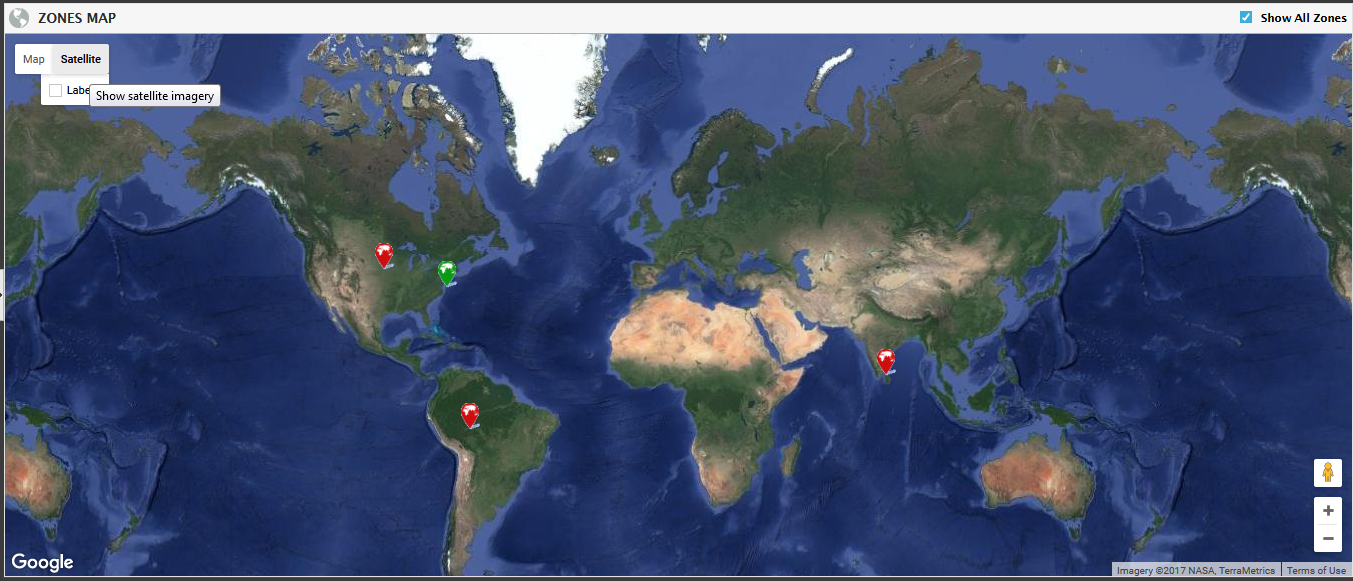
To enhance the visual appeal of your zone configurations, eG Enterprise offers multiple map views, namely - the normal Map view and a Satellite view. By default, selecting the Map option from the Zones menu invokes the Map view. To switch to a different view, say, the Satellite view, first, click on the Satellite button in Figure 4 which will take you to a satellite view, as depicted by Figure 5. The Satellite view is a mix of the satellite and map views. This is because the Labels check box that appears upon clicking the Satellite button is checked on by default. To view only the satellite view of the world, uncheck the Labels check box. Figure 6 then appears.
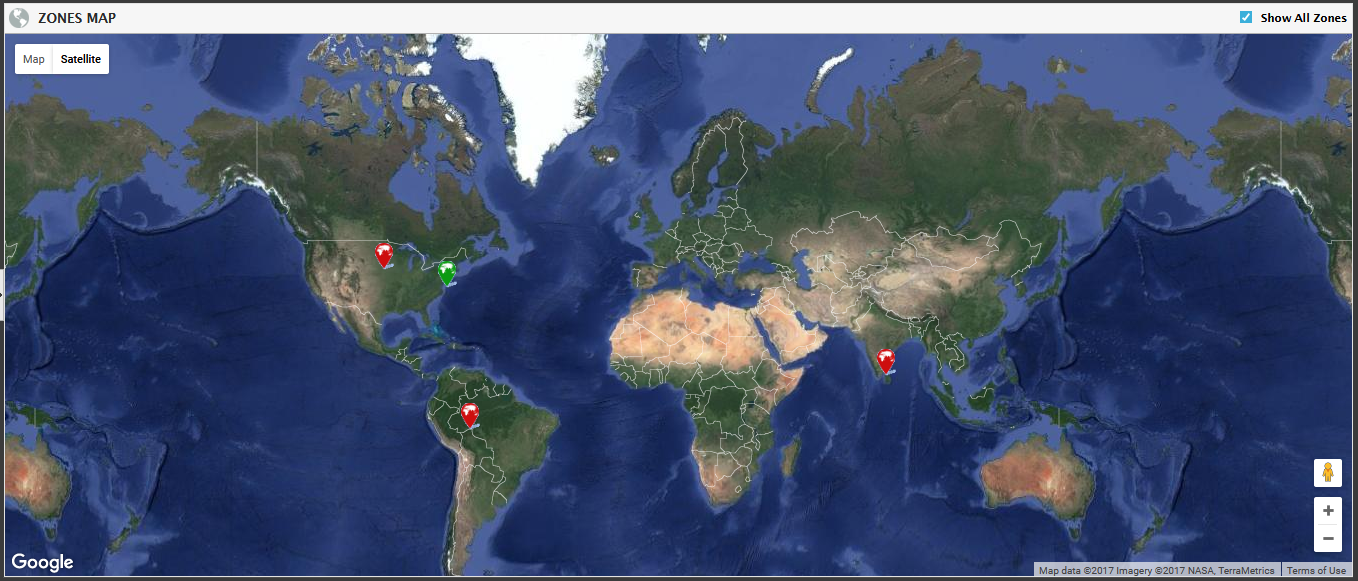
Figure 5 : The Satellite and Map view
Also, upon clicking within the map area, a range of control buttons become visible in the map interface, which will allow you to manipulate your zone view better. Use the person icon i.e., 'pegman' to move to the street view of the zone and the '+' and '-' buttons to zoom the map in and out, respectively.