Horizon Local Cluster/Pod Health Test
The Local Horizon Connection Server refers to the primary connection server in a Horizon Pod. This server is typically responsible for handling user connections, authentication, and session brokering within the local pod where it resides. The Local Horizon Connection Server manages requests from users connecting from within the same data center or geographical region. In a multi-pod setup, the Local Horizon Connection Server is the main point of contact for users accessing desktops or applications hosted in that specific pod.
If the Local Horizon Connection Server is not responding or is error-prone or if the endpoint of the connection server is not enabled, then, users may not be able to access the desktops or applications hosted in the Horizon pod. If this issue prolongs, then, the user experience may deteriorate drastically. To ensure satisfactory user experience, it is necessary to proactively track issues pertaining to the Local Horizon Connection Server. The Horizon Local Cluster/ Pod Health test helps administrators in this regard!
For each Local Horizon Connection server configured on the Omnissa Horizon Cluster/Pod, this test reports the status and also identifies whether/not the endpoint is enabled. Using this test, administrators can identify the type of certificate used by the connection server - is it the default certificate? or public certificate? In addition, this test also throws light on the status of backup taken from each connection server to the LDAP server.
Target of the test : An Omnissa Horizon Cluster/Pod
Agent deploying the test : A remote agent
Outputs of the test : One set of results for each Omnissa Horizon Connection Server configured on the Omnissa Horizon Cluster/Pod being monitored
| Parameter | Description |
|---|---|
|
Test Period |
How often should the test be executed. |
|
Host |
The host for which the test is to be configured. |
|
Port |
Refers to the port used by the target Omnissa Horizon Cluster/Pod. By default, this is set to NULL. |
|
Connection Server Name |
By default, this test connects to every Horizon Connection Server configured in the Omnissa Horizon Cluster/Pod remotely and collects the required metrics. For this, it is necessary to specify valid credentials of the Horizon Connection Servers. To help administrators provide these credentials quickly and easily, the eG administrative interface embeds a special configuration page. To access this page, simply click on the encircled '+' icon that appears alongside this parameter in the test configuration page. To know how to use this special page, refer to Configuring the Omnissa Horizon Connection Servers for Monitoring. |
|
User Name, Password and Confirm Password |
By default, this test uses Omnissa Restful APIs to collect the required metrics from the target Omnissa Horizon Cluster/Pod. For this, the eG agent should be configured with read-only user privileges that will allow the agent to communicate with the Horizon Connection Server in a particular domain and extract statistics. Therefore, specify the credentials of the user who is authorized to access the Horizon Connection Server against the User Name, Password and Confirm Password text boxes. |
|
Domain Name |
Specify the name of the domain to which the Horizon Connection Server belongs to. |
|
DD Frequency |
Refers to the frequency with which detailed diagnosis measures are to be generated for this test. The default is 1:1. This indicates that, by default, detailed measures will be generated every time this test runs, and also every time the test detects a problem. You can modify this frequency, if you so desire. Also, if you intend to disable the detailed diagnosis capability for this test, you can do so by specifying none against DD frequency. |
|
Detailed Diagnosis |
To make diagnosis more efficient and accurate, the eG Enterprise embeds an optional detailed diagnostic capability. With this capability, the eG agents can be configured to run detailed, more elaborate tests as and when specific problems are detected. To enable the detailed diagnosis capability of this test for a particular server, choose the On option. To disable the capability, click on the Off option. The option to selectively enable/disable the detailed diagnosis capability will be available only if the following conditions are fulfilled:
|
| Measurement | Description | Measurement Unit | Interpretation | ||||||||||||
|---|---|---|---|---|---|---|---|---|---|---|---|---|---|---|---|
|
Connection server status |
Indicates the status of this connection server. |
|
The values that this measure can take and its corresponding numeric values are discussed in the table below:
Note: By default, this measure reports the above-mentioned Measure Values to indicate the status of each connection server. However, the graph of this measure will represent the same using the numeric equivalents only i.e., 1 to 4. Use the detailed diagnosis of this measure to identify the version and build number of the connection server. |
||||||||||||
|
Is default certificate? |
Indicates whether/not the certificate of this connection server is the default certificate. |
|
The values that this measure can take and its corresponding numeric values are discussed in the table below:
Note: By default, this measure reports the above-mentioned Measure Values to indicate whether/not the certificate of each connection server is the default certificate. However, the graph of this measure will represent the same using the numeric equivalents only i.e., 0 or 1. |
||||||||||||
|
|
Indicates whether/not this connection server uses a |
|
The values that this measure can take and its corresponding numeric values are discussed in the table below:
Note: By default, this measure reports the above-mentioned Measure Values to indicate whether/not each connection server uses a public certificate. However, the graph of this measure will represent the same using the numeric equivalents only i.e., 0 or 1. Use the detailed diagnosis of this measure to figure out the Message that elaborates on the certificate. |
||||||||||||
|
TLS certificate expiry days |
Indicates the number of days that are left for the TLS certificate of this connection server to expire. |
|
The value of this measure is reported in terms of Years, Months, Days, Hours and Minutes. The detailed diagnosis of this measure lists the start date and end date of the TLS certificate upto which the certificate is valid. |
||||||||||||
|
Total connections |
Indicates the total number of connections established by this connection server. |
Number |
|
||||||||||||
|
Is endpoint enabled? |
Indicates whether/not an endpoint is enabled on this connection server. |
|
The values that this measure can take and its corresponding numeric values are discussed in the table below:
Note: By default, this measure reports the above-mentioned Measure Values to indicate whether/not an endpoint is enabled on each connection server. However, the graph of this measure will represent the same using the numeric equivalents only i.e., 0 or 1. |
||||||||||||
|
Active global desktop entitlements |
Indicates the number of global desktop entitlements that are active on this connection server. |
Number |
|
||||||||||||
|
Active global application entitlements |
Indicates the number of global application entitlements provisioned from this connection server. |
Number |
|
||||||||||||
|
LDAP backup status |
Indicates the current status of backup taken from this connection server to the LDAP server. |
|
The values that this measure can take and its corresponding numeric values are discussed in the table below:
Note: By default, this measure reports the above-mentioned Measure Values to indicate the current status of backup taken from each connection server to the LDAP server. However, the graph of this measure will represent the same using the numeric equivalents only i.e., 1 to 5. Use the detailed diagnosis of this measure to figure out further details on the backup frequency, location of the backup, maximum number of backups etc. |
||||||||||||
|
Is LDAP backup in progress? |
Indicates whether/not backup from this connection server is in progress to an LDAP server. |
|
The values that this measure can take and its corresponding numeric values are discussed in the table below:
Note: By default, this measure reports the above-mentioned Measure Values to whether/not backup from each connection server is in progress to an LDAP server. However, the graph of this measure will represent the same using the numeric equivalents only i.e., 0 or 1. |
The detailed diagnosis of the LDAP backup status measure lists further details on the backup frequency, location of the backup, maximum number of backups etc.
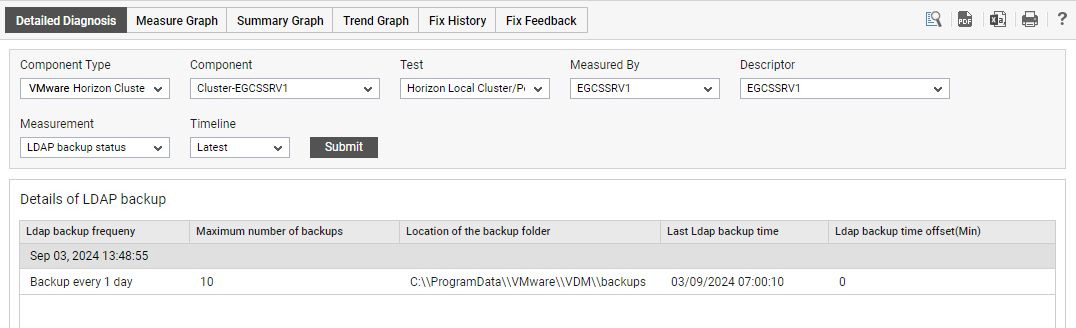
Figure 1 : The detailed diagnosis of the LDAP backup status measure