Oracle SQL Network Test
Using the JDBC API, this test reports the availability and responsiveness of the server, and collects statistics pertaining to the traffic into and out of the database server.
Note:
This test is applicable for Oracle Database with Multi-tenancy i.e., CDB(Container Database) and PDB (Pluggable Database) configuration.
Target of the test : An Oracle server
Agent deploying the test : An external agent; if you are running this test using the external agent on the eG manager box, then make sure that this external agent is able to communicate with the port on which the target Oracle server is listening. Alternatively, you can deploy the external agent that will be running this test on a host that can access the port on which the target Oracle server is listening.
Outputs of the test : One set of results for every SID (instance) monitored.
| Parameter | Description |
|---|---|
|
Test period |
How often should the test be executed |
|
Host |
The host for which the test is to be configured. |
|
Port |
The port on which the server is listening. |
|
Username |
In order to monitor an Oracle database server, a special database user account has to be created in every Oracle database instance that requires monitoring. A Click here hyperlink is available in the test configuration page, using which a new oracle database user can be created. Alternatively, you can manually create the special database user. When doing so, ensure that this user is vested with the select_catalog_role and create session privileges. The sample script we recommend for user creation (in Oracle database server versions before 12c) for eG monitoring is: create user oraeg identified by oraeg create role oratest; grant create session to oratest; grant select_catalog_role to oratest; grant oratest to oraeg; The sample script we recommend for user creation (in Oracle database server 12c) for eG monitoring is: alter session set container=<Oracle_service_name>; create user <user_name>identified by <user_password> container=current default tablespace <name_of_default_tablespace> temporary tablespace <name_of_temporary_tablespace>; Grant create session to <user_name>; Grant select_catalog_role to <user_name>; The name of this user has to be specified here. |
|
Password |
Specify the password of the specified database user. |
|
Confirm Password |
Confirm the Password by retyping it here. |
|
Query |
By default, this parameter is set to none. This implies that the eG agent monitors the responsiveness and availability of the database server based on the default query that has been hard-coded. However, sometimes, you may wish to monitor server's availability and responsiveness for a critical query of your choice. To achieve this, you can specify the critical query against this parameter by overriding the default value. Note that you can configure only a single SELECT query for this parameter. Note: To execute the SELECT query, the User should have the select privilege. |
|
Timeout |
Specify the duration (in seconds) beyond which the test will timeout if no response is received from the server. The default value is 30 seconds. |
|
IsPassive |
If the value chosen is Yes, then the Oracle server under consideration is a passive server in an Oracle cluster. No alerts will be generated if the server is not running. Measures will be reported as “Not applicable" by the agent if the server is not up. |
|
SSL |
By default, this flag is set to No, as the target Oracle database is not SSL-enabled by default. If the target database is SSL-enabled, then set this flag to Yes. |
|
SSL Cipher |
This parameter is applicable only if the target Oracle database is SSL-enabled, if not, set this parameter to none. A cipher suite is a set of cryptographic algorithms that are used before a client application and server exchange information over an SSL/TLS connection. It consist of sets of instructions on how to secure a network through SSL (Secure Sockets Layer) or TLS (Transport Layer Security). In this text box, provide a comma-seperated list of cipher suites that are allowed for SSL/TLS connection to the target database. By default, this parameter is set to none. |
|
Truststore File |
This parameter is applicable only if the target Oracle database is SSL-enabled, if not, set this parameter to none. TrustStore is used to store certificates from Certified Authorities (CA) that verify and authenticate the certificate presented by the server in an SSL connection. Therefore, the eG agent should have access to the truststore where the certificates are stored to authenticate and connect with the target database and collect metrics. For this, first import the certificates into the following default location <eG_INSTALL_DIR>/lib/security/mytruststore.jks. To know how to import the certificate into the truststore, refer toPre-requisites for monitoring Oracle Cluster. Then, provide the truststore file name in this text box. For example: mytruststore.jks. By default, none is specified against this text box. |
|
Truststore Type |
This parameter is applicable only if the target Oracle database is SSL-enabled, if not, set this parameter to none.Specify the type of truststore that contains the certificates for server authentication in this text box. For eg.,JKS. By default, this parameter is set to the value none. |
|
Truststore Password |
This parameter is applicable only if the target Oracle database is SSL-enabled, if not, set this parameter to none. If a Truststore File name is provided, then, in this text box, provide the password that is used to obtain the associated certificate details from the Truststore File. By default, this parameter is set to none. |
|
Keystore File |
This parameter is applicable only if the target Oracle database is SSL-enabled, if not, set this parameter to none. Keystore contains the private keys for the certificates that the client can provide to the server upon request. eG agent requires access to the keystore where client certificate is stored to send that to the server so that the server validates the certificate against the one contained in its trustore. For this purpose, first create the client certificate in the following default location /opt/egurkha/jre/lib/security/egmqsslstore.jks. |
|
Keystore Password |
This parameter is applicable only if the target Oracle database is SSL-enabled, if not, set this parameter to none. If a Keystore File name or file path is provided, then, in this text box, provide the password that is used to obtain the associated certificate details from the Keystore File. |
|
Confirm Password |
Confirm the Password for Keystore by retyping it here. |
|
DD Frequency |
Refers to the frequency with which detailed diagnosis measures are to be generated for this test. The default is 1:1. This indicates that, by default, detailed measures will be generated every time this test runs, and also every time the test detects a problem. You can modify this frequency, if you so desire. Also, if you intend to disable the detailed diagnosis capability for this test, you can do so by specifying none against DD frequency. |
| Measurement | Description | Measurement Unit | Interpretation |
|---|---|---|---|
|
Oracle server availability: |
Whether the database instance is responding to requests. |
Percent |
The availability is 100% when the instance is responding to a request and 0% when it is not. Availability problems may be caused by a misconfiguration/malfunctioning of the database instance, or because the instance is using an invalid user account. Besides the above, this measure will report that the server is unavailable even if a connection to the database instance is unavailable, or if a query to the database fails. In this case, you can check the values of the DB connection availability and Query processor availability measures to know what is exactly causing the database instance to not respond to requests - is it owing to a connection unavailability? or is it due to a query failure? Although included as part of the Oracle SQL Network test, this measure maps to the Oracle Service layer. |
|
Total response time: |
The time taken by the database to respond to a user query. This is the sum total of the connection time and query execution time. |
Secs |
A sudden increase in response time is indicative of a bottleneck at the database server. This could even be owing to a connection delay and/or long running queries to the database. Whenever the value of this measure is high, it would be good practice to compare the values of the Connection time and Query execution time measures to zero-in on the root-cause of the poor responsiveness of the server - is it because of connectivity issues? or is it because of inefficient queries? Although included as part of the Oracle SQL Network test, this measure maps to the Oracle Service layer. |
|
Data transmit rate: |
The rate of data being transmitted by the server in response to client requests. |
KB/Sec |
The data transmission rate reflects the workload on the server. |
|
Data receive rate: |
The rate of data received by the server from clients over SQL*Net. |
KB/Sec |
This measure also characterizes the workload on the server. As the data rate to a database server increases, consider tuning the Service Layer Data Buffer (SDU) and the Transport Layer Data Buffer (BDU) in the TNSNames.ora and Listener.ora files to optimize packet transfers across the network. |
|
DB connection availability: |
Indicates whether the database connection is available or not. |
Percent |
If this measure reports the value 100 , it indicates that the database connection is available. The value 0 on the other hand indicates that the database connection is unavailable. A connection to the database may be unavailable if the database is down or if the database is listening on a port other than the one configured for it in the eG manager or owing to a poor network link. If the Oracle server availability measure reports the value 0, then, you can check the value of this measure to determine whether/not it is due to the unavailability of a connection to the server. |
|
Query processor availability: |
Indicates whether the database query is executed successfully or not. |
Percent |
If this measure reports the value 100, it indicates that the query executed successfully. The value 0 on the other hand indicates that the query failed. In the event that the Oracle server availability measure reports the value 0, check the value of this measure to figure out whether the failed query is the reason why that measure reported a server unavailability. |
|
Connection time to database server: |
Indicates the time taken by the database connection. |
Secs |
A high value could indicate a connection bottleneck. Whenever the Total response time of the measure soars, you may want to check the value of this measure to determine whether a connection latency is causing the poor responsiveness of the server. |
|
Query execution time: |
Indicates the time taken for query execution. |
Secs |
A high value could indicate that one/more queries to the database are taking too long to execute. Inefficient/badly designed queries to the database often take too long to execute. If the value of this measure is higher than that of the Connection time measure, you can be rest assured that long running queries are causing the respond slowly to requests. |
|
Records fetched: |
Indicates the number of records fetched from the database. |
Number |
The value 0 indicates that no records are fetched from the database. |
The detailed diagnosis of the Total response time measure, if enabled, reveals the top ten resource consuming queries to the database. Resource consumption is reported in terms of disk reads, buffer gets, number of loads, execution cycles, rows processed, etc. Using this information, you can identify the non-optimal queries that could impact the database performance adversely (see Figure 1).
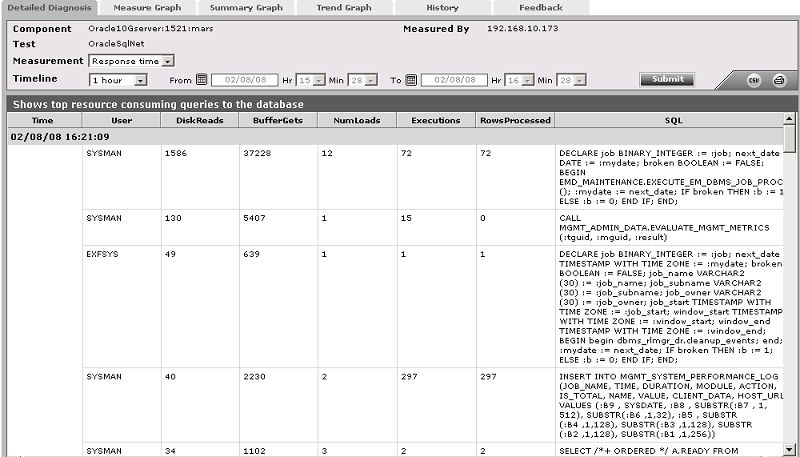
Figure 1 : Detailed diagnosis of the Response time measure displaying the top 10 resource consuming queries