RabbitMQ Cluster Workload Test
The workload of a RabbitMQ cluster is defined by the messages it receives from publishers and delivers to consumers, the connections, exchanges, and channels it handles, and the message read-write activity on its disk. Understanding the current workload of a cluster and measuring how well the cluster handles the workload is important to figure out if the cluster has been sized and configured right to perform well at peak load. The RabbitMQ Cluster Workload test enables administrators to gain this understanding.
This test tracks the messages published to and delivered by the cluster, measures the rate at which the cluster processes the messages, and thus reveals bottlenecks (if any) in message processing. Additionally, the test reports the count of connections, exchanges, and channels on the cluster, and also reports the level of I/O activity on the cluster disks. The test also reveals the count of unacknowledged and redelivered messages, and thus enables administrators evaluate how such messages may impact cluster performance. This way, the test helps administrators gauge the current workload on the cluster, understand the present processing power of the cluster, and thus figure out how the cluster size/configuration can be tweaked to enhance its processing ability.
Target of the test : A RabbitMQ Cluster
Agent deploying the test : A remote agent
Outputs of the test : One set of results for the monitored RabbitMQ Cluster
| Parameters | Description |
|---|---|
|
Test period |
How often should the test be executed |
|
Host |
The host for which the test is to be configured. |
|
Port |
The port at which the configured Host listens; by default, this is 15672 |
|
Username, Password, and Confirm Password |
The eG agent connects to the Management Interface of the rabbitmq-management plugin of the target node, and runs HTTP-based API commands on the node using the plugin to pull metrics of interest. To connect to the plugin and run the API commands, the eG agent requires the privileges of a user on the cluster who has been assigned the 'monitoring' tag. If such a user pre-exists, then configure this test with the Username and Password of that user. On the other hand, if no such user exists, then you will have to create a user for this purpose using the Management Interface. The steps for this have been detailed in How Does eG Enterprise Monitor a RabbitMQ Cluster?How Does eG Enterprise Monitor a RabbitMQ Cluster? In this case, make sure you configure this test with the Username and Password of the new user. Finally, confirm the password by retyping it in the Confirm Password text box. |
|
SSL |
By default, this flag is set to No, as the target node is not SSL-enabled by default. If the node is SSL-enabled, then set this flag to Yes. |
|
Detailed Diagnosis |
To make diagnosis more efficient and accurate, the eG Enterprise embeds an optional detailed diagnostic capability. With this capability, the eG agents can be configured to run detailed, more elaborate tests as and when specific problems are detected. To enable the detailed diagnosis capability of this test for a particular server, choose the On option. To disable the capability, click on the Off option. The option to selectively enable/disable the detailed diagnosis capability will be available only if the following conditions are fulfilled:
|
| Measurement | Description | Measurement Unit | Interpretation |
|---|---|---|---|
|
Ready messages |
Indicates the number of messages that are available to be delivered now. |
Number |
Use the detailed diagnosis of this measure to receive an overview of the RabbitMQ cluster setup. The RabbitMQ version, management version, and Erlang version will be displayed as part of the detailed diagnostics. |
|
Unacknowledged messages |
Indicates the number of messages for which the cluster is waiting for acknowledgement. |
Number |
A low value is desired for this measure. This is because, all unacknowledged messages have to reside in RAM on the servers. If you have too many unacknowledged messages you will run out of memory. An efficient way to limit unacknowledged messages is to limit how many messages your clients prefetch. To know which queue attached to which node in the cluster has the maximum number of unacknowledged messages, use the detailed diagnosis of this measure. |
|
Current messages |
Indicates the total number of messages on the cluster currently. |
Number |
This is the sum total of the value of the Ready messages and Unacknowledged messages. The value of this measure is a good indicator of the current message load on the cluster. |
|
Published message rate |
Indicates the rate at which publishers are publishing messages on the server. |
Messages/Sec |
|
|
Publisher confirmation rate |
Indicates the rate at which the cluster confirms the receipt of a message to a publisher. |
Messages/Sec |
A 'Publish Confirm' is nothing but a acknowledgement sent by the cluster to a publisher confirming the receipt of a message from that publisher. Publish Confirms have a performance impact. This means, the lower the value of this measure, the better. However, one should keep in mind that a Publish Confirm is required if the publisher needs at-least-once processing of messages. |
|
Manually acknowledged message delivery rate |
Indicates the rate at which messages are delivered to consumers that use manual acknowledgements. |
Messages/Sec |
Messages in transit might get lost in an event of a connection failure, and such a message might need to be retransmitted. Acknowledgements let the server and clients know when to retransmit messages. A manual acknowledgement is an 'explicit' acknowledgement that is received from the consumer. Manually sent acknowledgements can be positive or negative. Positive acknowledgements simply instruct RabbitMQ to record a message as delivered and can be discarded. Negative acknowledgements with basic.reject have the same effect. The difference is primarily in the semantics: positive acknowledgements assume a message was successfully processed while their negative counterpart suggests that a delivery wasn't processed but still should be deleted. Whether positive or negative, manual acknowledgements deliver low throughput and hence, should be avoided. A low value is therefore desired for this measure. |
|
Auto-acknowledged message delivery rate |
Indicates the rate at which messages are delivered to consumers that use automatic acknowledgements. |
Messages/Sec |
|
|
Consumer acknowledgement rate |
Indicates the rate at which messages are being acknowledged by consumers. |
Messages/Sec |
If the Delivery rate of messages requiring acknowledgement measure registers an abnormally low value, then, you may want to check the value of this measure at around the same time to determine whether the delay by consumers in acknowledging the messages was what caused the delivery delay. |
|
Message redelivery rate |
Indicates the rate at which messages with the 'redelivered' flag set are being delivered. |
Messages/Sec |
|
|
Delivery rate of messages requiring acknowledgement |
Indicates the rate at which messages requiring acknowledgement are being delivered in response to basic.get. |
Messages/Sec |
Compare the value of this measure with that of the Delivery rate of messages not requiring acknowledgement measure to figure out what type of messages are being delivered much slower than the rest. |
|
Delivery rate of messages not requiring acknowledgement |
Indicates the rate at which messages not requiring acknowledgement are being delivered in response to basic.get. |
Messages/Sec |
Compare the value of this measure with that of the Delivery rate of messages requiring acknowledgement measure to figure out what type of messages are being delivered much slower than the rest. |
|
Message return rate |
Indicates the rate at which unrouteable messages with 'mandatory' flag set to 'true', were sent to publishers. |
Messages/Sec |
An unroutable message is a message without a destination. For example, a message sent to an exchange without any bound queue. If the 'mandatory' flag is set to 'true', then the cluster return an unroutable message to the producer with a `basic.return` AMQP method. |
|
Disk read rate |
Indicates the rate at which queues read messages from disk. |
Messages/Sec |
A high value could indicate that messages are frequently read from the disk and not from the RAM. This could be owing to high memory pressure, which may have forced RabbitMQ to move messages from RAM to disk. |
|
Disk write rate |
Indicates the rate at which queues wrote messages to disk. |
Messages/Sec |
A high value for this measure could indicate any of the following:
|
|
Connections |
Indicates the number of connections for all virtual hosts that the current user has access to. |
Number |
Each connection uses about 100 KB of RAM (and even more, if TLS is used). Which means, if the value of Connections measure is over 1000, it can be a heavy burden on a RabbitMQ server. In the worst case, the server can crash due to out-of-memory. The AMQP protocol has a mechanism called channels that “multiplexes” a single TCP connection. It’s recommended that each process only creates one TCP connection, and uses multiple channels in that connection for different threads. Its also recommended that both connections and channels are kept at a minimum. This is because, an unusually high value for the Connections and the Channels measures can adversely impact the performance of the RabbitMQ management interface. |
|
Channels |
Indicates the total number of channels for all virtual hosts the current user has access to. |
Number |
|
|
Exchanges |
Indicates the total number of exchanges for all virtual hosts the current user has access to. |
Number |
An exchange is responsible for the routing of the messages to the different queues. An exchange accepts messages from the producer application and routes them to message queues with the help of bindings and routing keys. |
|
Queues |
Indicates the total number of queues for all virtual hosts the current user has access to. |
Number |
A queue is a buffer that stores messages. Messages are published to exchanges, which distribute them to queues using rules called bindings. Queues are single-threaded in RabbitMQ, and one queue can handle up to about 50k messages/s. You will achieve better throughput on a multi-core system if you have multiple queues and consumers. You will achieve optimal throughput if you have as many queues as cores on the underlying node(s). This means, ideally, the value of this measure should be equal to the number of cores on the monitored node. If the value of this measure is over 1000, it is a cause for concern. This is because, the RabbitMQ management interface will keep information about all queues and this might slow down the server. The CPU and RAM usage may also be affected in a negative way if you have too many queues (thousands of queues). The RabbitMQ management interface collects and calculates metrics for each and every queue which uses some resources and CPU and disk contention can occur if you have thousands up on thousands of active queues and consumers. |
|
Consumers |
Indicates the total number of consumers for all virtual hosts the current user has access to. |
Number |
A consumer is a user application that receives messages. You will achieve better throughput on a multi-core system if the value of this measure is more than one. However, if there are a large number of consumers, CPU and disk contention can occur on the RabbitMQ management interface. |
|
Published messages |
Indicates the total number of messages entering the server. |
Number |
|
|
Publisher confirmed messages |
Indicates the total number of messages that the server is confirming to publisher. |
Number |
A 'Publish Confirm' is nothing but a acknowledgement sent by the cluster to a publisher confirming the receipt of a message from that publisher. Publish Confirms have a performance impact. This means, the lower the value of this measure, the better. However, one should keep in mind that a Publish Confirm is required if the publisher needs at-least-once processing of messages. |
|
Messages delivered with manual acknowledgement |
Indicates the total number of messages that this virtual host delivered to consumers that use manual acknowledgements. |
Number |
Messages in transit might get lost in an event of a connection failure, and such a message might need to be retransmitted. Acknowledgements let the server and clients know when to retransmit messages. A manual acknowledgement is an 'explicit' acknowledgement that is received from the consumer. Manually sent acknowledgements can be positive or negative. Positive acknowledgements simply instruct RabbitMQ to record a message as delivered and can be discarded. Negative acknowledgements with basic.reject have the same effect. The difference is primarily in the semantics: positive acknowledgements assume a message was successfully processed while their negative counterpart suggests that a delivery wasn't processed but still should be deleted. Whether positive or negative, manual acknowledgements deliver low throughput and hence, should be avoided. A low value is therefore desired for this measure. |
|
Messages delivered with auto-acknowledgement |
Indicates the total number of messages that this virtual host delivered to consumers that use automatic acknowledgements. |
Number |
In automatic acknowledgement mode, a message is considered to be successfully delivered immediately after it is sent. This mode trades off higher throughput (as long as the consumers can keep up) for reduced safety of delivery and consumer processing. This mode is often referred to as "fire-and-forget". Unlike with manual acknowledgement model, if consumers's TCP connection or channel is closed before successful delivery, the message sent by the server will be lost. Therefore, automatic message acknowledgement should be considered unsafe and not suitable for all workloads. The value 0 is hence ideal for this measure. |
|
Messages delivered with consumer acknowledgement |
Indicates the total number of messages that are being acknowledged by consumers of this virtual host. |
Number |
|
|
Redelivered messages |
Indicates the total number of messages that are being delivered by this virtual host, with the 'redelivered' flag set. |
Number |
If a message is delivered to a consumer and then requeued (because it was not acknowledged before the consumer connection dropped, for example) then RabbitMQ will set the 'redelivered' flag on it when it is delivered again (whether to the same consumer or a different one). This is a hint that a consumer may have seen this message before (although that's not guaranteed, the message may have made it out of the broker but not into a consumer before the connection dropped). Conversely if the redelivered flag is not set then it is guaranteed that the message has not been seen before. |
|
Messages requiring acknowledgements |
Indicates the total number of messages requiring acknowledgement that are being delivered in response to basic.get . |
Number |
For best performance and high throughput, the value of this measure should be low. |
|
Messages not requiring acknowledgements |
Indicates the total number of messages not requiring acknowledgement that are being delivered in response to basic.get on this virtual host. |
Number |
|
|
Messages returned |
Indicates the rate at which this virtual host sent unrouteable messages with 'mandatory' flag set to 'true', to publishers . |
Messages/Sec |
An unroutable message is a message without a destination. For example, a message sent to an exchange without any bound queue. If the 'mandatory' flag is set to 'true', then an unroutable message is returned to the producer with a `basic.return` AMQP method. To know which nodes in the cluster returned the maximum number of messages to publishers, use the detailed diagnosis of this measure. |
|
Disk reads |
Indicates the total number of messages read from disk on this virtual host. |
Number |
A high value could indicate that many messages are read from the disk and not from the RAM. This could be owing to high memory pressure, which may have forced RabbitMQ to move messages from RAM to disk. If this measure reports an abnormally high value, then use the detailed diagnosis of this measure to know which nodes in the cluster are performing the maximum reads from the disk. Such nodes could be running out of memory. |
|
Disk writes |
Indicates the total number of messages written to disk on this virtual host. |
Number |
A high value for this measure could indicate any of the following:
If this measure reports an abnormally high value, then use the detailed diagnosis of this measure to know which nodes in the cluster are performing the maximum reads from the disk. Such nodes could be running out of memory. |
To know which queue attached to which node in the cluster has the maximum number of unacknowledged messages, use the detailed diagnosis of the Unacknowledged messages measure. The state of the queue is also revealed as part of detailed diagnostics. If your cluster is running out of memory, you can use the detailed statistics to identify which queue attached to which node is draining the memory by holding many unacknowledged messages.
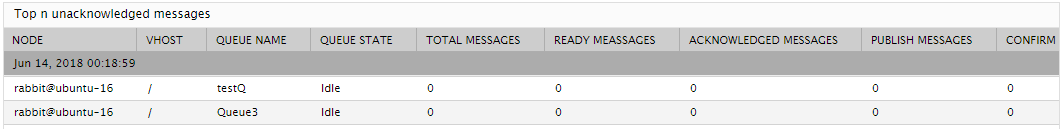
Figure 1 : The detailed diagnosis of the Unacknowledged messages measure
To know which nodes in the cluster returned the maximum number of messages to publishers, use the detailed diagnosis of the Messages returned measure.
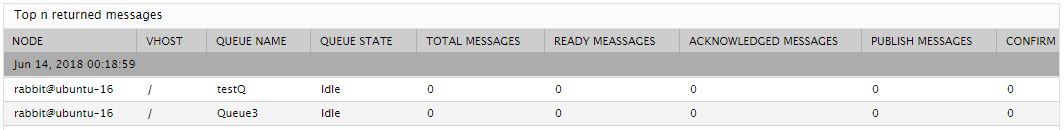
Figure 2 : The detailed diagnosis of the Messages returned measure
Using the detailed diagnosis of the Disk reads and Disk writes measures, you can easily identify the exact node in the cluster that is performing many reads from the disk and/or numerous writes to the disk. Excessive read-write activity on disk is a sign of a memory contention in the cluster. Under such circumstances, you can use the detailed diagnostics to identify the node and the queue that could be contributing to the contention.
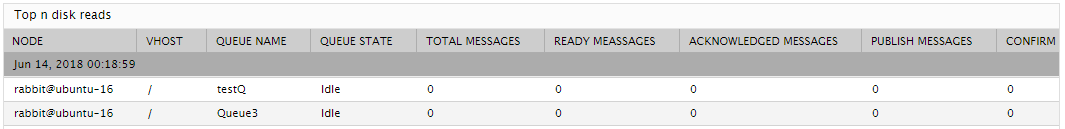
Figure 3 : The detailed diagnosis of the Disk reads measure
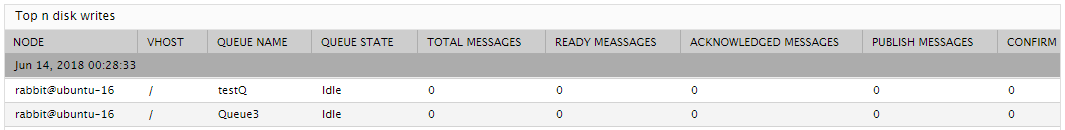
Figure 4 : The detailed diagnosis of the Disk writes measure