
Viewing the Performance Attribute Tree
The Performance Attribute tree (see Figure 1) discussed earlier in this chapter allowed you to view all the performance attributes that are associated with a specific monitor only. However, if you are looking for a more flexible interface, which allows you to choose from all monitor sets configured for a SAP ABAP instance, pick one/more monitors of interest to you, and view all the attributes associated with all chosen monitors, then, you will have to use the metrics page (see Figure 1) offered by the eG monitoring console. To access this page, follow the Components -> SAP -> Metrics menu sequence.
To use this page, do the following:
- Select the SAP ABAP Component of interest to you.
- All the Monitor Sets configured for the chosen server will then populate the Monitor Sets list. Pick a monitor set from this list.
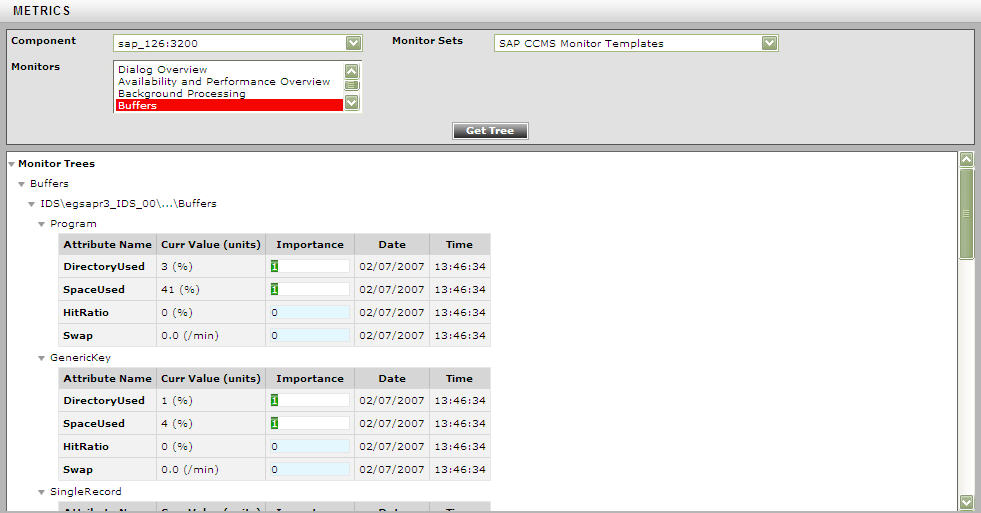
- The Monitors list will then display all the monitors associated with the chosen Monitor Set. Select one/more monitors from this list, and click the Get Tree button.
An attribute tree providing the details of all the attributes of the chosen monitors will then appear, as depicted by Figure 1 above. Within the tree, the Performance attributes will be displayed in a tabular format. The table contains an entry for each Performance attribute exposed by the monitoring object with details such as the Attribute Name, Current Value of the attribute (with units), Importance and the actual Timestamp of the Current Value shown. The Importance value is a combination of the status and severity of the most significant active alert associated with this Performance attribute. The Status of this performance attribute is represented using a unique color code. The severity of a given status is indicated by a number between 0 and 255, with higher severity values being more important than the lower ones.
