Performance Attributes for Monitors Test
A monitoring object represents a component of the IT environment that is to be monitored, such as the CPU of a server, the dialog system, or background processing. Monitoring attributes are values, statuses, or texts that are reported to this object, such as the CPU utilization, or the average response time in the dialog system. A monitoring attribute can be assigned an alert. The selection of the monitoring objects is performed using the data suppliers that exist for all areas of system management.
Monitoring objects and their attributes are displayed in the alert monitoring tree as individual nodes in a hierarchical tree. If the data reported to the monitoring architecture exceeds or falls below the defined alert threshold values, an alert is triggered in the corresponding monitoring tree element.
There are five different types of monitoring attributes:
- Performance attribute
- Status attribute
- Heartbeat attribute
- Log attribute
- Text attribute
The Performance attribute collects and averages performance values that have been reported to the monitoring architecture. If these values violate the set threshold values, an alert is generated.
To know the count of performance attributes associated with specific monitors, and to instantly isolate attributes on which alerts were generated, use the Performance Attributes in Monitors test.
This test is disabled by default. To enable the test, go to the enable / disable tests page using the menu sequence : Agents -> Tests -> Enable/Disable, pick SAP ABAP the desired Component type, set Performance as the Test type, choose the test from the disabled tests list, and click on the < button to move the test to the ENABLED TESTS list. Finally, click the Update button.
Target of the test : A SAP ABAP instance
Agent deploying the test : An internal/remote agent
Outputs of the test : One set of results for every configured Monitor.
| Parameter | Description |
|
Test Period |
How often should the test be executed. |
|
Host |
Host name of the server for which the test is to be configured. |
|
PortNo |
Enter the port to which the specified host listens. |
|
ClientName |
Specify the ID of the client system as what the eG agent will be connecting to the SAP ABAP instance. To know how to determine the client ID to use, follow the instructions provided in Determining the Client ID/Name for the eG Agent to Connect to the SAP ABAP Instance. |
|
SAPUser |
Typically, to connect to a SAP ABAP instance and run tests, the eG agent requires the permissions of a SAP user who has been assigned |
|
Password |
The password of the specified SAPUser. |
|
Confirm Password |
Confirm the password by retyping it here. |
|
SysNo |
This parameter appears only if the Use SAPControl flag is set to No – i.e., if the test uses SAPJCO to collect measures. An indicator of the TCP/IP port at which the SAP server listens. For example, for a server that listens at port 3200, the SysNo will be ‘00’. Similarly, if the SAP server port is 3201, the SysNo will have to be specified as ‘01’. Therefore, in the SysNo text box specify the system number of the SAP server with which the specified client communicates. To know the system number for the ABAP server being monitored, follow the procedure detailed in Identifying the SAP Router String and System Number. |
|
Router |
This parameter appears only if the Use SAPControl flag is set to No – i.e., if the test uses SAPJCO to collect measures. If the SAP client with the specified ClientName exists in a network external to the SAP server, then a router will be used to enable the server-client communication. In such a case, specify the router string of the router in the Router text box. If both the client and the server exist in the same network, then specify ‘none’ against the Router text box. To know what is the SAP Router string for the ABAP server being monitored, follow the procedure detailed in Identifying the SAP Router String and System Number. |
|
InstanceName |
This parameter appears only if the Use SAPControl flag is set to No – i.e., if the test uses SAPJCO to collect measures. This is set to none by default. This implies that the eG agent automatically discovers the instance name at run time. |
|
Timeout |
Indicate the duration (in seconds) for which this test should wait for a response from the SAP ABAP instance. By default, this is set to 120 seconds. |
|
JCO Version |
The eG agent uses the SAP JCO library to connect to the SAP ABAP system and pull out metrics. To enable the eG agent to make this connection and query the metrics, you need to specify the version of the SAP JCO library that the agent needs to use. For instance, to instruct the eG agent to use JCO v2.1.19, it would suffice if you specify the ‘major version number’ alone against JCO Version – in the case of this example, this will be 2.x. Note that if you have downloaded the SAP JCO CONNECTOR files for SAP JCO version 3 from the SAP market place (as instructed by Downloading the SAP JCO Connector files Required for Monitoring ), then the JCO Version configuration should be 3.x. |
|
Sets |
Provide a comma-separated list of monitor sets for which performance attributes are to be monitored. For example: SAP CCMS Monitor Templates,Monitor Collection for Certification |
|
Monitors |
Provide a comma-separated list of monitors under the configured monitor Sets for which performance attributes are to be monitored. While specifying the list of Monitors, make sure that you specify them in the same order as that of your monitor sets specification. For instance, the first monitor in your Monitors list should belong to the first monitor set in your Sets specification, and so on. This implies that if your Sets specification reads as follows - SAP CCMS Monitor Templates,Monitor Collection for Certification- then the first monitor in your Monitors specification should belong to the SAP CCMS Monitor Templates set and the second monitor should belong to the Monitor Collection for Certification set. In this case, your Monitors specification may read as follows: Dialog Overview,Test Monitor Syslog. If you want to include more than one monitor from a particular monitor set in your Monitors specification, then make sure that you repeat that monitor set’s name as many times in your sets specification. While configuring the Sets and Monitors, you may want to know the exact names of the monitors and monitor sets that form part of your specification. To determine this, follow the procedure discussed in Page While configuring the monitor details, you may want to know the exact names of the monitors and monitor sets that form part of your specification. To determine this, do the following: . |
|
XMI Audit Level |
The XMI interface is a general framework for the CCMS external system management interfaces. This interface contains essential function modules and structures that coordinate connections between external system management tools and individual CCMS interfaces, and writes messages in the SAP ABAP XMI log on behalf of the external tool. The XMI log is a table containing English message texts. The messages can have various degrees of detail. The audit level determines the degree of detail to which messages in the XMI log are written - i.e., whether the message should always be logged, or is simply a message which supplies further detail (higher detail degree). The XMI log contains messages from external tools and also messages which arise in SMAPI functions. To indicate to the test the degree of detail to which messages from the eG agent are to be written in the XMI log, you need to specify the XMI Audit Level. By default, this parameter is set to 0, which indicates that all calls that modify the database are to be logged. The other values this parameter can take and their implications are discussed below:
|
|
Detailed Diagnosis |
To make diagnosis more efficient and accurate, the eG Enterprise embeds an optional detailed diagnostic capability. With this capability, the eG agents can be configured to run detailed, more elaborate tests as and when specific problems are detected. To enable the detailed diagnosis capability of this test for a particular server, choose the On option. To disable the capability, click on the Off option. The option to selectively enable/disable the detailed diagnosis capability will be available only if the following conditions are fulfilled:
|
| Measurement | Description | Measurement Unit | Interpretation |
|---|---|---|---|
|
Total number of performance attributes |
Indicates the total number of Performance attributes available for this monitor. |
Number |
A monitoring tree depicts the hierarchy of monitoring objects within a monitor and the various attributes exposed by the monitoring objects. The monitoring tree depicted by the detailed diagnosis page of this measure shows only the Performance attributes within the monitoring objects. Within the tree, the Performance attributes are indicated in a tabular format. The table contains an entry for each Performance attribute exposed by the monitoring object with details such as the Attribute Name, Current Value of the attribute (with units), Importance and the actual Timestamp of the Current Value shown. The Importance value is a combination of the status and severity of the most significant active alert associated with this Performance attribute. The Status of this performance attribute is represented using the unique color code as mentioned above. The severity of a given status is indicated by a number between 0 and 255, with higher severity values being more important than the lower ones. The monitoring tree is identical to the alert monitoring tree in SAP CCMS Alert Monitor and its individual nodes can be expanded and contracted. |
|
Number of red performance attributes |
Indicates the number of errors or critical status messages that have been issued for this monitor. |
Number |
A high value for this measure indicates that too many performance attributes of a given monitor have encountered critical errors. To view these performance attributes, use the Alerts page that appears when the Components -> SAP -> Alerts menu sequence is followed in the eG monitoring console. |
|
Number of yellow performance attributes |
Indicates the number of warning messages that have been issued for this monitor. |
Number |
A high value for this measure indicates that too many performance attributes of a given monitor have encountered warnings. To view these performance attributes, use the Alerts page that appears when the Components -> SAP -> Alerts menu sequence is followed in the eG monitoring console. |
|
Number of green performance attributes |
Indicates the number of successful events for this monitor. |
Number |
|
|
Number of inactive performance attributes |
Indicates the number of Performance attributes for this monitor that currently do not have any data. |
Number |
|
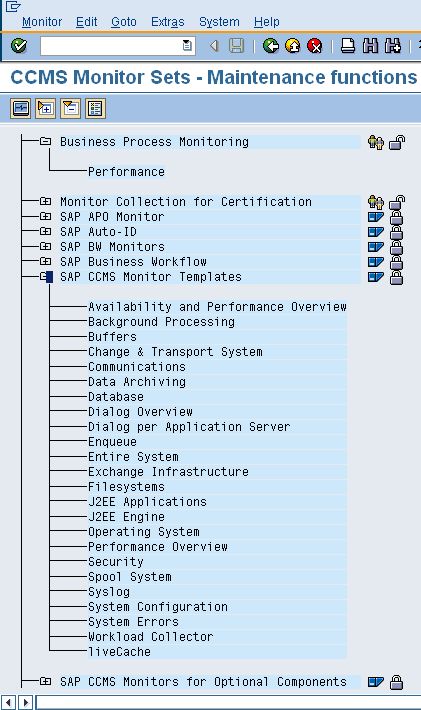
The monitoring tree depicted by the detailed diagnosis page of the Total number of performance attributes measure shows only the Performance attributes within the monitoring objects. Within the tree, the Performance attributes are indicated in a tabular format. The table contains an entry for each Performance attribute exposed by the monitoring object with details such as the Attribute Name, Current Value of the attribute (with units), Importance and the actual Timestamp of the Current Value shown. The Importance value is a combination of the status and severity of the most significant active alert associated with this Performance attribute. The Status of this performance attribute is represented using the unique color code as mentioned above. The severity of a given status is indicated by a number between 0 and 255, with higher severity values being more important than the lower ones.
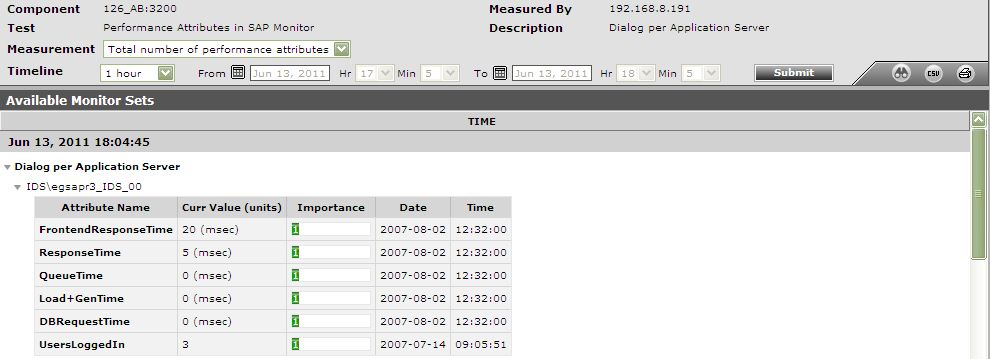
Figure 1 : The detailed diagnosis of the Total number of performance attributes measure
While configuring the monitor details, you may want to know the exact names of the monitors and monitor sets that form part of your specification. To determine this, do the following:
- Open the SAP Logon tool using the Start -> Programs -> SAP Front End -> SAP Logon menu sequence.
-
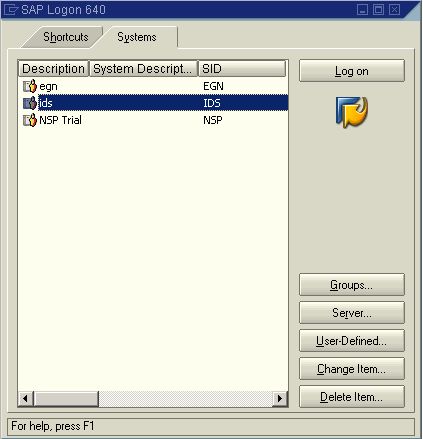
Pick a system from Figure 2 that appears, and click on the Logon button therein to connect to the chosen system.
-
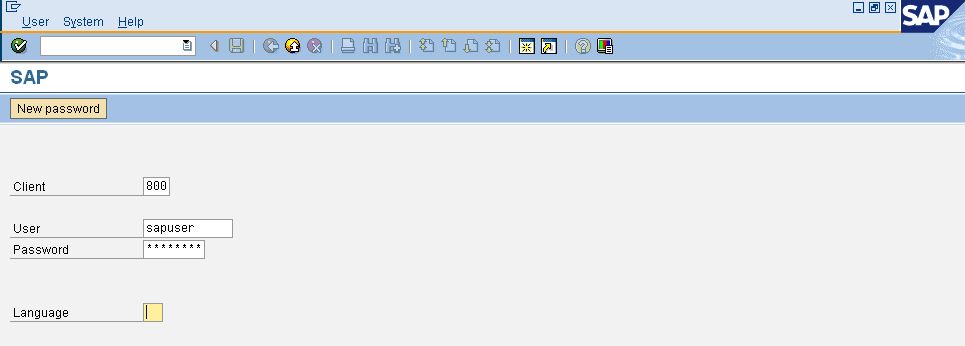
Then, login to the chosen system by providing the required Client, User, and Password credentials. Once the Password is provided, press the Enter key on your keyboard to login (see Figure 3).
-
Upon logging in successfully, the SAP Easy Access interface will appear (see Figure 4). In the tree-structure in the left panel of the interface, follow the node sequence, SAP Menu -> Tools -> CCMS -> Control/Monitoring. Then, double-click on the RZ20-CCMS Monitor Sets sub-node under the Control/Monitoring node.
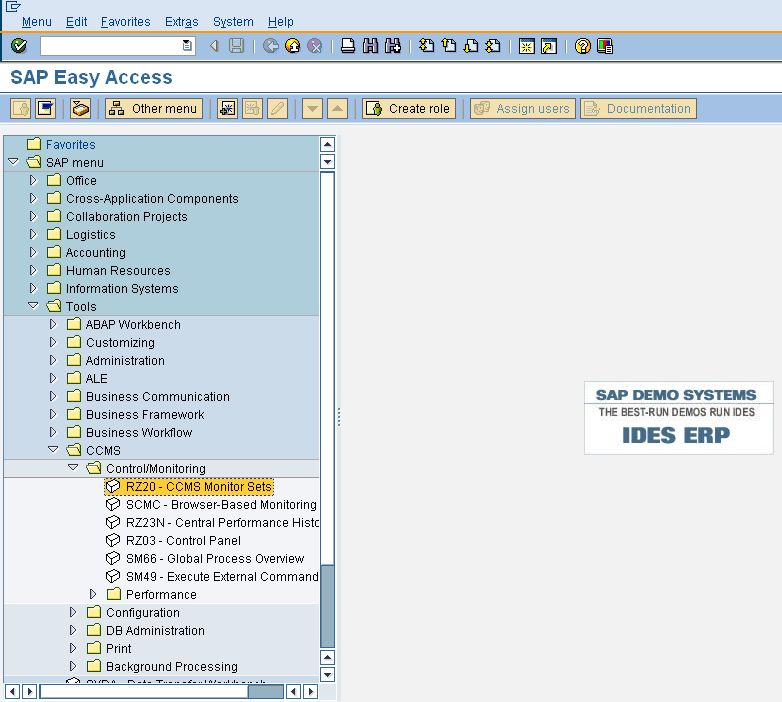
Figure 4 : Double-clicking on the CCMS Monitor Sets sub-node
-
This will invoke Figure 5, where the complete list of monitor sets will be displayed. Expand a monitor set to view the monitors within. Use these details to configure the monitor set:monitors in the monitor details text box.