BW Workbooks Test
SAP BW Workbooks are simple Excel sheets customized with SAP BW queries. Formatted reports can be created with the help of SAP BW workbooks, as they allow administrators to change the way reports look. Apart from just formatting, administrators can also have Excel calculations. Multiple queries can be inserted in a single workbook which can be used for further analysis. A default workbook is provided to create reports with very less formatting work.
If the workbooks do not execute faster or if the queries executing on the workbooks fail, then the data could not be retrieved and generated for the target SAP Business Warehouse instance. To proactively figure out the workbooks that are taking too long to execute, administrators can use the BW Workbooks test.
This test auto-discovers the workbooks created on the target SAP Business Warehouse instance and for each workbook, this test reports the number of sessions that initiated the workbook. In addition, this test reports the number of times each workbook was executed and the time taken by each workbook for execution. Using this test, administrators can figure out the workbook that is the slowest to execute. The detailed diagnostics of this test provides in depth insights into the exact query / execution that was the reason behind the workbooks being slow to execute.
Target of the test : A SAP Business Warehouse Instance
Agent deploying the test : An internal agent
Outputs of the test : One set of results for each workbook created on the target SAP Business Warehouse Instance being monitored.
| Parameter | Description |
|
Test Period |
How often should the test be executed |
|
Host |
Host name of the server for which the test is to be configured. |
|
Port |
Enter the port at which the specified host listens. |
|
ClientName |
Specify the ID of the client system as what the eG agent will be connecting to the SAP ABAP instance. To know how to determine the client ID to use, follow the instructions provided in Determining the Client ID/Name for the eG Agent to Connect to the SAP ABAP Instance. |
|
SAPUser |
Typically, to connect to a SAP ABAP instance and run tests, the eG agent requires the permissions of a SAP user who has been assigned |
|
Password |
The password of the specified SAPUser. |
|
Confirm Password |
Confirm the password by retyping it here. |
|
SysNo |
An indicator of the TCP/IP port at which the SAP server listens. For example, for a server that listens at port 3200, the SysNo will be ‘00’. Similarly, if the SAP server port is 3201, the SysNo will have to be specified as ‘01’. Therefore, in the SysNo text box, specify the system number of the SAP server with which the specified client communicates. To know the system number for the ABAP server being monitored, follow the procedure detailed in Identifying the SAP Router String and System Number. |
|
Router |
If the SAP client with the specified ClientName exists in a network external to the SAP server, then a router will be used to enable the server-client communication. In such a case, specify the router string of the router in the Router text box. If both the client and the server exist in the same network, then specify ‘none’ against the Router text box. To know what is the SAP Router string for the ABAP server being monitored, follow the procedure detailed in Identifying the SAP Router String and System Number. |
|
InstanceName |
This is set to default by default. This implies that the eG agent automatically discovers the instance name at run time. |
|
Timeout |
Indicate the duration (in seconds) for which this test should wait for a response from the SAP Business Warehouse Instance. By default, this is set to 120 seconds. |
|
JCO Version |
The eG agent uses the SAP JCO library to connect to the SAP ABAP system and pull out metrics. To enable the eG agent to make this connection and query the metrics, you need to specify the version of the SAP JCO library that the agent needs to use. For instance, to instruct the eG agent to use JCO v2.1.19, it would suffice if you specify the ‘major version number’ alone against JCO Version – in the case of this example, this will be 2.x. Note that if you have downloaded the SAP JCO CONNECTOR files for SAP JCO version 3 from the SAP market place (as instructed by Downloading the SAP JCO Connector files Required for Monitoring ), then the JCO Version configuration should be 3.x. |
|
Event Window |
By default, the BW events related to BW objects such as queries, templates and workbooks will be stored in an event table within the target SAP Business Warehouse Instance. An event record may be logged in the event table upon execution of the query on the workbook either immediately or with a time delay. When the event record is logged with a time delay, eG Enterprise may sometimes miss the event completely from the scope of monitoring. This is because, the event record will display the time stamp at which the event was logged rather than the time stamp at which the event actually started. To ensure that all the events related to the workbooks are monitored, administrators can use the Event Window parameter. By default, this is set to 90 minutes indicating that the eG agent will look for the event records in the last 90 minutes and fetch the relevant metrics. This will ensure that the events related to the workbooks are monitored round the clock without a miss! |
|
DD Frequency |
Refers to the frequency with which detailed diagnosis measures are to be generated for this test. The default is 1:1. This indicates that, by default, detailed measures will be generated every time this test runs, and also every time the test detects a problem. You can modify this frequency, if you so desire. Also, if you intend to disable the detailed diagnosis capability for this test, you can do so by specifying none against DD frequency. |
|
Detailed Diagnosis |
To make diagnosis more efficient and accurate, the eG Enterprise embeds an optional detailed diagnostic capability. With this capability, the eG agents can be configured to run detailed, more elaborate tests as and when specific problems are detected. To enable the detailed diagnosis capability of this test for a particular server, choose the On option. To disable the capability, click on the Off option. The option to selectively enable/disable the detailed diagnosis capability will be available only if the following conditions are fulfilled:
|
| Measurement | Description | Measurement Unit | Interpretation |
|---|---|---|---|
|
Sessions |
Indicates the number of sessions in which this workbook was initiated during the last measurement period. |
Number |
A high value for this measure is a indication that the workbook is highly in demand. This may in turn cause the workbook to load slower than usual. |
|
Steps |
Indicates the number of steps that were executed from this workbook during the last measurement period. |
Number |
A high value for this measure may result in the slowness of the workbook. |
|
Executions |
Indicates the number of times this workbook was executed during the last measurement period. |
Number |
This measure is a good indicator of load on the SAP Business Warehouse Instance. Compare the value of this measure across workbooks to figure out the workbook that is executed more frequently. |
|
Execution rate |
Indicates rate at which this workbook was executed during the last measurement period. |
Execution/min |
|
|
Response time |
Indicates time taken by this workbook to complete an execution. |
Seconds/execution |
Compare the value of this measure across workbooks to figure out the workbook that is the slowest in terms of execution. Use the detailed diagnosis of this measure to figure out the executions that were the slowest for each workbook. The detailed diagnosis of this measure lists the name of the user, Start time, Info provider, Response time, Loading or Generating time, Query time, Serialize Deserialize time, Read time, Front end transfer time, Processing time, Rendering time, Other event time, Queries, OLAP time, Data manager time, Session ID, Step ID, Handle ID and Object properties. |
|
Loading or generation time |
Indicates the time taken to load/generate this workbook upon an execution. |
Seconds/execution |
A low value indicates that the workbook is loading faster. Compare the value of this measure across workbooks to figure out the workbook that is the slowest to load upon execution. |
|
Query time |
Indicates the time taken to execute the query from this workbook during the last measurement period. |
Seconds/execution |
A high value for this measure indicates that the query is problematic and needs optimization.
|
|
Serialize and deserialize time |
Indicates the time taken by this workbook to serialize and deserialize the result set that is obtained upon an execution. |
Seconds/execution |
|
|
Read time |
Indicates the average time taken by this workbook to read the data from the query result set and covert it to a flat format. |
Seconds/execution |
|
|
Front end transfer time |
Indicates the time taken by this workbook to transfer data to the front end (for e.g., web reports) upon an execution. |
Seconds/execution |
The value of this measure is a sum of time taken to transfer text from server to front end system, transfer system information to front end, transfer currencies and conversion types to front end and transfer themes to front end. |
|
Processing time |
Indicates the time taken by this workbook to process a general command/dialog upon an execution. |
Seconds/execution |
|
|
Rendering time |
Indicates the time taken by this workbook to pull the data and render the data to the excel file upon execution. |
Seconds/execution |
|
|
Queries |
Indicates the number of queries executed on this workbook upon an execution request. |
Queries/execution |
Use the detailed diagnosis of this measure to figure out the queries that are the slowest to execute on each workbook. For each workbook, the detailed diagnosis of this measure lists the name of the query, user executing the query, Info provider, Start time, Selected records, Transported records, Response time, OLAP time, OLAP cache time, Data manager time, OLAP authorization time, OLAP input help time, OLAP services time, Query Generation time, Data read time, Data selection time, Front end data transfer time, Read texts time, Badi compute time, Other events time, Properties, Session ID, Step ID and HandleID. |
|
Other events time |
Indicates the time taken by this workbook to perform other events/activities upon an execution. |
Seconds/execution |
Other events comprises of a few basic operations such as draw symbols, BEx analyzer initialization, copy excel worksheet during sheet drill down, load local workbook (when opening a query), save workbook BLOB, and user interaction. |
|
OLAP time |
Indicates the Online Analytical processing time taken per execution by this workbook. |
Seconds/execution |
|
|
Data manager time |
Indicates the time taken by this workbook to query the data manager package for data upon execution. |
Seconds/execution |
|
The detailed diagnosis of the Response time measure lists the lists the name of the user, Start time, Info provider, Response time, Loading or Generating time, Query time, Serialize Deserialize time, Read time, Front end transfer time, Processing time, Rendering time, Other event time, Queries, OLAP time, Data manager time, Session ID, Step ID, Handle ID and Object properties. This helps to figure out the top executions that were the slowest for each workbook.
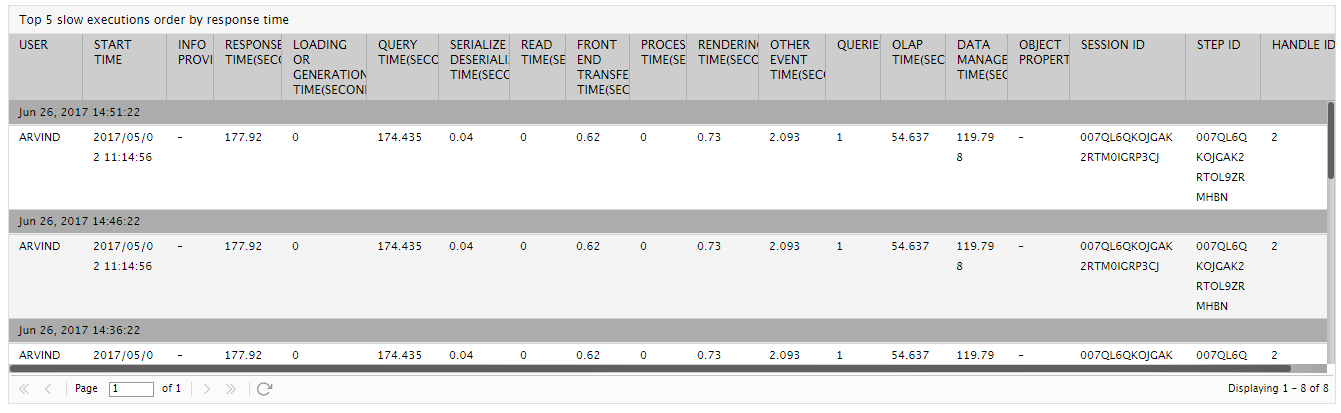
Figure 1 : The detailed diagnosis of the Response time measure
For each workbook, the detailed diagnosis of the Query time measure lists the name of the query, user executing the query, Info provider, Start time, Selected records, Transported records, Response time, OLAP time, OLAP cache time, Data manager time, OLAP authorization time, OLAP input help time, OLAP services time, Query Generation time, Data read time, Data selection time, Front end data transfer time, Read texts time, Badi compute time, Other events time, Properties, Session ID, Step ID and HandleID. This helps to figure out the top queries that are the slowest to execute on each workbook.
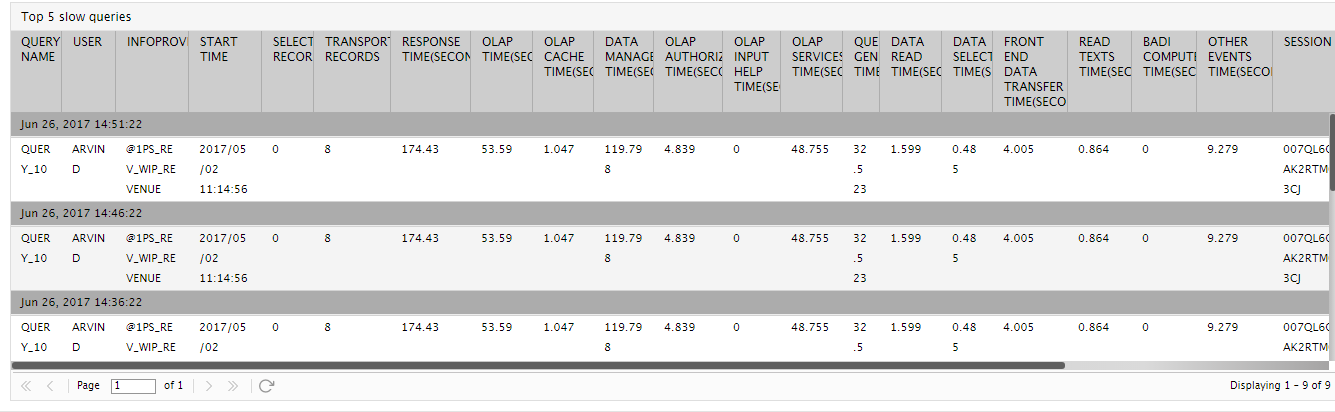
Figure 2 : The detailed diagnosis of the Query time measure