SQL Integration Package Status Test
Where multiple packages are running, it is often difficult for administrators to track the status of the individual packages and quickly identify packages that failed and those that stopped running abruptly. Now, with the help of SQL Integration Package Stats test, administrators can easily track package status, promptly identify problematic packages, and troubleshoot package failures/slowness before users notice.
This test monitors the packages that are running on SSIS and alerts administrators if any package fails or stops abruptly. Packages that are pending processing are also brought to the attention of administrators, as such processes are indicative of a processing bottleneck. Detailed diagnostics reported by the test reveal which package is in which state of execution presently, thus pointing administrators to the problematic packages and greatly shortening troubleshooting cycles.
Target of the test : A Microsoft SQL Server Integration Services server
Agent deploying the test : An internal agent
Outputs of the test : One set of results for the server being monitored
| Parameters | Description |
|---|---|
|
Test period |
How often should the test be executed |
|
Host |
The host for which the test is to be configured. |
|
Port |
The port at which the specified Host listens. |
|
Database Name |
This test runs queries on the SSIS database and reports metrics. To enable the test to connect to and execute queries on the SSIS database, this test has to be configured with the name of the SSIS database. By default, the ssisdb is the name of the SSIS database. If you have assigned a different name to this database in your environment, then override the default name by changing the value of the Database Name parameter. |
|
Database PortNo |
This test runs queries on the SSIS database and reports metrics. To enable the test to connect to and execute queries on the SSIS database, you need to configure this test with the correct port number at which the SSIS database listens. To know how to determine the port number of the SSIS database, refer to Configuring the eG Agent with the Database Port Number. |
|
User and Password |
To run queries on the SSIS database and report metrics, this test requires the permissions of a SYSADMIN user. Therefore, specify the credentials of a SYSADMIN user against User and Password. However, if, owing to security constraints, administrators prefer not to expose the credentials of a SYSADMIN user, then you can create a special user on the Microsoft SQL Server with SSIS_LOGREADER rights to the SSIS database. To know how to create such a user, refer to Configuring the eG Agent with Query Execution Permissions. Once the user is created, pass the credentials of this user to the test using the User and Password parameters. |
|
Confirm Password |
Confirm the password by retyping it in the Confirm Password text box. |
|
Instance |
The name of a specific SQL Integration Server instance to be monitored. The default value of this parameter is “default”. However, if the Microsoft SQL Server hosting the SSIS database uses named instances, then do the following:
|
|
Domain |
By default, none is displayed in the Domain text box. If the 'SQL server and Windows' authentication has been enabled for the server being monitored, then the Domain can continue to be none. On the other hand, if 'Windows only' authentication has been enabled, then, in the Domain text box, specify the Windows domain in which the SSIS database that this test connects to exists. Also, in such a case, the User name and Password that you provide should be that of a user authorized to access the Microsoft SQL server hosting the SSIS database of interest. |
|
Is NTLM v2 |
In some Windows networks, NTLM (NT LAN Manager) may be enabled. NTLM is a suite of Microsoft security protocols that provides authentication, integrity, and confidentiality to users. NTLM version 2 (“NTLMv2”) was concocted to address the security issues present in NTLM. By default, the Is NTLMv2 flag is set to No, indicating that NTLMv2 is not enabled by default on the target Microsoft SQL server hosting the SSIS database. Set this flag to Yes if NTLMv2 is enabled on that Microsoft SQL server. |
|
SSL |
By default, this flag is set to No, indicating that the Microsoft SQL server hosting the SSIS database is not SSL-enabled by default. On the other hand, if the SSIS database is hosted by a Microsoft SQL server that is SSL-enabled, then, set this flag to Yes. |
|
Detailed Diagnosis |
To make diagnosis more efficient and accurate, the eG Enterprise embeds an optional detailed diagnostic capability. With this capability, the eG agents can be configured to run detailed, more elaborate tests as and when specific problems are detected. To enable the detailed diagnosis capability of this test for a particular server, choose the On option. To disable the capability, click on the Off option. The option to selectively enable/disable the detailed diagnosis capability will be available only if the following conditions are fulfilled:
|
| Measurement | Description | Measurement Unit | Interpretation |
|---|---|---|---|
|
Total packages |
Indicates the total number of packages on the SQL Integration server. |
Number |
|
|
Created packages |
Indicates the number of packages that have been created currently. |
Number |
Use the detailed diagnosis of this measure to know which packages have been created. |
|
Running packages |
Indicates the number of packages that are running currently. |
Number |
Use the detailed diagnosis of this measure to know which packages are running. The start time and end time of each package is also provided as part of detailed metrics. Use the time metrics to identify packages that have been running for an unduly long time. It is extremely important to stop such executions to allow new instances to kick off at the next scheduled interval. |
|
Cancelled packages |
Indicates the number of packages for which execution was cancelled currently. |
Number |
Use the detailed diagnosis of this measure to know which packages were cancelled. |
|
Failed packages |
Indicates the number of packages for which execution has currently failed. |
Number |
Ideally, this measure should report the value 0. If a non-zero value is reported, then use the detailed diagnosis of this measure to know which packages failed during execution. |
|
Pending packages |
Indicates the number of packages that are currently awaiting execution. |
Number |
A consistent increase in the value of this measure could indicate slowness in package execution. To know which packages are executing slowly, use the detailed diagnosis of this measure. |
|
Unexpectedly ended packages |
Indicates the number of packages for which execution ended abruptly/unexpectedly. |
Number |
Use the detailed diagnosis of this measure to know for which packages execution ended unexpectedly. |
|
Succeeded packages |
Indicates the number of packages that successfully executed all their tasks. |
Number |
Use the detailed diagnosis of this measure to identify the successful packages. |
|
Stopping packages |
Indicates the number of packages that have stopped running. |
Number |
Use the detailed diagnosis of this measure to identify the stopping packages. |
|
Completed packages |
Indicates the number of packages that have completed execution. |
Number |
To know which packages have completed execution, use the detailed diagnosis of this measure. |
To know which packages were created during the current measurement period, use the detailed diagnosis of the Created packages measure. With the help of these detailed metrics, you can also determine when each created package started executing and for how long it was executing. Long-running packages are thus revealed, so you can investigate the reason why these packages were running for an abnormally long time.
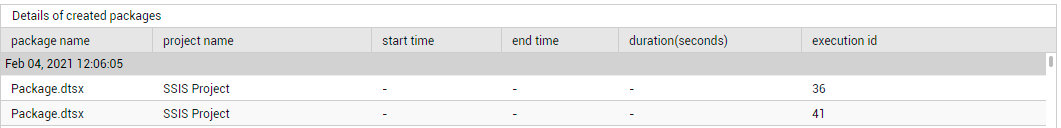
Figure 1 : The detailed diagnosis of the Created packages measure
For useful insights into failed packages, use the detailed diagnosis of the Failed packages measure. In the process, you can identify the packages that failed and how long they were running before the failure occurred.
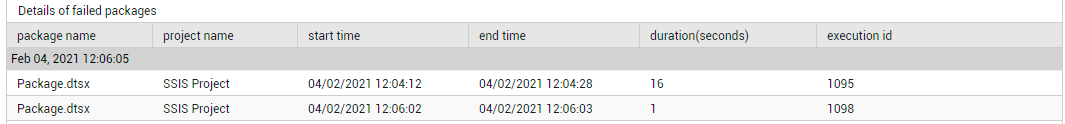
Figure 2 : The detailed diagnosis of the Failed packages measure
To know which packages successfully achieved everything they set out to do, use the detailed diagnosis of the Succeeded packages measure. From these detailed metrics, you can also figure out how much time each successful package took to complete its tasks. In the process, packages that executed too slowly can be isolated and the reasons for the slowness can be investigated.
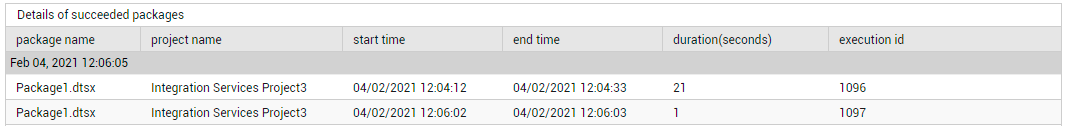
Figure 3 : The detailed diagnosis of the Succeeded packages.