Viewing Component Health
To view the current state of the eG-managed components, do the following:
-
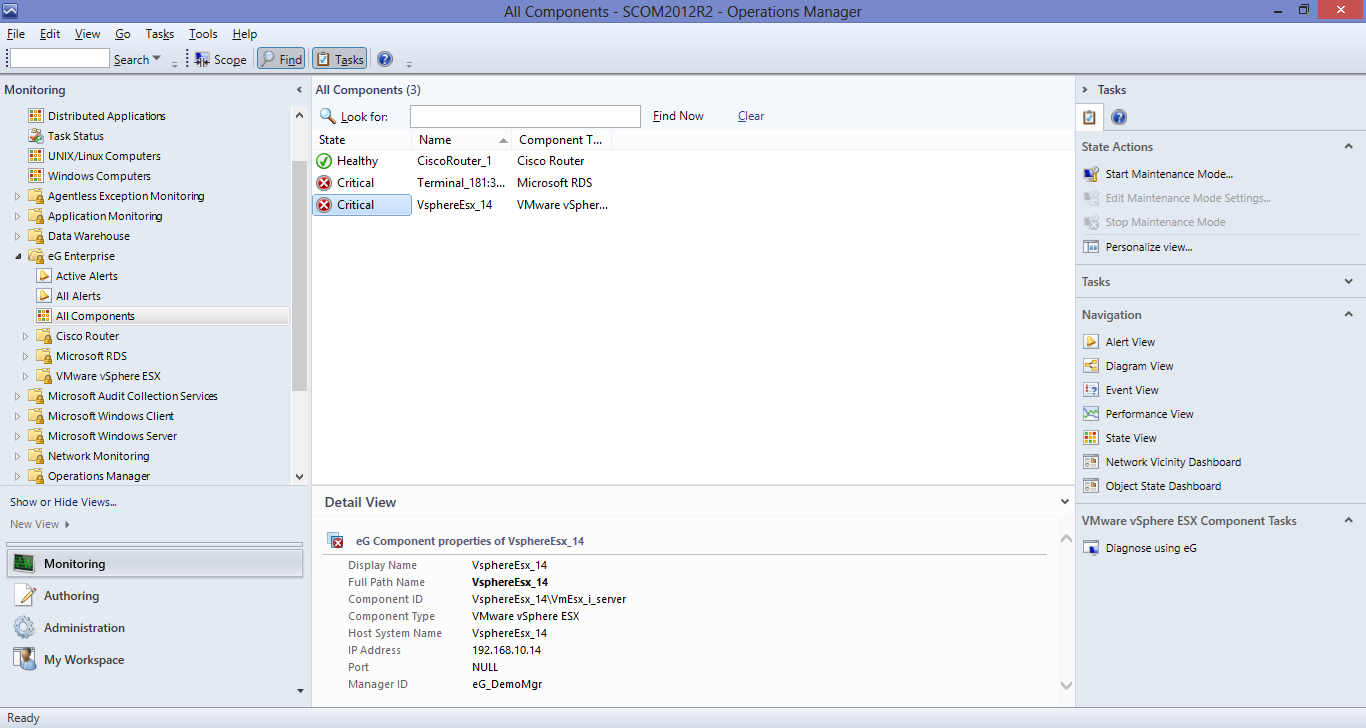
Click on the All Components sub-node under the eG Enterprise node in the tree-structure in the left panel of the SCOM console. The right panel will then display all the eG-managed components and their current state (see Figure 1).
-
From the All Components view, you can determine the current State of the eG-managed components, the Name of the components, and the Component Type. The SCOM states that correspond to the states prescribed by eG Enterprise are discussed in the table below:
eG State SCOM State Normal Healthy Critical Critical Major Warning Minor Warning Unknown Not Monitored / Uninitialized - From Figure 1, it is evident that while the Terminal and vSphere servers in our example are in a Critical state currently, the Cisco router is in a healthy state.
- Clicking on a row in the All Components view will reveal additional details of the chosen component in the Detail View section below. You can use the Personalize view option in the Actions pane to customize the All Components view - this way, you can include more columns to the default view or exclude existing columns.
-
If you select a component from the All Components view and click the Diagnose using eG option in the Actions pane, Figure 2 will appear.
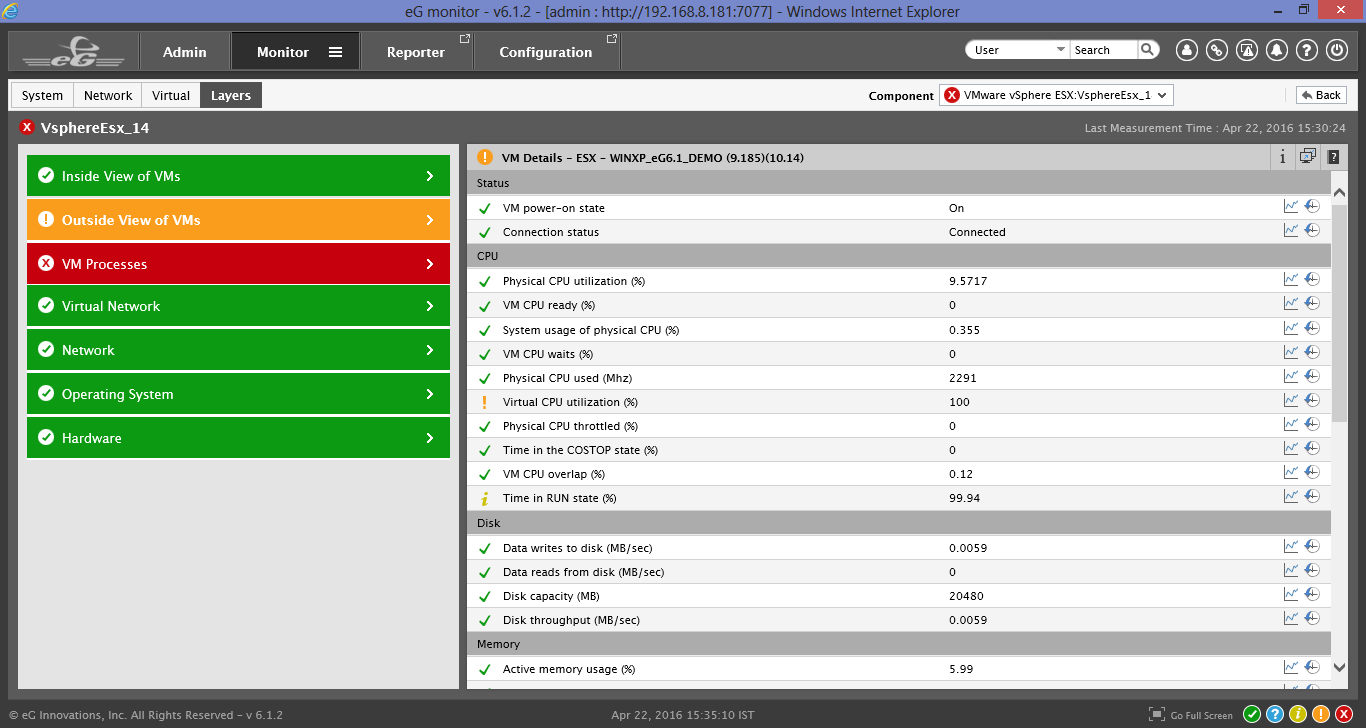
Figure 2 : Launching the eG monitoring console from the SCOM console
- Figure 2 reveals the layer model of the component chosen from the All Components view, and also displays the problem layer, problem test and problem measures related to that component. This way, you can quickly isolate why the component is in an abnormal state currently.
Note:
Clicking on the Diagnose using eG option will launch the eG monitoring console only if the eG Console Tasks application is installed on the system on which the SCOM console is operating. To know how to install this application, refer to Installing the eG Console Tasks Application. Also, when the eG console is launched for the very first time from the SCOM console, a login screen will appear, where you will have to manually key in the user credentials for logging into the eG monitoring console. The same credentials will be used to launch the eG monitoring console during your subsequent attempts to Diagnose using eG.