Monitoring Sun Java System Application Servers
eG SunONE monitor offers extensive infrastructure monitoring capabilities for the SunONE application suite. A pre-built model for the SunONE application servers (see Figure 1) dictate what metrics are to be collected by eG agents, what thresholds are to be applied to the metrics, and how the metrics are to be correlated in order to assist with problem diagnosis.
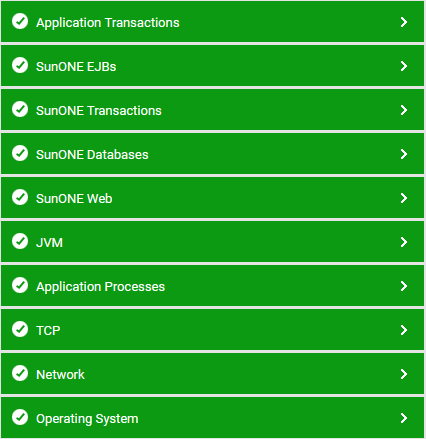
Figure 1 : The layer model of a Sun Java System application server
Using the customized model for the Sun Java System Application server (see Figure 1), you can monitor the following:
- Server up/down time monitoring
- Server throughput tracking in terms of requests and data traffic
- JDBC connection pool usage levels and connection failure reports
- Thread pool execution status levels
- Transaction-related measures including the number of transactions that are completed, rolled back and in-progress
- EJB caching efficiency, bean pool-related metrics