Monitoring TeraText Content Server
eG Enterprise offers a dedicated TeraText Content Server monitoring model, which monitors the internal operations and external availability of the Content Server from time-to-time, and proactively alerts administrators to current and probable performance issues.
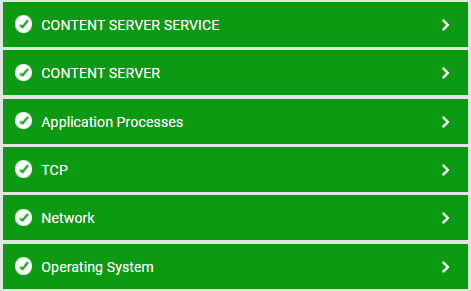
Figure 1 : Layer model of the TeraText Content Server
Each layer of this agent-based monitoring model is mapped to a variety of tests that report on a wide range of performance parameters related to the TeraText Content Server.
Once the pre-requisites discussed in Pre-requisites for Monitoring the TeraText Content Server are fulfilled, you can then configure the eG agent to collect a wealth of performance metrics pertaining to the Content Server. Using these metrics, administrators can find quick and accurate answers for the following performance queries:
- Is the server available? If so, how quickly is it responding to client requests?
- Is any database on the Content Server occupying too much disk space? If so, which one is it and why? - is it because of too many files or is it because the file size is high?
- Has the disk cache been utilized optimally? Which file on the Content Server is using the disk cache most ineffectively?
- Is the server experiencing any memory contentions? If so, why? - is it because the disk cache is over-utilizing the memory resources? or is it due to a memory-hungry index cache?
- Are file operations experiencing any latencies?
- Is there any delay in the processing of record-change operations?
- Are security requests been processed quickly?
- Were records pertaining to present operations retrieved from the database in good time?
- Were any latencies noticed in the processing of Z39.50 operations?
- Is there any bottleneck in the processing of search requests or sort and merge requests?