Detailed Diagnostics
The real-time measures reported by the eG Real User Monitor provide a high-level view of user experience. In other words, the measures offer a broad web site-level, page group-level, or device-level perspective to web site/web application performance. To provide more granular, page-level insight into the user experience with a web site/web application, the eG Real User Monitor collects detailed diagnostics at configured intervals.
This topic and its sub-topics discuss these diagnostics and the different ways in which they are presented in the eG monitoring console, so as to ease root-cause analysis.
Detailed Diagnosis of the Web Site Test
By default, it is the Web Site test that collects the detailed heuristics. The metrics so collected are available as part of the detailed diagnosis of the following measures:
- Page views
- Average page load time
- JavaScript error page views
- JavaScript error page view percentage
- Slow page views
- Frustrated page views
- Tolerating page views
- Desktop page views
- Mobile page views
- Tablet page views
The basic information provided in the detailed diagnosis remains the same for all the measures listed above. Figure 1 below provides a sneak-peek at the standard columns that are available as part of the detailed diagnosis of all measures.
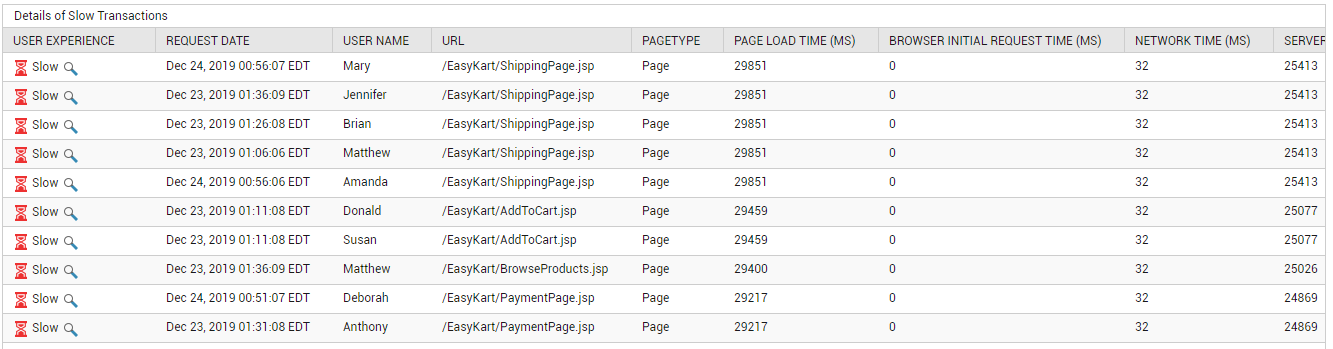
Figure 1 : Sample detailed diagnosis of a measure reported by the Web site test
This basic information includes the following:
- Which pages were accessed and at what times; this will point you to those pages that were accessed frequently;
-
Which user is accessing each page? Note that the user name will be captured and displayed only if:
- The 'Capture UserName' flag in the Add/Modify page of the Real User Monitor component is set to 'Yes' (see Figure 2), and;
- The procedure detailed in
- What is the user experience with each page view (slow? healthy? Or error?), the average load time per page view, and the break-up of the load time of every page view; slow page views can thus be quickly identified and the reason for the slowness accurately isolated - is it the browser? the network? content download? or the server? or page rendering?
- Which browser and device was used to access each page?
- Which is the device OS?
- From which client was each page request received?
- From which country, city, and region was each page accessed?
What pages are listed in the detailed diagnosis will however, differ according to the following:
-
The measure with which the detailed diagnosis is associated;
-
The configuration of the following parameters of the Web site test:
- Maximum Healthy Transactions in DD
- Maximum Slow Transactions in DD
-
Maximum Error Transactions in DD
Using these parameters, you can dictate how much information is to be collected, stored, and reported for each measurement period in the timeline chosen for the detailed diagnosis. By default, all these parameters are set to 5. You can increase or decrease the value of these parameters to display more or less number of page views per measurement period in your detailed diagnosis.
This means that, by default, the detailed diagnosis of the Web site test will display the following for each measure :
The following will be displayed for each measurement period in the chosen timeline:
-
The top-5 page views, which registered a satisfactory user experience
-
The top-5 slow page views, in terms of the page load time;
-
The top-5 page recent page views that encountered JavaScript errors;
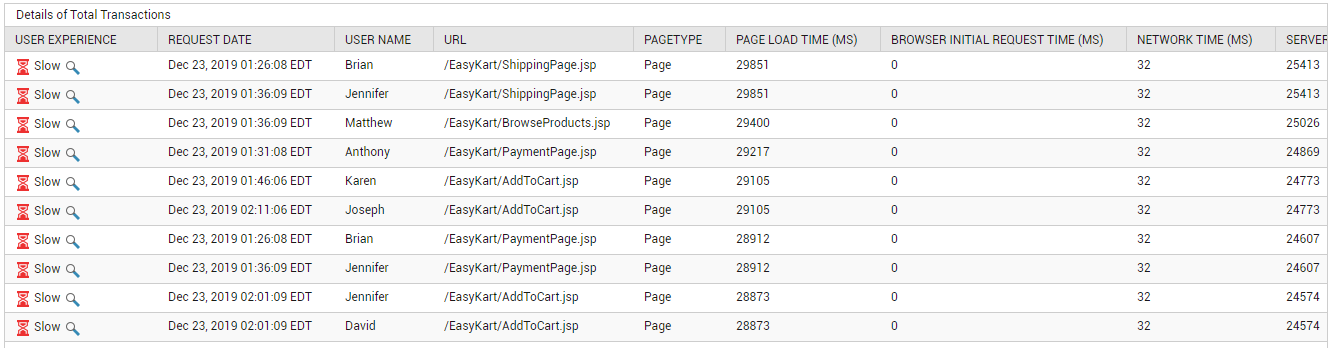
Figure 2 : The detailed diagnosis of the Page views measure
-
The top-5 slow page views in terms of the page load time;
-
The top-5 page most recent page views that encountered JavaScript errors;
Figure 3 : The detailed diagnosis of the Average page load time measure
The following will be displayed for each measurement period in the chosen timeline:
-
The top-5 most recent page views that encountered JavaScript errors;
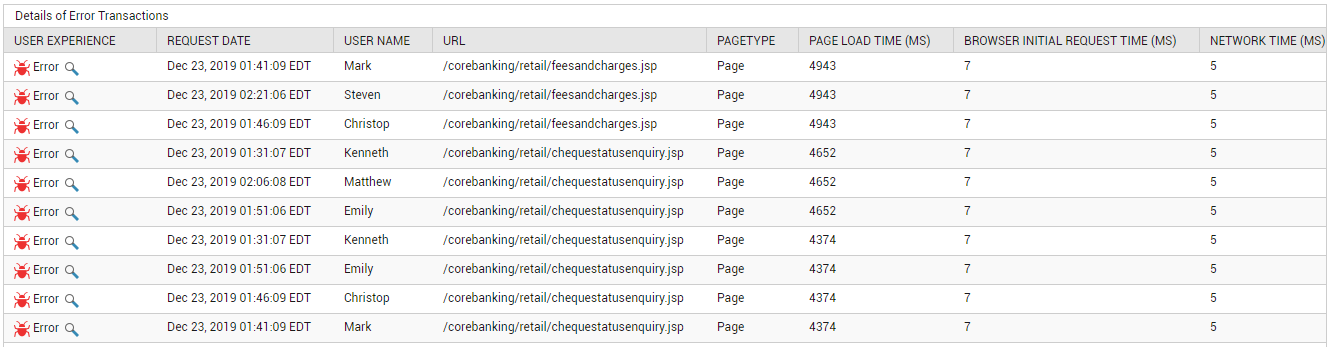
Figure 4 : The detailed diagnosis of the JavaScript errors measure
-
The top-5 slow page views, in terms of the page load time;
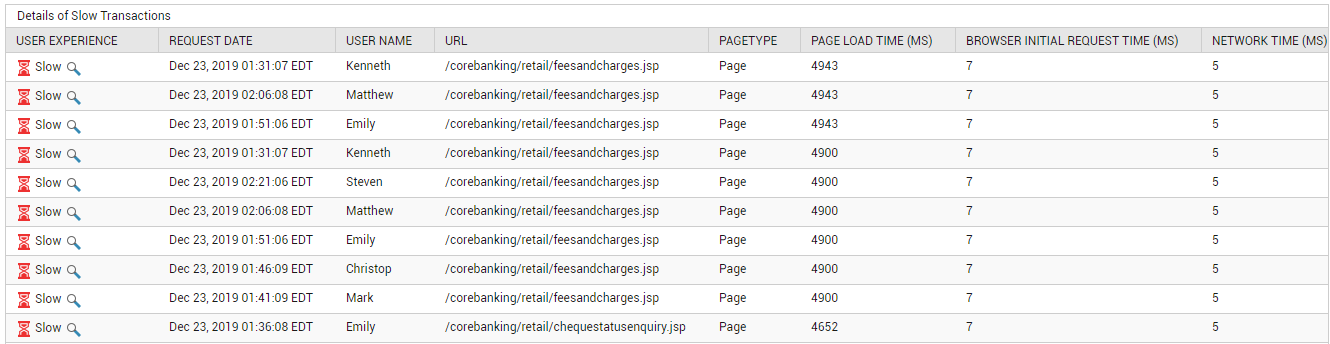
Figure 5 : The detailed diagnosis of the Slow page views measure
The following will be displayed for each measurement period in the chosen timeline:
-
The top-5 tolerating page views, in terms of the page load time;
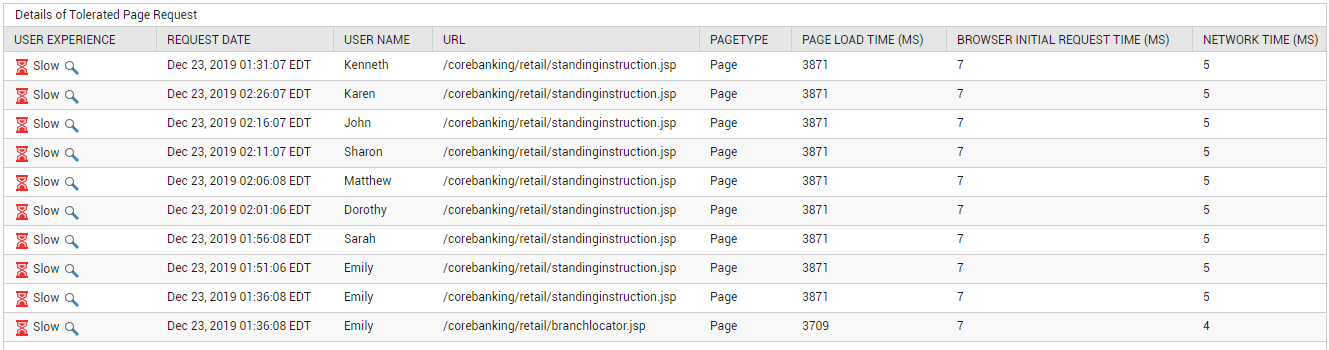
Figure 6 : The detailed diagnosis of the Tolerating page views measure
The following will be displayed for each measurement period in the chosen timeline:
-
The top-5 frustrated page views, in terms of the page load time;
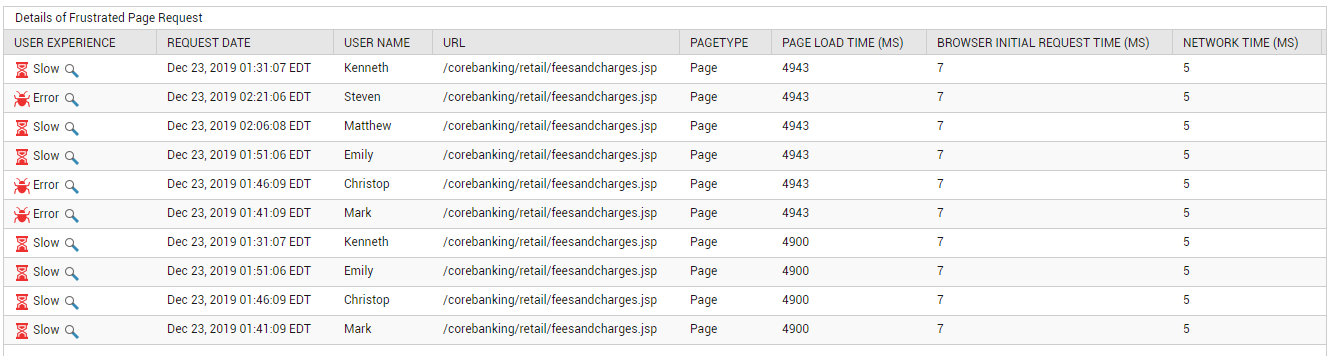
Figure 7 : The detailed diagnosis of the Frustrated page views measure
The following will be displayed for each measurement period in the chosen timeline:
-
The top-5 page views (in terms of time of request), which registered a satisfactory user experience. A satisfactory user experience is one where the Average page load time of a page view falls well below the Slow Transaction Cutoff configured for the Web Sitetest. .Note that such page views can have JavaScript errors.
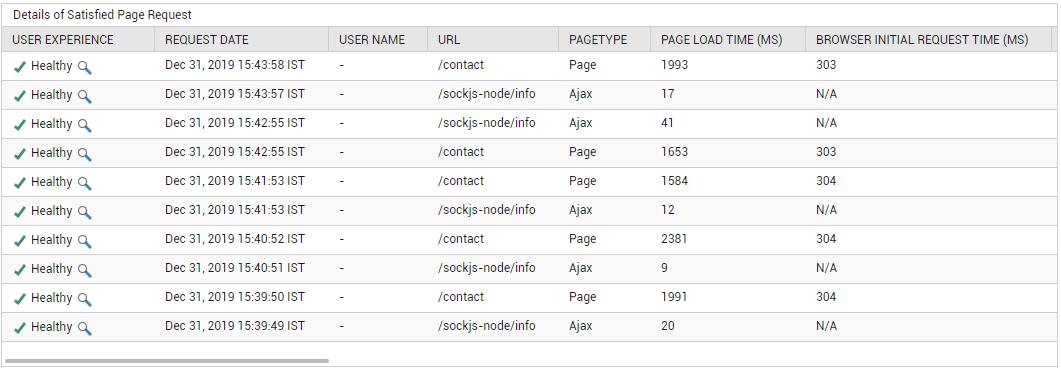
Figure 8 : The detailed diagnosis of the Satisfied page views measure
The following will be displayed for each measurement period in the chosen timeline:
-
The list of page views, out of the top-5 slow, error, and healthy page views, which were launched from desktops
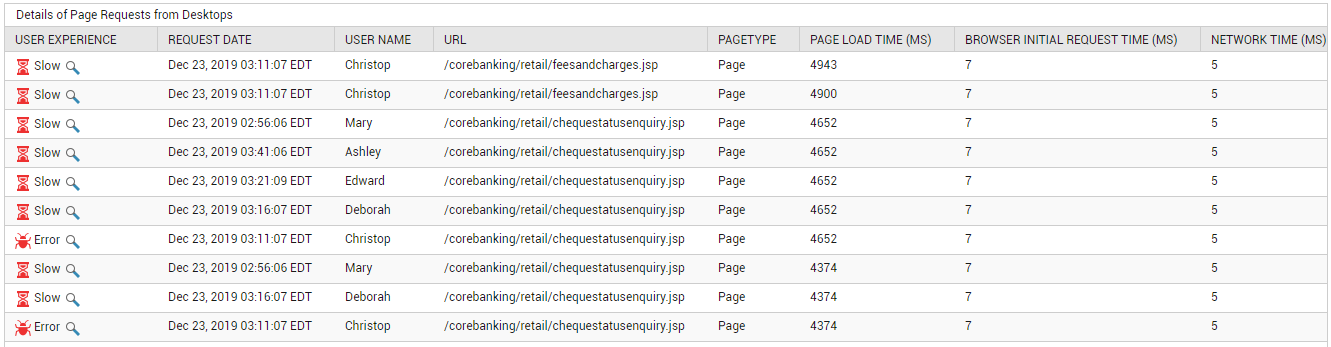
Figure 9 : The detailed diagnosis of the Desktop page views measure
The following will be displayed for each measurement period in the chosen timeline:
-
The list of page views, out of the top-5 slow, error, and healthy page views, which were launched from mobile phones
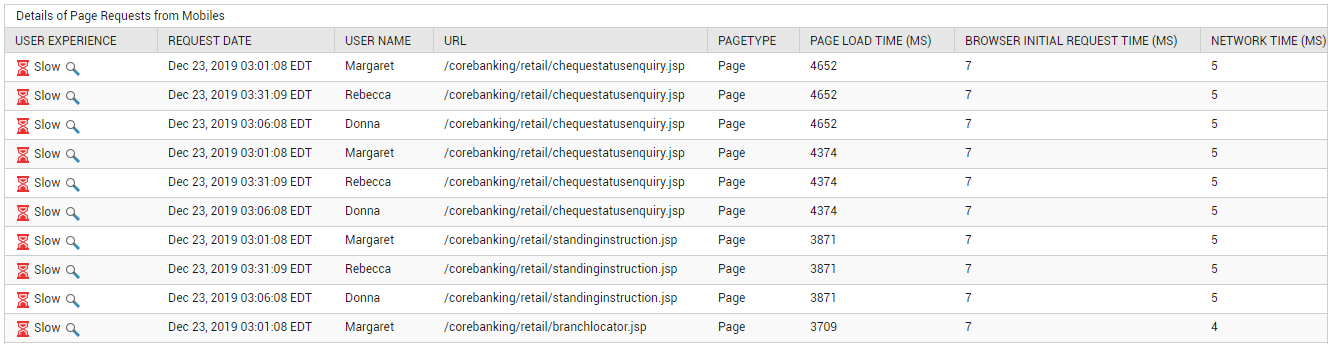
Figure 10 : The detailed diagnosis of the Mobile page views measure
The following will be displayed for each measurement period in the chosen timeline:
-
The list of page views, out of the top-5 slow, error, and healthy page views, which were launched from tablets.
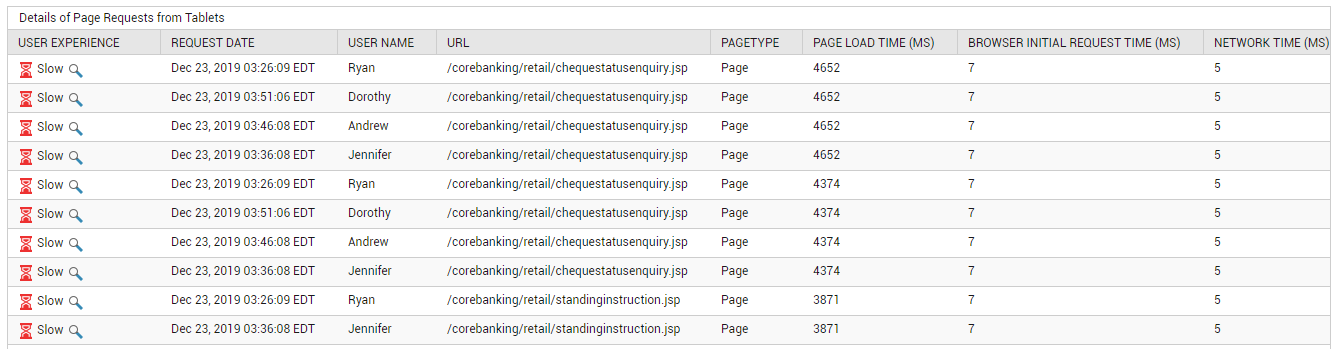
Figure 11 : The detailed diagnosis of the Tablet page views measure
Note:
The other tests run by the eG Real User Monitor use the same detailed diagnosis information that the Web Site test collects and stores in the eG database. These tests however, pick and present in their detailed diagnosis, only that information that is relevant to their purpose. For example, the Page views measure of the Chrome descriptor of the Browsers test, by default, will scan the top-5 slow, error, and healthy transactions on the web site/web application, pick only those transactions that were launched from the Chrome browser, and will list all those transactions in its detailed diagnosis.
By default, the detailed diagnosis is sorted by Request date. If required, you can sort the same by Page load time by selecting this option from the Sort by drop-down in the Detailed Diagnosis page.
You can even drill down from a URL in the detailed diagnosis to access additional analytics. The sections that follow will discuss these analytics in great detail.
The RUM Transaction Details Page
You can zoom into a particular page by clicking on the magnifying glass icon alongside its URL in the detailed diagnosis page. The RUM Transaction Details page will then appear. This page graphically represents the entire path of the page request / transaction, from the time the browser received the request to the time the server responded to it by serving the requested page. The time spent by the request at each step is also displayed in the graphic. A pie chart is also provided alongside that depicts what percentage of the page load time was spent at the browser, the network, downloading content, and the server. From the size of the slices in the pie, you can quickly and accurately determine where your request was delayed. If the pie chart reveals that Browser time is the reason for the poor responsiveness of a URL, then a quick look at the Browser Request and Browser Response break-up in the transaction flow chart will point you to why the request lost time on the browser - is it because the browser was slow in connecting to the server and processing the request? or is it because the browser was slow in fetching the resources from the server and rendering the requested page? If the issue was with the Browser Request, then the transaction flow chart also reveals why initial request processing by the browser was delayed - is it because the URL took too much time to follow redirection? or is it because the URL was waiting too long for a previous request to end? or is an AppCaching issue the reason?
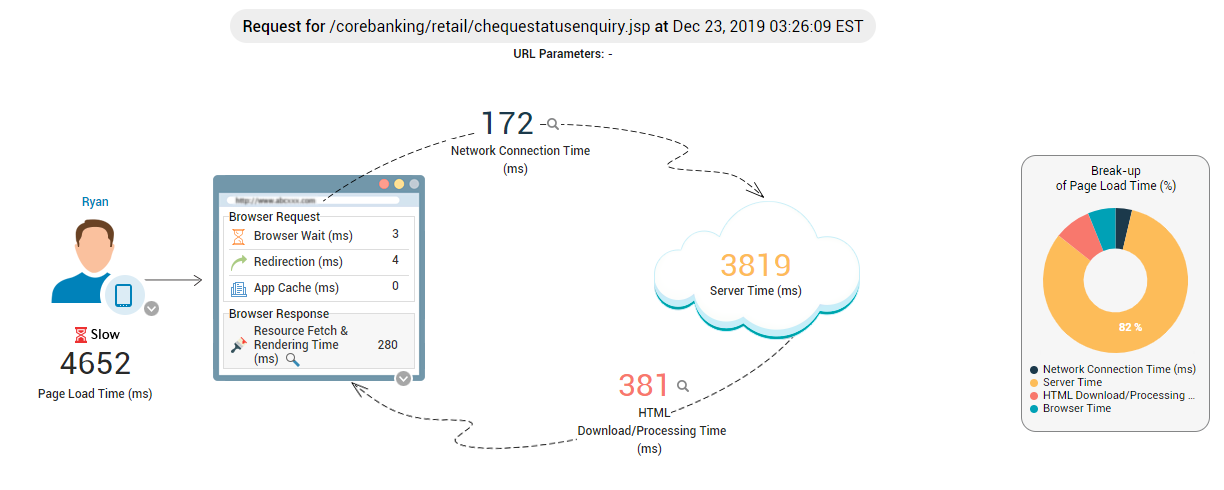
Figure 12 : The RUM Transaction Details page displaying the entire flow of the page request/transaction
If the transaction flow diagram reveals that a latent network is what is causing the transaction to slow down, then you can easily determine why the network is latent by moving your mouse pointer over Network Connection Time in the diagram. A break-up of the Network connection time will then pop up, indicating exactly when network connection was bottlenecked - is it when performing a domain lookup to access the web site/web application? is it when establishing a TCP connection with the server? or was there a delay in the SSL handshake?
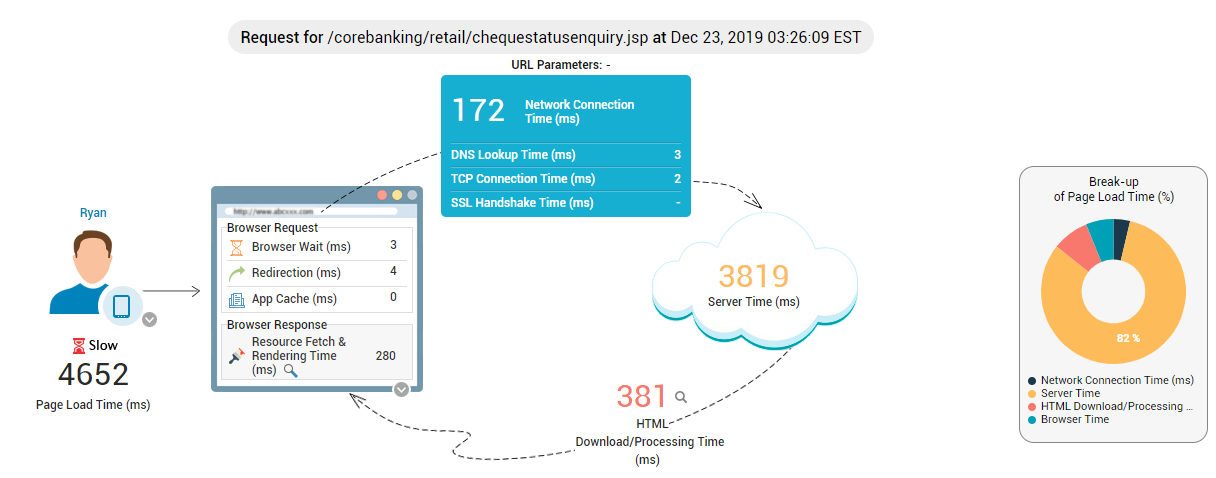
Figure 13 : The transaction flow indicating the reason why Network connection time is high
If Browser Response is the bottleneck, then you click on the 'magnifying glass' icon under Browser Response in Figure 16 to know why. The Resource Details tab page will then open. To know more about this tab page, refer to The Resource Details Page topic.
The transaction flow diagram also provides you with useful information about the page being viewed such as the browser used to access the page, the page type, and redirection URL (if any). To view this information, click on the 'down arrow' icon you will find at the right, bottom corner of the Browser Request window, as depicted by Figure 14.
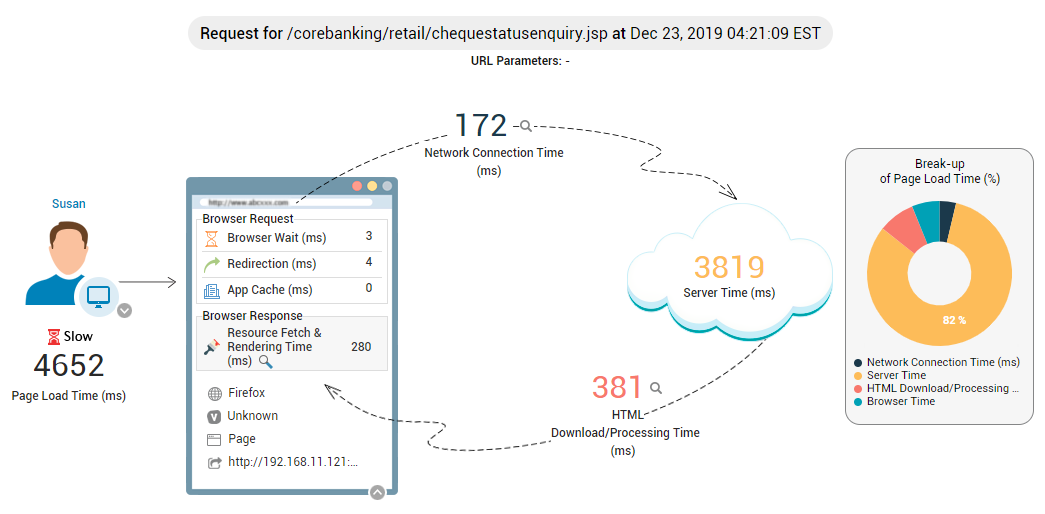
Figure 14 : The transaction flow displaying page information
You can also view user-related information in the transaction flow diagram. The geography to which the user who initiated the transaction belongs, client from which he/she is connecting, and the operating system of the client can be viewed by simply clicking the 'down arrow' icon adjacent to the user icon, as depicted by Figure 15.
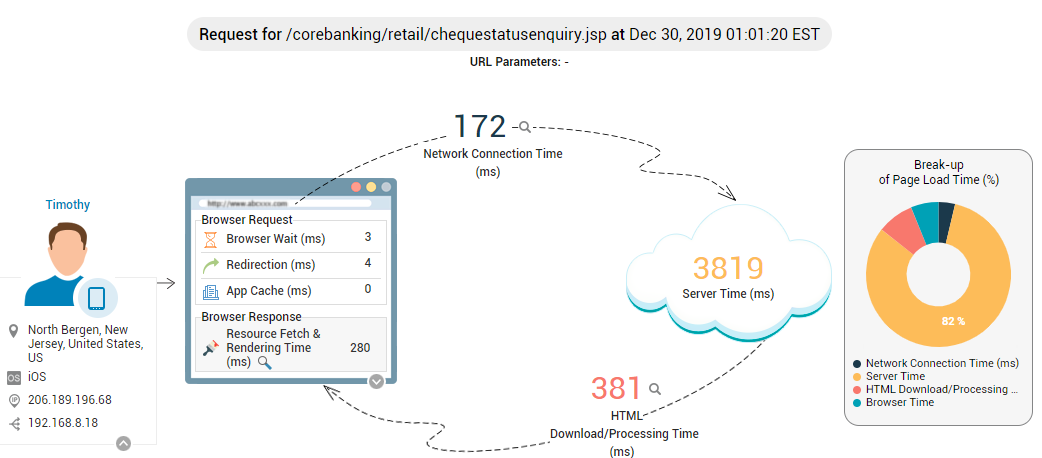
Figure 15 : The transaction flow displaying user information
The Resource Details Page
If the RUM Transaction Details page reveals that the Browser Response is the bottleneck, then you can click on the 'magnifying glass' icon under Browser Response in Figure 16 to know why. The Resource Details tab page will then open listing all the resources the browser was attempting to download from the server in response to the URL request, and the time taken to download each resource. This list enables administrators to pinpoint the precise resources that took an abnormally long time to be downloaded, thereby delaying page rendering. For instance, if resources such as CSS or JavaScripts are taking too long to load, they can be identified easily using Figure 16. This way, web masters can get insight into what resources to minify to get faster page load. Also, if there is a scenario where resources are being downloaded during each page load instead of being served from the browser cache, it can be found using Figure 16.
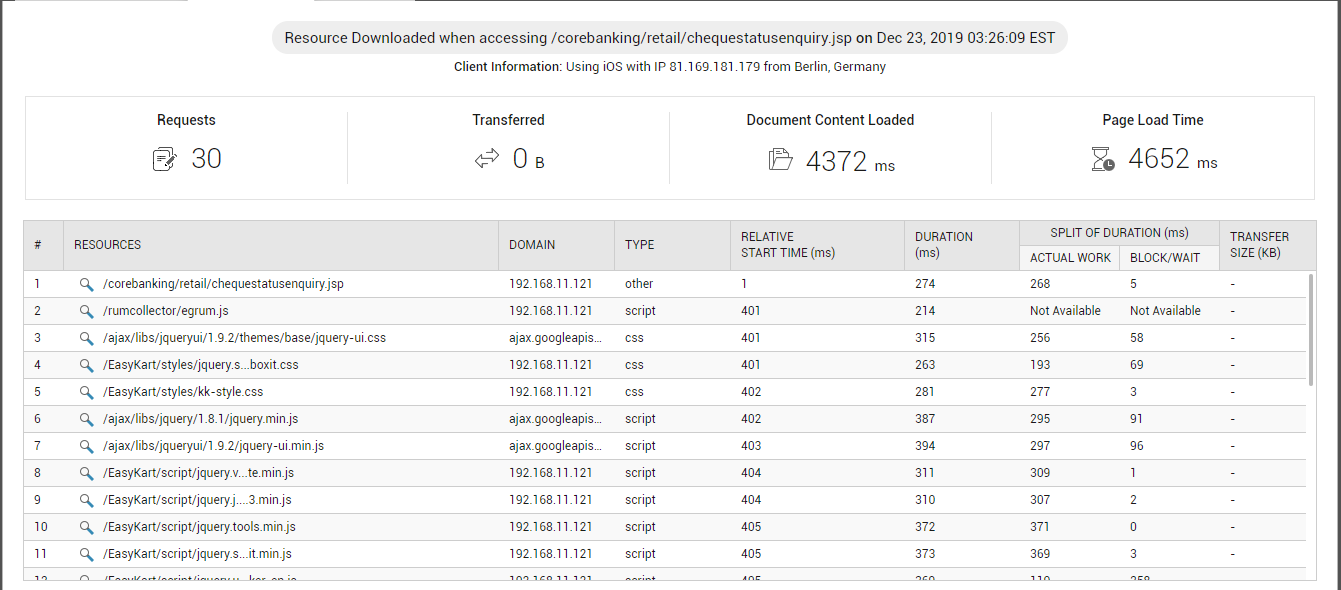
Figure 16 : The Resource Details tab page revealing the resources that took too long to be downloaded from the server
To know where resource download was bottlenecked, click on the 'magnifying glass' icon alongside the problematic resource in Figure 16. Figure 17 will then appear.
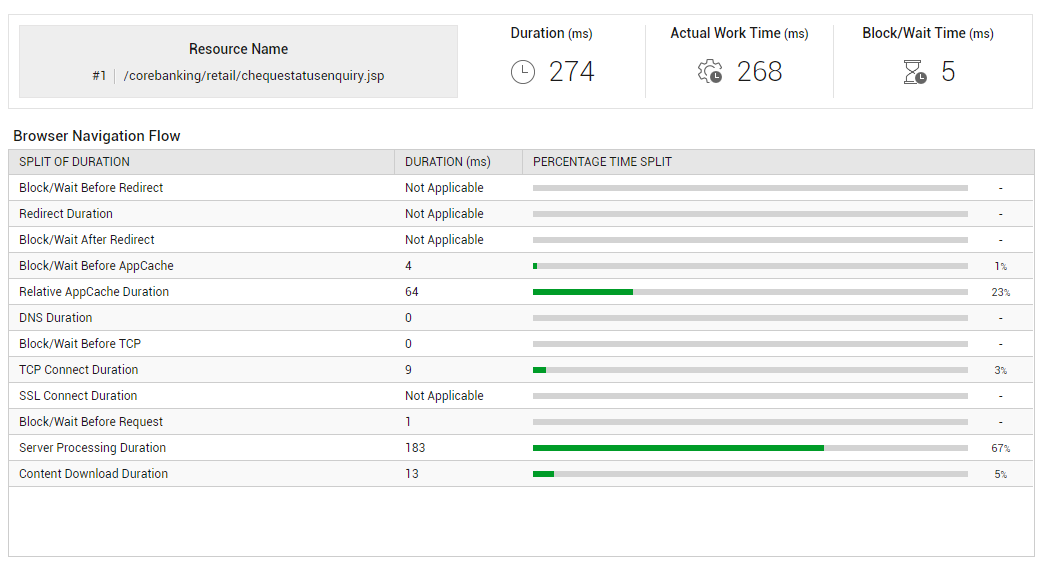
Figure 17 : Resource fetch time break-up
For a chosen resource, Figure 17 quickly reveals where resource download was delayed - on the browser? the network? or the server? If the delay was at the browser or the network, then the granular insights provided by Figure 17 will enable web masters to accurately identify the exact browser/network activity that caused resource loading slowness - redirection? AppCaching? browser wait? TCP connection? DNS lookup? or SSL handshake?
Similarly, if a delay in content downloading caused the transaction to slow down, then you can move your mouse pointer over Content Download Time in the flow diagram to determine where exactly content downloading was bottlenecked - during document downloading? or during document processing?
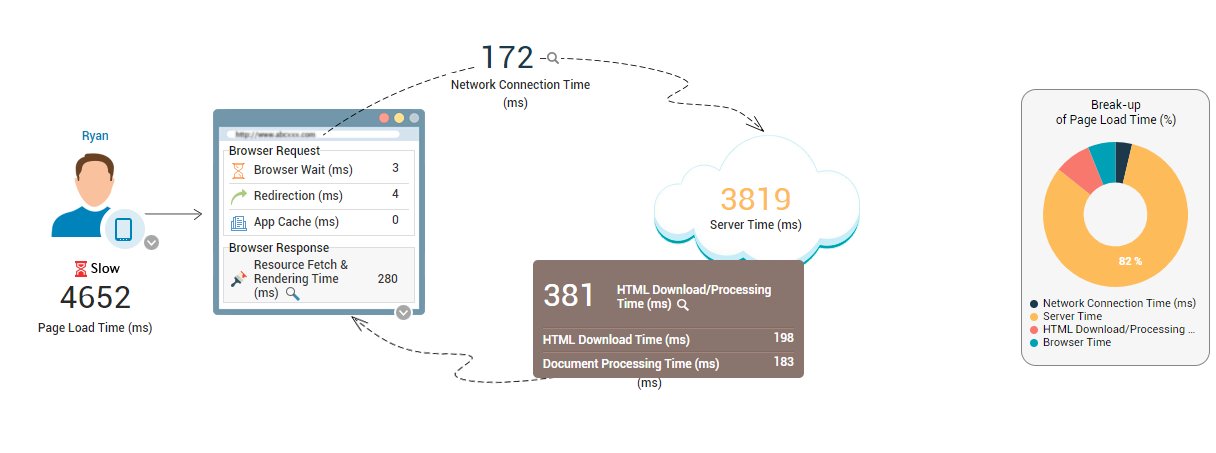
Figure 18 : The transaction flow chart displaying the break-up of Content Download Time
If a web page takes too long to download content, then users can quickly drill down from the detailed diagnostics of the content download time measure, shown by Figure 18, to view the load time of each resource in that page (see Figure 16). For this, click on the 'magnifying glass' icon alongside HTML Download/Processing Time (ms) in Figure 18. This enables administrators to identify the exact resource in that page that is delaying the content download. You can even drill down from a particular resource in Figure 16 to view where resource loading was bottlenecked (see Figure 17).
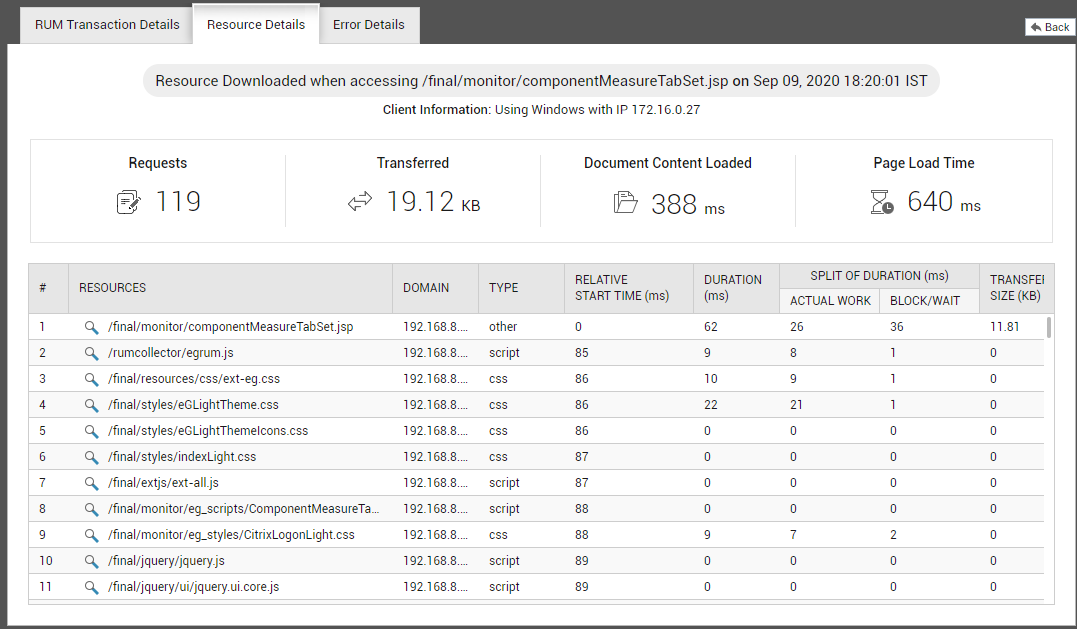
Figure 19 : The Resource Details tab page revealing which resource is delaying content download
Note:
eG Enterprise provides the resource-level visibility into page load time (see Figure 16 and Figure 17), by leveraging the Resource Timing API. The Resource Timing API enables retrieving and analyzing detailed network timing data regarding the loading of a web application's resource(s). A resource can be an XMLHttpRequest, image, script, etc. Now, if the users are accessing the monitored web page using the Internet Explorer (IE) browser, then sometimes, the load time of one/more resources may be displayed as -1 in the eG monitoring console. This is because, when monitoring page views from IE, the Resource Timing API reports ‘-1’ as the load time of certain resources. Also, some versions of Internet Explorer, do not support the Resource Timing API at all. When monitoring page views from such versions of IE, no resource metrics will be reported.
AJAX Requests in the RUM Transaction Details Page
AJAX requests are depicted differently in the RUM Transaction Details page. If a request makes an AJAX call to the server, then such a call will be tagged as an Ajax Call in this page (see Figure 20).
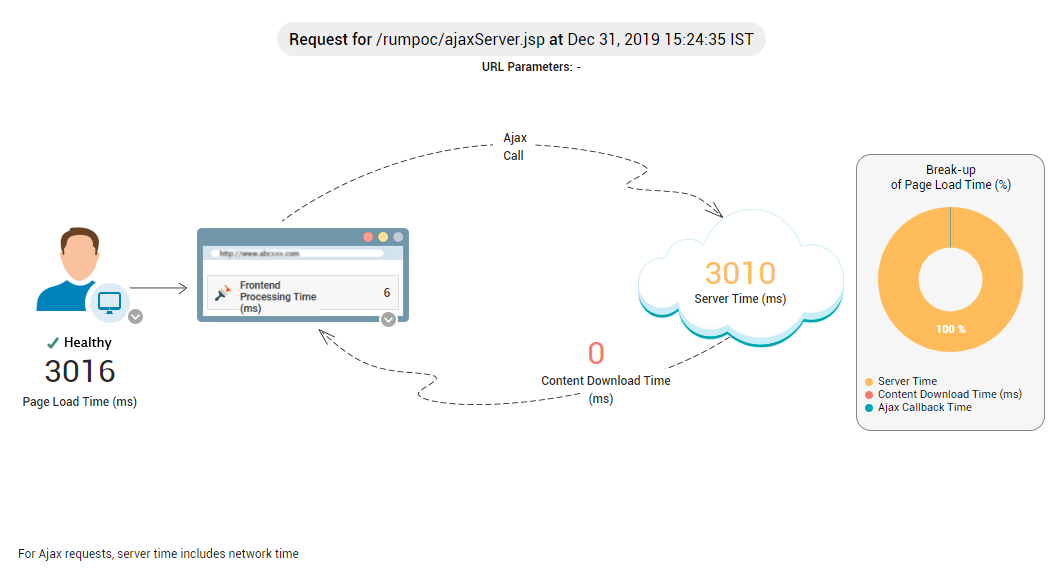
Figure 20 : The RUM Transaction Details for an AJAX call
The Network connection time is included as part of Server time. This is why, in the RUM Transaction Details page for an AJAX request, by default, the Network connection time is not indicated (see Figure 20). In the Detailed Diagnosis page also, the Network Connection Time column for an AJAX request will not display any value.
Typically, an AJAX function takes AJAX details as input along with a Callback reference. The Callback reference comes into play after the server processes the AJAX request. The Callback is generally used to communicate the result of the AJAX call to the caller, so that the caller can resume processing. For instance, say you have a function F1 which calls the AJAX function F2. F1 would like to know the result of the AJAX function F2 to proceed with its processing. For this, F1 will pass another function say C1 as an additional parameter to F2; C1 is the Callback reference. F2 will call C1 after it processes the AJAX request completely. C1 will communicate the result of F2 to the caller. The time taken by C1 - i.e., by the Callback function - for computing and sending the result to the caller is displayed in the RUM Transaction Details page as Ajax Callback Time.
Note:
- In the detailed diagnosis of an AJAX request, the Ajax Callback Time will be included in the Browser Render Time of that request.
- When reporting real-time metrics for an AJAX request, the Ajax Callback Time will be reported as Document Processing Time.
In summary, for AJAX requests, by default, the following metrics will only be displayed in the RUM Transaction Details page:
- Page Load Time
- Server Time
- Content Download Time
- Ajax Callback Time
In other words, the detailed break-up of response time, which is reported for other page types (eg., BasePage, iFrames), is not available by default for AJAX requests. This is because, the Enable AJAX Correlation parameter is set to No by default. You will find this parameter when you add a Real User Monitor component for monitoring using the eG admin interface (see Figure 2) .
To enable eG RUM to collect detailed response time metrics of AJAX requests, you first need to set the Enable AJAX Correlation flag to Yes. If this is done, then eG RUM will automatically correlate the default metrics it reports for AJAX requests with the insights that the ResourceTiming API offers for such requests. This auto-correlation enables eG RUM to provide the break-up of the response time of an AJAX request in the RUM Transaction Details page of that request (see Figure 21).
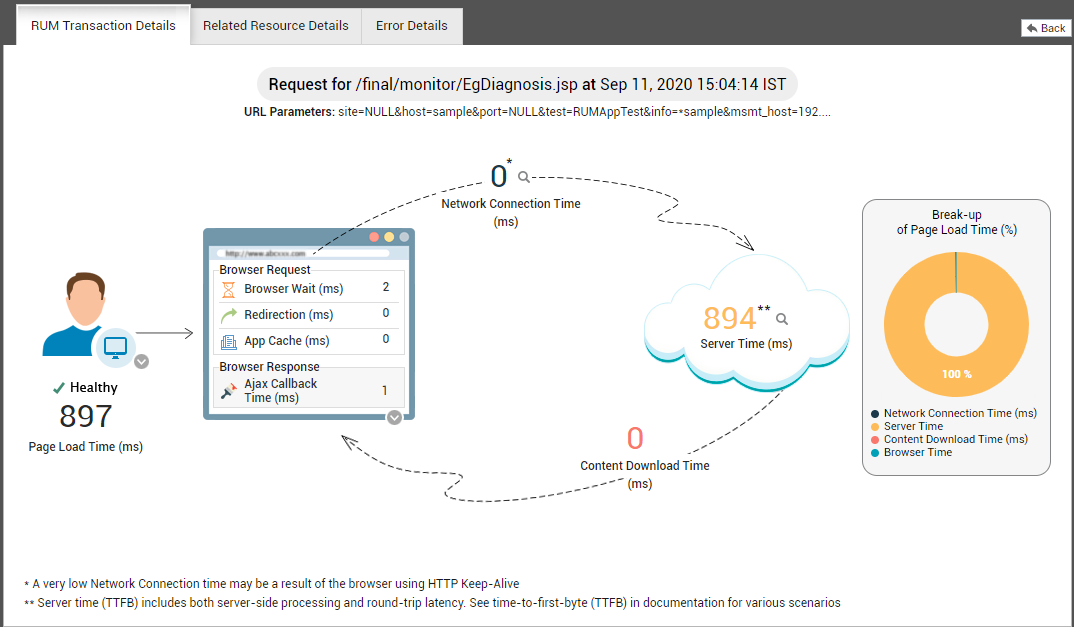
Figure 21 : The RUM Transaction Details page for an AJAX request displaying granular load time metrics, after the 'Enable AJAX Correlation' parameter is set to 'Yes'
As is evident from Figure 21, a break-up of Browser Request time is now available for the AJAX request. The Ajax Callback Time is now been reported as the Browser Response time. Network Connection Time, which was earlier not reported for an AJAX request, is also now visible. To view the break-up of the Network Connection Time, you can even move your mouse pointer over the 'magnifying glass' icon alongside that time value in Figure 21. The break-up will appear as shown by Figure 22.
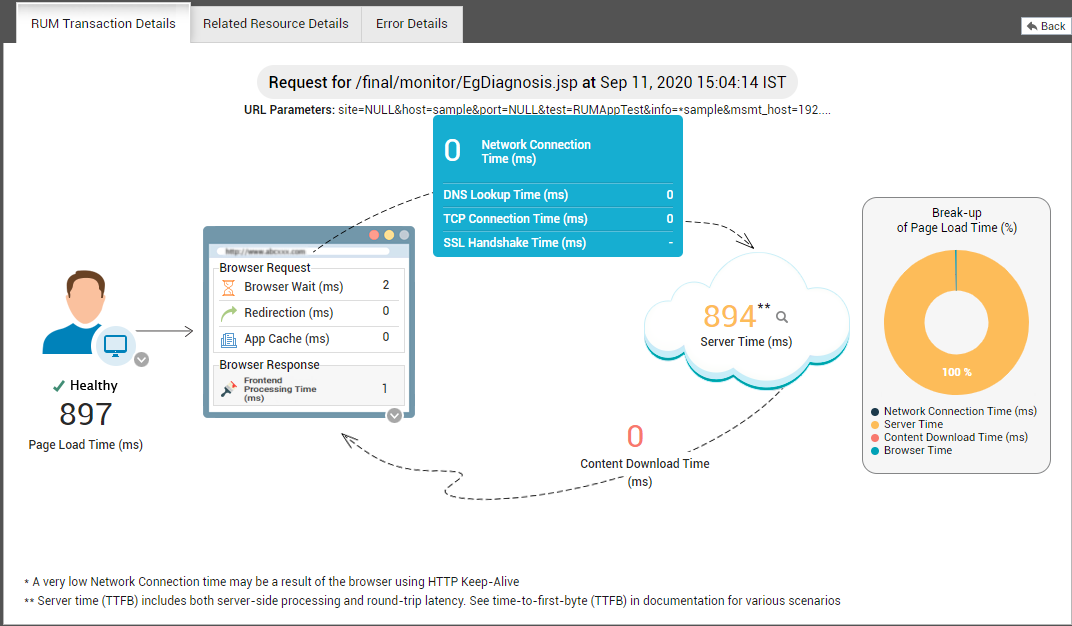
Figure 22 : The split-up of the Network Connection Time of an AJAX request
If you want more granular load time metrics, you can switch to the Related Resource Details tab page, which appears next to the RUM Transaction Details tab page in Figure 21. For instance, the illustrated example of Figure 21 reports that the Browser Wait time (under Browser Request ) is 2 milliseconds. Say, you want to know where or what the browser was waiting for. To determine this, click on the Related Resource Details tab page in Figure 21. Figure 23 will then appear. The AJAX request being monitored will be displayed under the RESOURCES column of Figure 23.
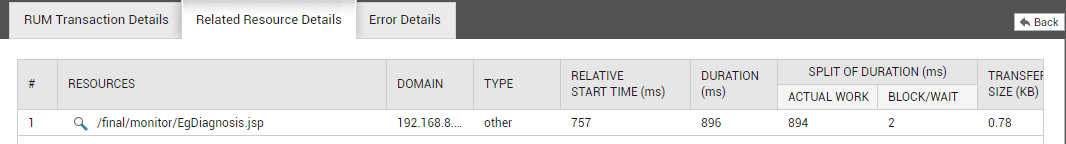
Figure 23 : The Related Resource Details tab page displaying the AJAX request being monitored
Click on the 'magnifying glass' icon alongside that request in Figure 23 to zoom into it. This will open Figure 24, which will provide the complete break-up of load time of the AJAX request.
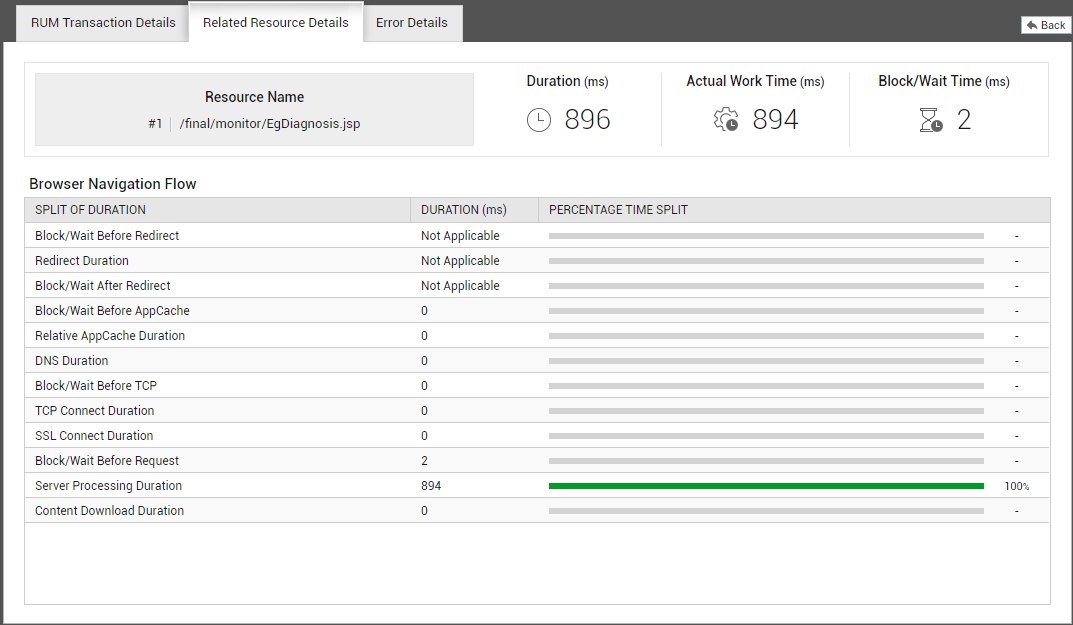
Figure 24 : The Related Resource Details tab page providing a complete break-up of the response time of the chosen AJAX request
The Browser Wait time that you see in the RUM Transaction Details page of Figure 21 is actually the sum of all the Block/Wait times displayed in Figure 24. By comparing these Block/Wait times, you can accurately determine where the browser spent maximum time waiting. In the case of our example, this comparison reveals that the browser has spent maximum time waiting to send the request (see Block/Wait Before Request measure in Figure 24).
This way, every measure of time that you see in Figure 24 either individually or collectively maps to a metric displayed in the RUM Transaction Details page. The mappings are detailed below:
|
Measure in RUM Transaction Details Page |
Measures in Related Resource Details Page |
|
Browser Wait time |
Sum of all Block/Wait times |
|
Redirection time |
Redirect Duration |
|
App Cache time |
Relative App Cache Duration |
|
Network Connection Time |
Sum of DNS Duration, TCP Connect Duration, and SSL Duration |
|
Content Download Time |
Content Download Duration |
|
Server Time |
Server Processing Duration |
With the help of these detailed metrics, you can quickly get to the root-cause of the poor responsiveness of your AJAX requests.
However, note that a few rules apply to the display of detailed load time metrics for AJAX requests. Even if the Enable AJAX Correlation flag is turned on, eG RUM will be able to report the detailed load time split-up of an AJAX request, only if:
- The URL of that AJAX request, as determined by eG RUM, exactly matches with the URL captured by the ResourceTiming API;
- The time of the AJAX request in eG RUM is at least close to the request time captured by the ResourceTiming API
- The AJAX request is well within the maximum number of resource requests a browser can handle
If even one of the aforesaid conditions is not fulfilled, then, though the Enable AJAX Correlation flag is set to Yes, the RUM Transaction Details page will report only four metrics, namely - Total page load time, Average server time, Average content download time, and Ajax callback time (see Figure 20). The Related Resource Details page will also not provide any additional diagnostics.
Sometimes, more than one AJAX request processed at around the same time may have the same URL. At such times, eG RUM may find more than one match for an AJAX request's URL in the Resource Timing API. In this case again, even if the Enable AJAX Correlation flag is set to Yes, the RUM Transaction Details page will report only the four metrics mentioned above - i.e., Total page load time, Average server time, Average content download time, and Ajax callback time. However, the Related Resource Details page will display all the matching/related URLs. You can click on the 'magnifying glass' icon alongside a URL in the Related Resource Details page to view the detailed response time break-up for that URL.
eG RUM-BTM Integration
eG RUM is capable of capturing the slow/stalled user transactions to a web site/application, and accurately diagnosing the root-cause of poor user experience with that transaction - is it due to a problematic browser client? a flaky network? or lethargic server-side processing? If you want to know what problem at the server end is impacting user experience and why, you will have to use eG's Business Transaction Monitor (BTM) in conjunction with eG RUM. To use eG BTM, you need to BTM-enable the server infrastructure delivering the monitored web site/application.
If the backend application server of a RUM-enabled web application has been instrumented for business transaction monitoring, then eG RUM can seamlessly integrate with eG BTM to provide valuable, end-to-end insights into transaction performance.
This is how the eG RUM-BTM integration works.
- eG RUM assigns a unique identifier to every page view request it receives from the user for the target web application, via the web browser.
- When such a page view request reaches the eG BTM-enabled backend application server for processing, eG BTM assigns another identifier to that request on the backend system
- Once the application server successfully processes the page view request, it will return a response to the browser.
- The unique ID that eG BTM assigns to the request is communicated to the browser along with this response. This ID will be included in the response header (EGRUM_BTM) in case of AJAX requests, and a cookie (EGRUM_BTM) in the case of base and iFrame requests.
- eG RUM retrieves this ID from the browser and then maps this ID to the eG RUM page view ID. This way, eG RUM links a page view request with two IDs - an eG RUM-assigned ID and an eG BTM-assigned ID. This mapping is stored and maintained in the eG database.
- When you zoom into a URL in the Detailed Diagnosis page, the RUM Transaction Details page opens, where the transaction flow and the load time metrics that eG RUM captures are graphically represented. At this juncture, the eG manager checks the eG database for IDs that are mapped to the URL in question.
-
If the eG manager finds that the URL is mapped to an eG BTM ID as well, it instantly figures out that server-side performance insights are also available for the target URL.
Note:
As indicated by step 4 above, eG BTM employs cookie and response header to communicate the server-side transaction ID to eG RUM. Typically, if the monitored web site/application is SSL-enabled, then a 'secure' cookie is dropped. However, note that regardless of whether/not the target application is secure, eG BTM does not turn on the HttpOnly flag of the EGRUM_BTM cookie. This is done only to enable eG RUM to read the server-side ID from the cookie. Note that this setting will not compromise the functionality, performance, or security of the target web site/application.
To allow users 'single-click' access to these metrics, a 'magnifying glass' icon is made available alongside the Server Time metric in the RUM Transaction Details page of the transaction (see Figure 25). If the RUM Transaction Details page reveals that lazy server side processing is the reason for the slowness of a user transaction, you can click on this 'magnifying glass' icon to view the metrics that eG BTM collects and reports for that transaction from the server side.
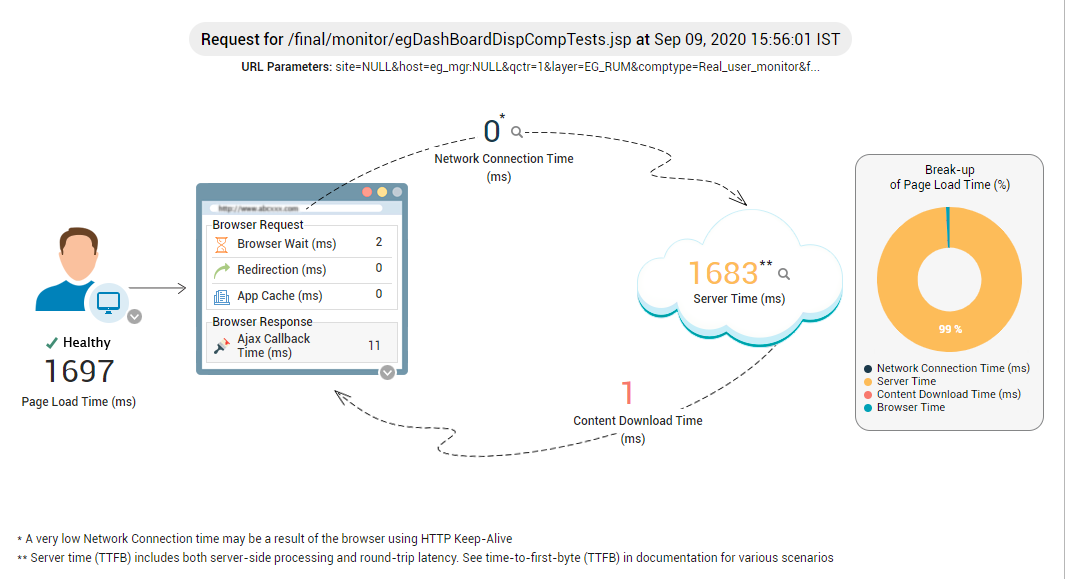
Figure 25 : Clicking on the 'magnifying glass' icon alongside Server Time to view the transaction flow topology discovered by eG BTM
Clicking on the 'magnifying glass' in Figure 25 will invoke Figure 26, which reveals the cross-application flow of that transaction. eG BTM is capable of tracing the complete path of a transaction on the server-side. This path is presented as the cross-application transaction flow (see Figure 26). Additionally, eG BTM measures the time spent by that transaction on each server in its path and also the time it took to process external service calls (including SQL queries). Figure 26 reveals these computations also.
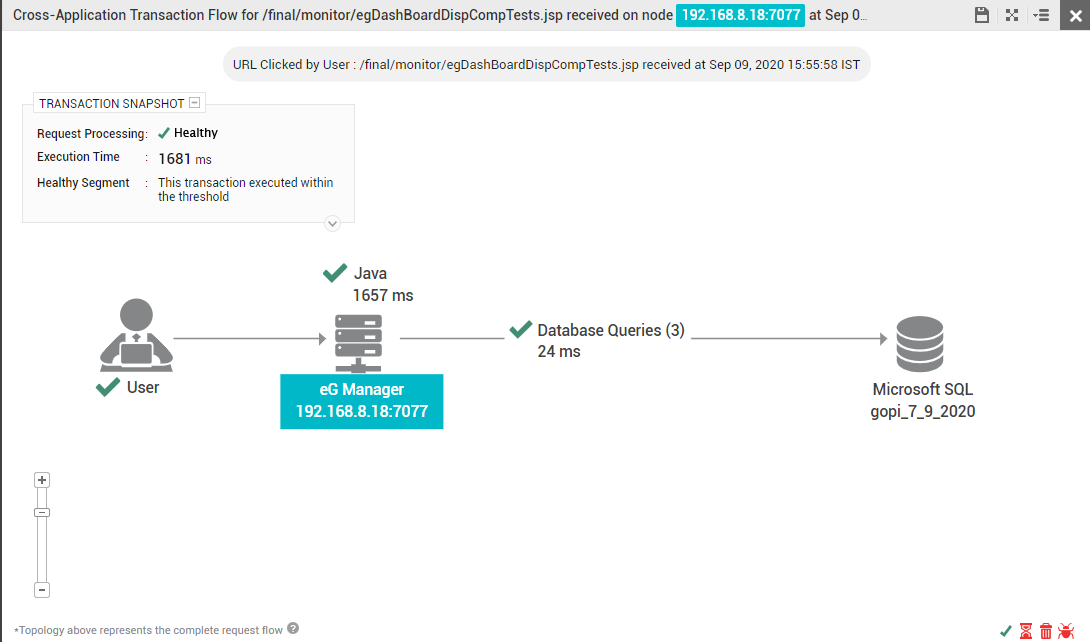
Figure 26 : eG RUM-BTM integration revealing the cross-application flow of a monitored transaction
With the help of the time metrics displayed and the intuitive color-codes used in the cross-application transaction flow, you can easily and accurately isolate where on the server side a user transaction slowed down and why. You can also drill-down from the point cuts and service calls in the transaction flow (see Figure 26) to view and analyze additional diagnostics that eG BTM reports. These analytics will point you to the precise queries, errors, and method calls that may have adversely impacted transaction performance.
eG BTM can work with web applications built on the Java / .NET / PHP frameworks. RUM-BTM integration is available for Java and .NET frameworks only. For more details on eG BTM, refer to the following documents:
Java Business Transaction Monitoring
.NET Business Transaction Monitoring
PHP Business Transaction Monitoring
Error Details Page
Now, if you click on an Error request in the detailed diagnosis, you will not only be able to view the path of that request in the RUM Transaction Details page, but you will also be able to view the precise error(s) that the page in question encountered, in the Error Details tab page (see Figure 27).
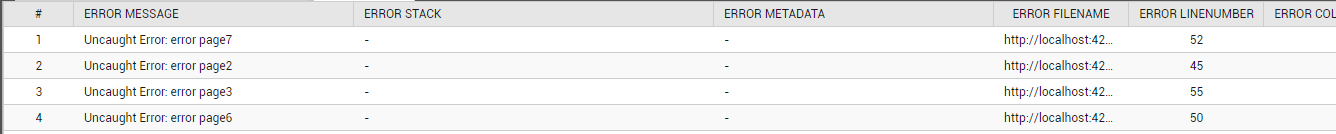
Figure 27 : Errors displayed in the Error Details tab page
Related Transactions
If you click on the Related Transactions tab page, you will receive a comprehensive comparison of frontend and backend performance for a request, highlighting load and response times along with all related transactions involved in the page execution (see Figure 28).
![]()
Figure 28 : Related Transaction Details tab page
This analysis will help you quickly and accurately pinpoint what is slowing down a request - the frontend? or the backend?
Waterfall Analysis
The Webpage Resource Waterfall is a visualization of how a webpage loads all its resources (such as HTML, CSS, JavaScript, images, fonts, etc.) over time.
The Waterfall Analysis tab page (see Figure 29), when clicked, presents this resource waterfall. Here, each resource is represented as a bar on a timeline, showing when it was requested, how long it took to load, and the sequence of loading steps. The time taken to complete each step is also indicated by the bar, with each step represented by a different color. A quick look at the waterfall will hence reveal, which resource is taking the longest to load and which step is slowing down the resource loading.

Figure 29 : Categorized Waterfall Analysis
By default, the Waterfall Analysis tab page provides a Categorized view of resources. Accordingly, the Categorized option is chosen by default in Figure 4. In this case, resources are categorized based on type and then listed.
You can also configure the waterfall to indicate how visual metrics such as First Contentful Paint time, Speed Index, and First Paint Time are faring. For that, select the Visual Metrics check box. Once this is done, the waterfall view will change to display a dotted line each for every visual metric (see Figure 30). You can hover your mouse pointer over any dotted line to view all visual metrics and their values (see Figure 31).

Figure 30 : Dotted lines in the Waterfall view to indicate visual metrics

Figure 31 : Visual metrics and values displayed upon mouse hover
If you want the waterfall to indicate the time spent by a resource at each phase of the page's lifecycle, then select the Page Lifecycle Metrics check box in Figure 31. The waterfall will now change to display dotted lines for each phase (see Figure 32). You can hover your mouse pointer over a dotted line to view all the phase metrics and their values (see Figure 33).

Figure 32 : Waterfall displaying page lifecycle phase metrics

Figure 33 : Phase metrics displayed in waterfall upon mouse hover
If you click on the Waterfall option in Figure 33, you will be able to visualize the loading duration of resources and set priorities for optimizing them.

Figure 34 : Clicking on the Waterfall option