Applications-Usage by Servers Report
When planning the future capacity of their critical Citrix server farms, administrators need to consider how the applications published on the farm have been utilized in the past, so that the future load on the farm can be accurately predicted, load-balancing rules appropriately changed, and capacity decisions accordingly taken. The Applications-Usage by Servers Report provides administrators with the application usage insights that they require for taking these crucial capacity decisions. With the help of this report, administrators can tell:
- The total number of instances of an application that were accessed by users to the farm in the specified timeline;
- The number of requests for a chosen application that were serviced by each server in the farm during the said timeline
Besides revealing the total load (in terms of usage) an application generated on the farm during the given timeline, this report also sheds light on load-balancing irregularities in the farm, which will have to be looked into to maximum farm performance.
To generate this report, do the following:
- Select the Usage by Servers option by following the menu sequence: REPORTS BY FUNCTION -> Domain-specific Reports ->Virtual Applications / Desktops -> Applications
-
When Figure 1 appears, do the following:
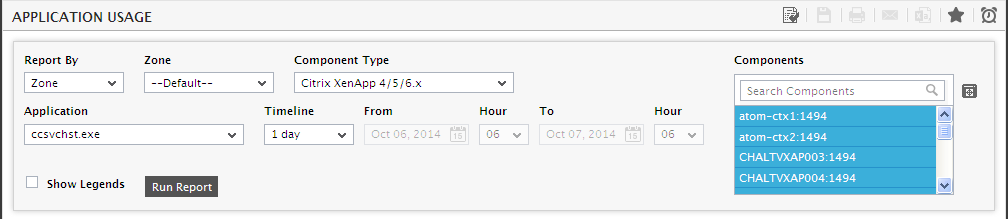
Figure 1 : Generating the Applications - Usage by Servers report
-
Select a criterion for analysis from the Report By list box. Using this report, you can analyze the application utilization on one/more independent virtualized components, or those that are part of a segment, service, or a zone. This way, you can assess the utilization impact of the applications hosted on the virtual components of a particular service/segment/zone, and accordingly take decisions. The options provided by the Report By list box are discussed hereunder:
- Component:Select this option to choose the component(s) from across all the managed components in the environment. For instance, for a report on the utilization of the application hosted on all the managed vSphere VDI hosts in the environment, select VMware vSphere VDI from the Component Type list, select Component from the Report By list, and then select all the virtual hosts listed in the Components list of Figure 1. If the Components list consists of too many components, then viewing all the components and selecting the ones you need for report generation could require endless scrolling. To avoid this, you can click the
 button next to the Components list. The COMPONENTS pop up window will then appear using which you can view almost all the components in a single interface and Select the ones for which the report is to be generated. You can narrow your search further by using the Search text box. Specify the whole/part of the component name to search for in this text box, and click the
  icon next to it.
 - Service: Select this option if the components for which a report is to be generated are involved in the delivery of a business service. Then, select a Service.
- Segment: Choose this option if the virtual hosts to be evaluated are part of a segment. Then, pick a Segment for analysis.
- Zone: Pick this option for a report on the performance of virtual components that are included in a zone. Then, choose a Zone. If no zones have been configured in your environment, then all the managed servers in the environment will be automatically grouped under a zone named Default; in such cases therefore, select the Default zone.
- Component:Select this option to choose the component(s) from across all the managed components in the environment. For instance, for a report on the utilization of the application hosted on all the managed vSphere VDI hosts in the environment, select VMware vSphere VDI from the Component Type list, select Component from the Report By list, and then select all the virtual hosts listed in the Components list of Figure 1. If the Components list consists of too many components, then viewing all the components and selecting the ones you need for report generation could require endless scrolling. To avoid this, you can click the
- Pick the Component Type for which this report is to be generated from this list.
-
If Citrix XenApp/Citrix XenApp4/5/6.x is chosen from the Component Type list, then an additional Worker Group list box will appear. Worker groups are collections of XenApp servers, residing in the same farm, that are managed as a single unit. You can publish applications to a worker group. Select a worker group from this list if you wish to view the usage of a User belonging to that particular worker group. By default, Any option is selected from this list.
Note:
The Worker Group list box will appear only if the SHOW WORKER GROUPS flag is set to Yes while configuring the Citrix Applications test.
- All components of the chosen type will then be listed in the Components list box. Select the servers for which this report is to be generated. If the Components list consists of too many components, then viewing all the components and selecting the ones you need for report generation could require endless scrolling. To avoid this, you can click the button next to the Components list. A COMPONENTS pop up window will then appear using which you can view almost all the components in a single interface and Select the ones to be included for generating the report.
- This will populate the Application drop-down with all applications published on the chosen servers. Select the application, the usage of which is to be analyzed by this report.
-
Then, specify the Timeline for the graph. You can either provide a fixed time line such as 1 hour, 2 days, etc., or select the Any option from the list to provide a From and To date/time for report generation.
Note:
- The default Timeline can be set using the consolidated reports page in the eG administrative interface; to access this page, follow the menu sequence: Configure -> Reports -> Consolidated. For more details regarding this page, refer to Section 3.1.5.4 of this manual.
-
Shorter the Timeline for a report, lighter would be the query that is executed on the database, and faster the report generation. Report Timelines that run across many weeks therefore, cause excessive strain on the database, thus slowing-down report generation. To save the eG backend from injury, eG Enterprise automatically restricts the maximum Timeline for which a thin client report can be generated to the lower of the following values:
- the value of the CtxLoginTest parameter in the [ddd_cleanup] section of the eg_format.ini file (in the <EG_INSTALL_DIR>\manager\config directory)
- the value of the MaxTimeline parameter in the [misc] section of the eg_report.ini file (in the <EG_INSTALL_DIR>\manager\config directory).
-
The maximum timeline for which the current user to eG Reporter is permitted to generate reports;
The [ddd_cleanup] section is where you define the interval (in days) at which the detailed diagnosis of specific tests is to be purged from the database. For the CtxLoginTest, the default interval is set to 32 days (i.e., just over a month), indicating that, by default, the detailed diagnosis of the CtxLoginTest is cleared from the database at the end of every month. Since critical thin client reports are generated based on the detailed diagnosis information, a Timeline that exceeds the duration set against CtxLoginTest would result in a report that displays invalid/no data. This duration however, is configurable. Similarly, you can also configure a MaxTimeline in the [misc] section of the eg_report.ini file. By default, this parameter is set to 168 (hours), indicating that the maximum Timeline for a thin client report is 1 week (i.e., 24 * 7 = 168 hours). Also, while creating user profiles using the eG administrative interface, an administrator can indicate the maximum timeline for which that user can generate reports, so as to avoid long running reports. Now, assume that you have set the CtxLoginTest parameter to 21 days (i.e., 3 weeks) and the MaxTimeline parameter to 336 hours (i.e., 2 weeks). Also, say that user john with access rights to eG Reporter has been configured to generate reports for a maximum timeline of 1 week. Therefore, whenever user john logs into eG Reporter and attempts to generate a thin client report, eG Enterprise compares the three values, picks the lowest of the three, and sets that value as the maximum Timeline for thin client reports. In our example, the maximum timeline settings of user john (i.e., 1 week) is the lowest Therefore, the maximum value that will be available for selection from the Fixed Timeline list box in the thin client report page will be 1 week. Note that this timeline restriction does not apply to fixed timeline settings alone. If a user chooses the Any option from the Timeline list and proceeds to provide a start date and end date for report generation using the From and To specifications, eG Enterprise will first check if the user's Timeline specification is equal to or below the lowest of the three values discussed above. If not, report generation will fail. For instance, for a user who is allowed to generate reports spanning over a maximum period of 3 days only, the difference between the From and To dates should never be over 3 days. If it is, then, upon clicking the Run Report button a message box will appear, prompting the user to change the From and To specification.
-
In addition to the settings discussed above, this report comes with a set of default specifications. These settings are hidden by default. If you do not want to disturb these default settings, then you can proceed to generate the report by clicking the Run Report button soon after you pick an Application. However, if you want to view and then alter these settings (if required), click on the
 button. The default settings will then appear in the MORE OPTIONS drop down window (see Figure 2). The steps below discuss each of these settings and how they can be customized.
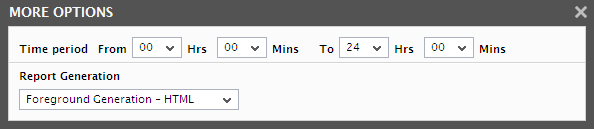
Figure 2 : The default settings for generating an Application usage report for a thin client component
-
Specify the start time and end time for report generation against the Time period field (see Figure 10.51).
Note:
The default Time period to be displayed here can be configured using the consolidated reports page in the eG administrative interface; to access this page, follow the menu sequence: Settings -> Reporter -> Consolidated Reports. For more details regarding this page, refer to Section Consolidated Reports of this manual.
-
In large environments, reports generated using months of data can take a long time to complete. Administrators now have the option of generating reports on-line or in the background. When a report is scheduled for background generation, administrators can proceed with their other monitoring, diagnosis, and reporting tasks, while the eG manager is processing the report. This saves the administrator valuable time. To schedule background processing of a report, select the Background Save - PDF option from the Report Generation list. In this case, a Report Name text box will appear, where you would have to provide the name with which the report is to be saved in the background. To process reports in the foreground, select the Foreground Generation - HTML option from this list.
Note:
- The Report Generation list will appear only if the EnableBackgroundReport flag in the [BACKGROUND_PROCESS] section of the eg_report.ini file (in the <EG_INSTALL_DIR>\manager\config directory) is set to Yes.
- The default selection in the Report Generation list will change according to the Timeline specified for the report. If the Timeline set is greater than or equal to the number of days specified against the MinDurationForReport parameter in the [BACKGROUND_PROCESS] section of the eg_report.ini file, then the default selection in the Report Generation list will be Background Save - PDF. On the other hand, if the Timeline set for the report is lesser than the value of the MinDurationForReport parameter, then the default selection in the Report Generation list will be Foreground. This is because, the MinDurationForReport setting governs when reports are to be processed in the background. By default, this parameter is set to 2 weeks - this indicates that by default, reports with a timeline of 2 weeks and above will be processed in the background.
-
Finally, click the Run Report button to generate the report.
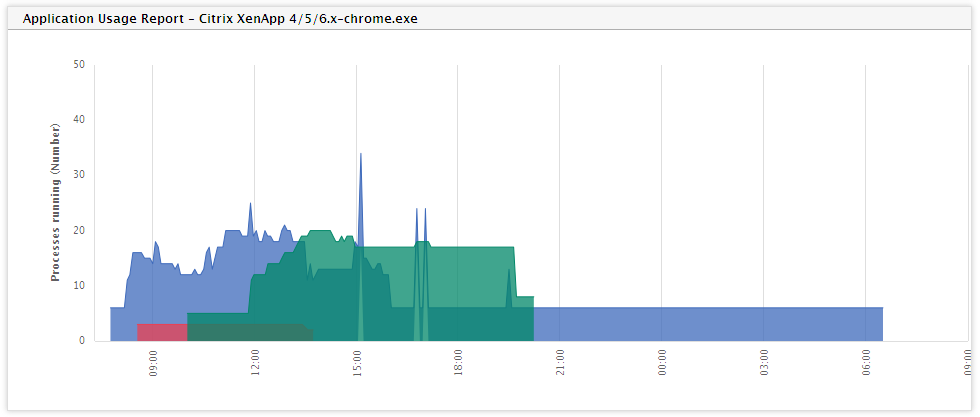
- The report in Figure 3 plots the cumulative values of the number of instances of the chosen application that were accessed by users to the farm during the given timeline. As you can see, this report plots values in a 'stack format', so that users can easily determine total usage and per-server usage in a single glance.