Consolidated Reports
The Consolidated Analysis reports option that the eG Reporter includes, provides a bird's eye view of infrastructure performance. While detailed graphs are ideal for analyzing performance of one server or application or device in detail, what IT operators of large infrastructures need to be able to see is a quick comparison of performance across the servers in their infrastructure.
The comparison should span multiple metrics so that the IT operators can get at a glance consolidated view of their infrastructure. The consolidated reports option addresses this requirement. Using this capability, IT operators can quickly determine if there are hot-spots in their infrastructure, whether the load balancing is working as expected, etc. Comparison of these reports over time can provide key indications regarding performance trends.
eG enterprise uses the grouping of servers as a Zone to define the scope of a consolidated report. Choosing the Zone option, allows a consolidated report to be defined comparing all the servers in the Zone. The Server option summarizes the performance of one of the components of the infrastructure.
Besides the above, eG Reporter provides the Citrix / VDI Reports category that addresses the unique monitoring requirements of thin client environments. This category provides valuable insights into different aspects of a thin client infrastructure’s performance.
In order to enable you to focus on the critical/hyper-sensitive attributes of server/zone performance, eG Enterprise allows you the flexibility to choose the measures that are to be displayed in a Zone or Server Consolidated Report. In addition, the default Time period, Timeline, and Weekend settings for Consolidated and Thin Client reports can also be set.
To achieve the above, do the following:
- Select the Consolidated Reports option from the Reporter menu of the Settings tile in the eG administrative interface.
-
Select a Report type from Figure 1 that appears. By default, Zone is selected. The other options are: Server, Thin Client Session, Thin Client Application, and Thin Client User. The Thin Client reports are relevant for Citrix and Terminal server environments.
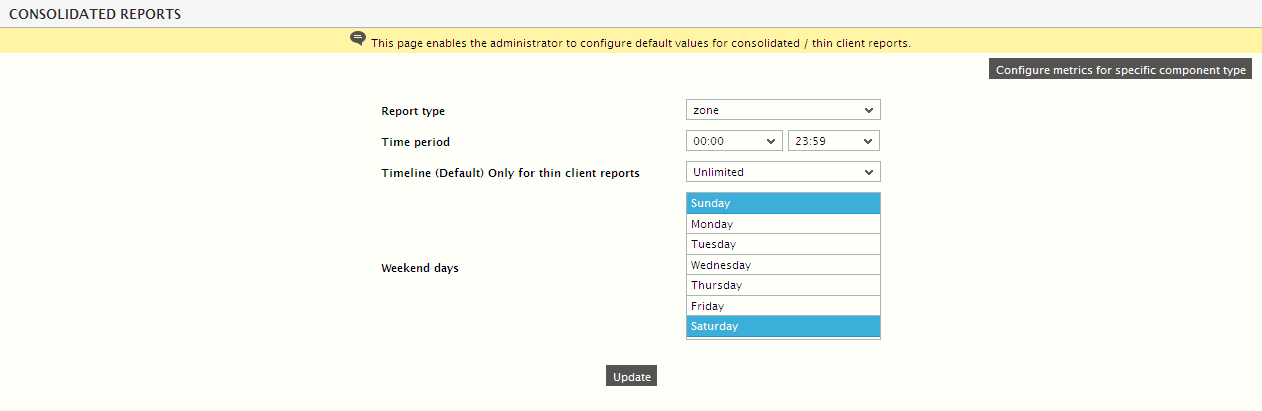
Figure 1 : Defining the Consolidated and Citrix/VDI Report Defaults
- Next, indicate the default Time period that is to be set for the chosen Report type.
- Similarly, the default Timeline setting for the Report type can also be specified. However, this setting applies to Thin client reports only.
- Additionally, from the Weekend days list, you can select the days of the week that constitute a "weekend".
- To save the configurations, click on the Update button in Figure 1.
- Next, proceed to configure the measures to be displayed in the Consolidated Reports, by clicking on the Click here hyperlink at the top of Figure 1.
-
Figure 2 then appears. First, select the Report type (the options are Zone and Server) for which measures are to be configured. The default selection is Zone. If the Report Type is Zone, then follow the steps given below:
-
Choose the Component type for which the Zone report is to be generated. By default, the Default (All Components) option is chosen here.
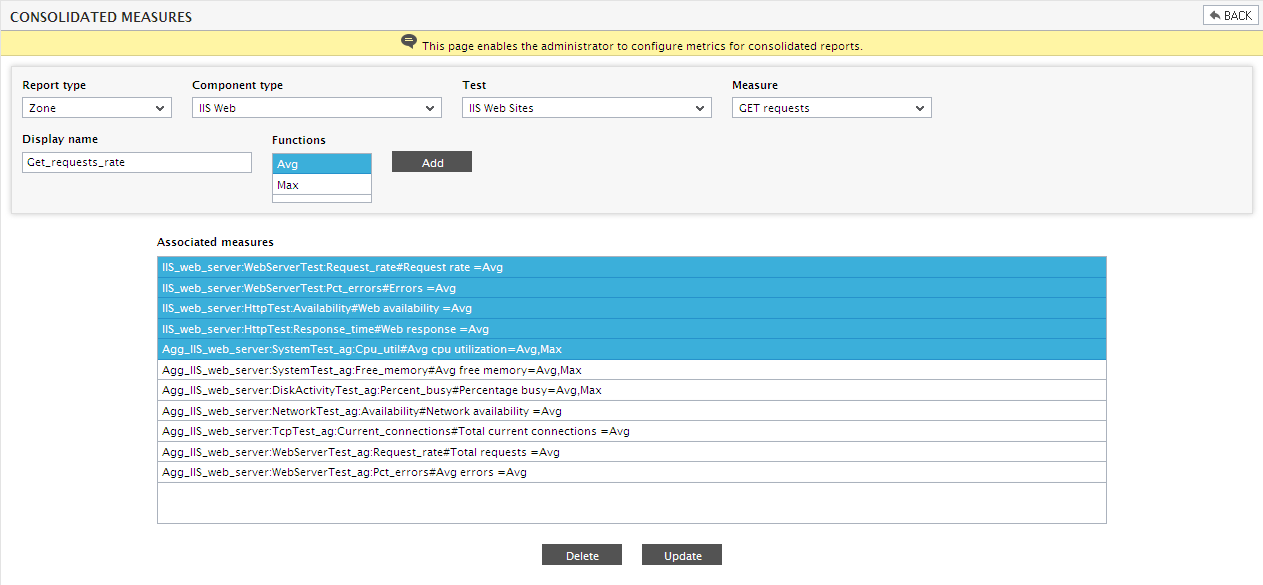
Figure 2 : Selecting the measures to be displayed in a Consolidated Zone report
- Next, select the Test to which the measures to be displayed in the report pertain.
-
Choose a Measure and provide a Display name for the measure in the report. If a Display name is not provided, then the Measure name automatically becomes the Display name.
Note:
Measures that are associated with the Default (All Components) option will not be available for selection while configuring measures for any other Component type.
-
Then, pick the functions to be applied to the values of the chosen Measure. Multiple functions can be simultaneously selected. By default, the Avg and Max functions are available for selection. To add more functions to the list, do the following:
- Edit the eg_report.ini file in the <EG_INSTALL_DIR>\manager\config directory.
- By default, the Function list in the [ZONE_REPORT]section of the file will be set to Avg and Max. You can, if you so desire, append more functions to the list, or remove any of the existing functions.
- Finally, save the file.
- Finally, add the specification by clicking on the Add button. The complete specification will then get added to the Associated Measures list. Similarly, multiple specifications can be added to the list.
-
For the default Component type, Default (All Components), a few specifications pre-exist in the Associated Measureslist (see Figure 3). You can add more measures to this list, if required. This default list automatically applies to all managed component-types. If measures are configured for a particular component-type, then such measure configurations will only be appended to the default configurations.
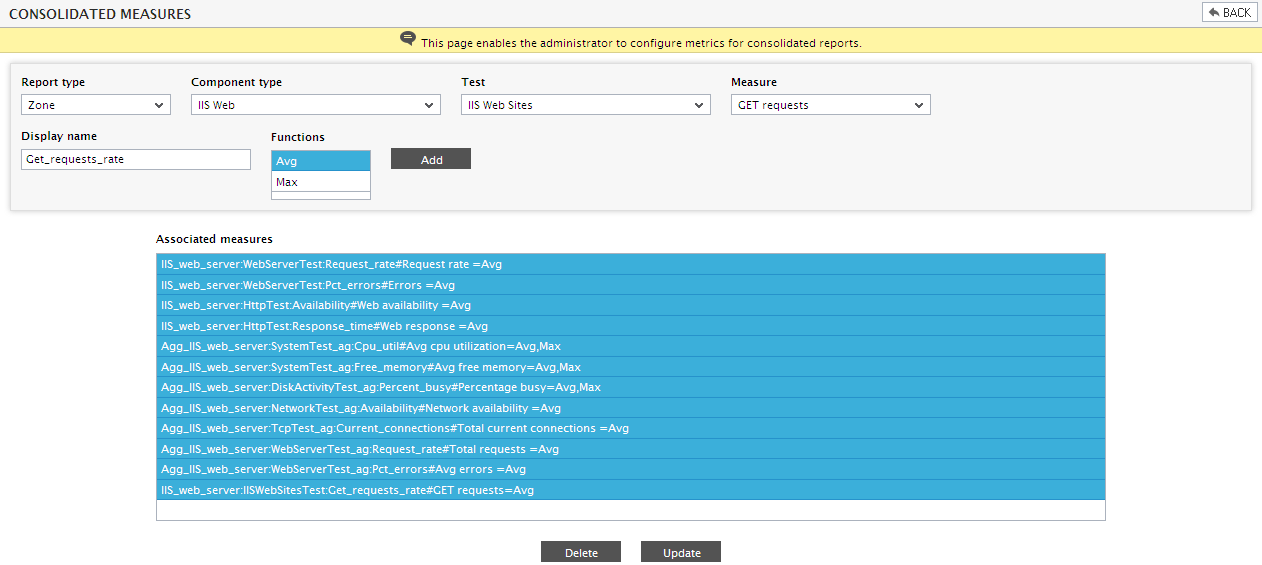
Figure 3 : Measures associated with the Default Component type
-
-
Now, if the Report type is Server, then proceed in the following manner:
-
Select the Test to which the measures to be displayed in the report pertain (see Figure 4).
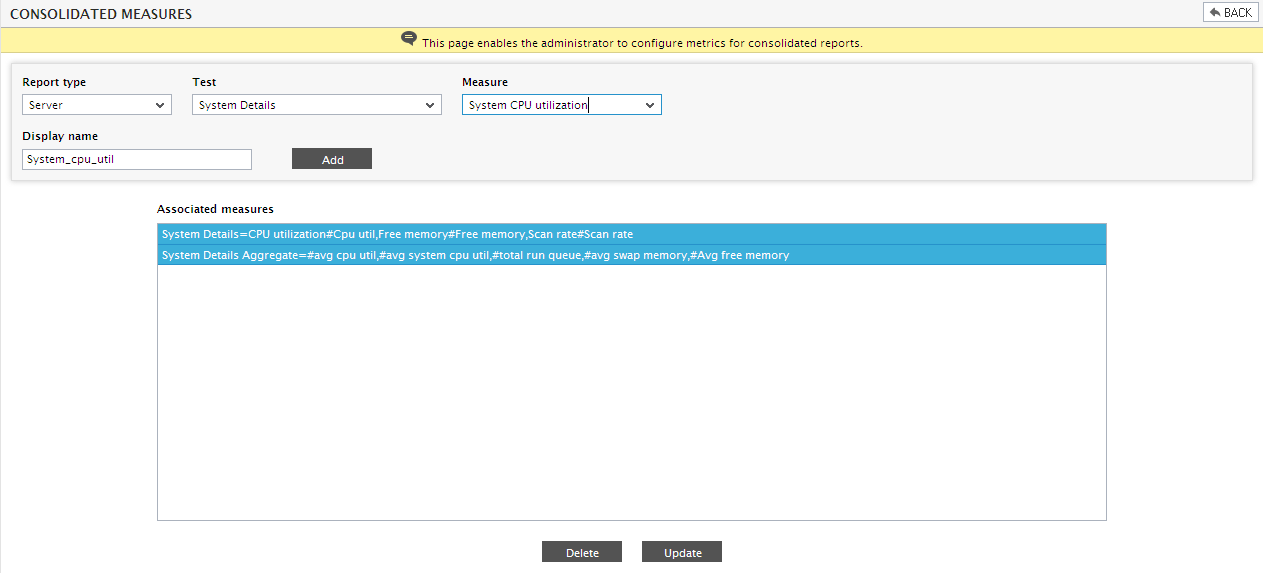
Figure 4 : Selecting the measures to be displayed in a Consolidated Server report
- Choose a Measure and provide a Display name for the measure in the report. If a Display name is not provided, then the Measure name automatically becomes the Display name.
- Finally, add the specification by clicking on the Addbutton. The complete specification will then get added to the associated measures list. Similarly, multiple specifications can be added to the list.
-
- To delete an entry from the Associated Measures list, select it and click the Delete button.
- To save the changes, click the Update button in Figure 4.