Server Performance Report
To simplify individual server monitoring, eG Enterprise offers the Server Performance Report, where the critical performance results of a particular server are aggregated over time and made available. Here, administrators can configure the measures that need to appear in the report and also compute specific values such as average, maximum, minimum etc., so that they are provided with more actionable information on server performance.
To view a Server Performance report, do the following:
- Select the Server Performance option from the App / Infra KPIs node of the REPORTS BY FUNCTION tree.
-
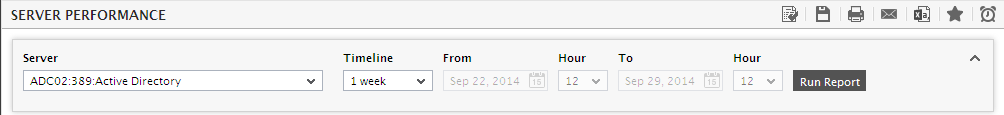
Figure 1 will then appear. To monitor a specific server, select the Server from the list.
-
Specify the report Timeline. You can either provide a fixed time line such as 1 hour, 2 days, etc., or select the Any option from the list to provide a From and To date/time for report generation.
Note:
For every user registered with the eG Enterprise system, the administrator can indicate the maximum timeline for which that user can generate a report. Once the maximum timeline is set for a user, then, whenever that user logs into eG Reporter and attempts to generate a report, the Timeline list box in the report page will display options according to the maximum timeline setting of that user. For instance, if a user can generate a report for a maximum period of 3 days only, then 3 days will be the highest option displayed in the Timeline list - i.e., 3 days will be the last option in the fixed Timeline list. Similarly, if the user chooses the Any option from the Timeline list and proceeds to provide a start date and end date for report generation using the From and To specifications, eG Enterprise will first check if the user's Timeline specification conforms to his/her maximum timeline setting. If not, report generation will fail. For instance, for a user who is allowed to generate reports spanning over a maximum period of 3 days only, the difference between the From and To dates should never be over 3 days. If it is, then, upon clicking the Run Report button a message box will appear, prompting the user to change the From and To specification.
-
In addition to the settings discussed above, this report comes with a set of default specifications. These settings are hidden by default. If you do not want to disturb these default settings, then you can proceed to generate the report by clicking the Run Report button soon after select a Server. However, if you want to view and then alter these settings (if required), click on the
 icon. The default settings will then appear in the More Options drop down window (see Figure 2). The steps below discuss each of these settings and how they can be customized.
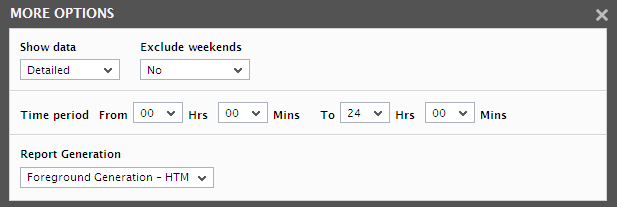
Figure 2 : The default settings for generating a Server Performance report
-
The speed with which a report is generated depends primarily on the report Timeline. While a Timeline that varies between a couple of days to a week enables the eG Enterprise system to quickly retrieve the required data, timelines that span multiple weeks/months could slow-down the data retrieval and report generation process to a considerable extent, owing to the volume of data involved. In order to ensure quick and easy access to reports, eG Enterprise provides you the option of enabling data retrieval from the Trend information in the database, instead of the Detailed test information that is used by default for report generation. The Detailed test information base comprises of multiple measurement records for a test - one or more each for every test execution. Whereas, the Trend information includes only hourly, daily, and monthly summary computations for a test performed on a continuous basis. For instance, during a period of 1 hour, a test that runs every 5 minutes inserts atleast 12 records into the Detailed test information base. On the other hand, the Trend information base would consist of only 1 record for the same 1 hour period. Fewer the number of records, query execution becomes much quicker, and data retrieval faster. To use the trend data for report generation, you will have to select the Trend option from the Show Data field in Figure 2. By default, the Detailed option is selected in Figure 2 indicating that the report data is retrieved from the detailed test information in the database. If need be, you can also ensure that all reports always use the Detailed test tables alone by hiding the Show Data field from the reporter interface. To achieve this, do the following:
- Login to the eG administrative interface as 'admin'.
- Select the Manager option from the Settings tile that appears when the
 button against the Admin tab is clicked.
 -
From the GENERAL SETTINGS page that then appears, if you set the Compute average/sum of metrics while trending flag to No, then the Show Data field will not appear in the reporter interface; this denies users access to the Trend option, and thus ensures that reports are always generated using the Detailed tables.
Note:
- A Trend report will not include the data for the current day since trend data is only computed at the end of the day.
- If the Trend option is chosen, the time period of the report should be greater than 1 day.
-
The usage of Detailed test tables for generating reports, especially those that span weeks, increases the stress on the eG database, thus resulting in undue delays in report generation. In order to ensure that the database is not choked by such voluminous data requests, you can configure eG Enterprise to automatically "force" the use of the Trend option if the Timeline of a report exceeds a pre-configured duration. To specify this time boundary, do the following:
- Edit the eg_report.ini file in the <EG_INSTALL_DIR>\manager\config directory.
- In the [MISC] section of the file, you will find a DetailedTime parameter.
- Specify the duration (in days) beyond which Detailed reports cannot be generated, against the DetailedTime parameter, and save the eg_report.ini file.
- For instance, to make sure that Detailed reports are disallowed for a Timeline of over 2 weeks, set the DetailedTime parameter to 14 and save the file.
- Say, subsequently, you attempt to generate a Detailed report for a Fixed Timeline of 3 weeks (which is greater than the 14-day limit set in our example). The instant you select the 3 weeks option from the Fixed list box, the Detailed option gets automatically disabled, and the Trend option gets enabled. Similarly, if you specify an Any Timeline that runs over 14 days, then, upon clicking the Run Report button to generate the report, a message box appears (see Figure 8) informing you that only the Trend option is permitted.
- To proceed with the Trend report generation, click the OK button in the message box. To terminate Trend report generation, click the CANCEL button.
-
Specify the start time and end time for report generation in the Time period field.
Note:
The default Time period to be displayed here can be configured using the consolidated reports page in the eG administrative interface; to access this page, follow the menu sequence: Settings -> Reporter -> Consolidated Reports. For more details regarding this page, refer to Consolidated Reports of this manual.
-
If the timeline specified for the report needs to exclude the data collected during the Weekends, then set Exclude weekends to Yes. If not, select No.
Note:
You can configure the days of the week that need to be considered as a ‘weekend’ using the consolidated reports page in the eG administrative interface; to access this page, follow the menu sequence: Settings -> Reporter -> Consolidated Reports. For more details regarding this page, refer to Section Consolidated Reports of this manual.
-
In large environments, reports generated using months of data can take a long time to complete. Administrators now have the option of generating reports on-line or in the background. When a report is scheduled for background generation, administrators can proceed with their other monitoring, diagnosis, and reporting tasks, while the eG manager is processing the report. This saves the administrator valuable time. To schedule background processing of a report, you can either select the Background Save - PDF option or the Background Save - CSV option from the Report Generation list. In this case, a Report Name text box will appear, where you would have to provide the name with which the report is to be saved in the background. To process reports in the foreground, select the Foreground Generation - HTML option from this list.
Note:
- The Report Generation list will appear only if the EnableBackgroundReport flag in the [BACKGROUND_PROCESS] section of the eg_report.ini file (in the [EG_INSTALL_DIR]\manager\config directory) is set to Yes.
- The default selection in the Report Generation list will change according to the Timeline specified for the report. If the Timeline set is greater than or equal to the number of days specified against the MinDurationForReport parameter in the [BACKGROUND_PROCESS] section of the eg_report.ini file, then the default selection in the Report Generation list will be Background Save - PDF. On the other hand, if the Timeline set for the report is lesser than the value of the MinDurationForReport parameter, then the default selection in the Report Generation list will be Foreground. This is because, the MinDurationForReport setting governs when reports are to be processed in the background. By default, this parameter is set to 2 weeks - this indicates that by default, reports with a timeline of 2 weeks and above will be processed in the background.
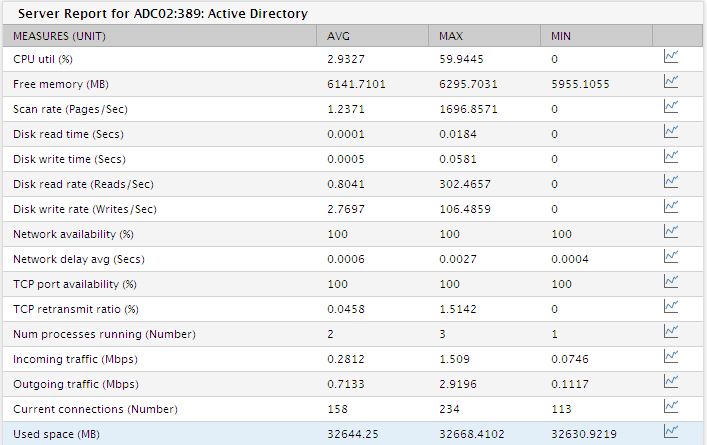
- Finally, click the Run Report button to generate the report. If the option chosen from the Report Generation list is Foreground Generation - HTML, then, clicking on the Run Report button will invoke Figure 3.
-
Figure 3 provides user-configured details about the chosen server.
-
To view the graph (see Figure 4) pertaining to a configured measure, click on the corresponding
 icon in Figure 3.
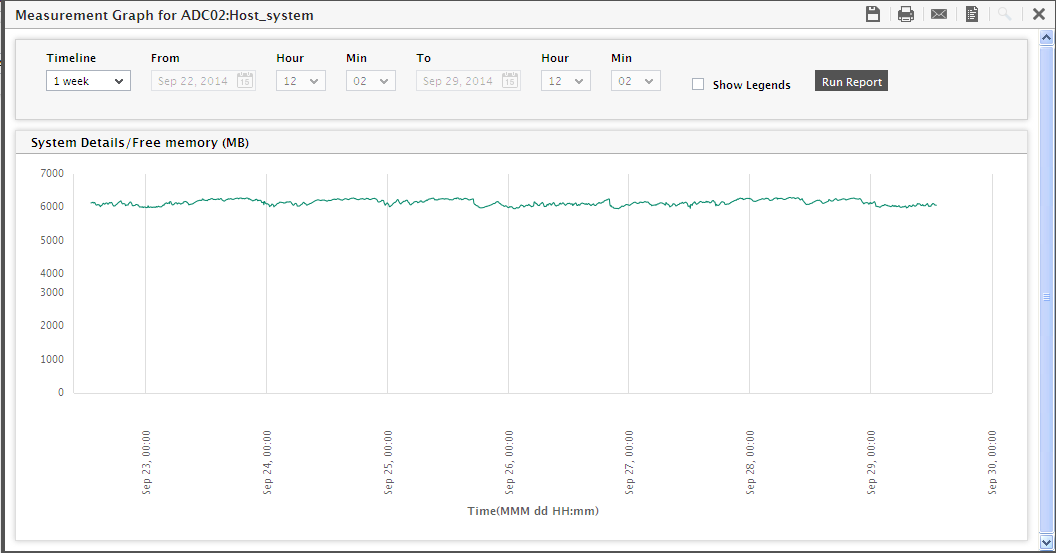
- On the other hand, if the Background Save - PDF option is chosen from the Report Generation list, then clicking on the Run Report button will not generate the report and display it in this page for your benefit. Instead, a message indicating that the report is being processed in the background will appear. This will be accompanied by a link that will lead you to the page that lists all the reports that are being processed in the background, and their current status. If background report generation fails for a report, you can regenerate that report using this page, or can even delete that report if need be. On the other hand, if background processing successfully completes for your report, then, you can view a PDF of the report by clicking on the PDF icon in that page.
-
If the Server chosen from Figure 1 is a virtual component such as a VMware ESX server, a Citrix XenServer, etc., then an additional Show virtual machine flag will appear as depicted by Figure 5.

Figure 5 : An additional 'Show virtual machine' flag appearing if the 'Server' chosen is a virtualized component
-
By default, the Show virtual machines flag is set to No, indicating that the resulting report reveals how the chosen virtual Server utilizes the resources available to it. If you want the server report to reveal the details of a particular VM on the chosen virtual Server, then set the Show virtual machines flag to Yes, and then select a VM from the Virtual Machine list that then appears. The resulting Server report will then reveal details pertaining to the resource usage by the chosen Virtual Machine and not the selected Server.
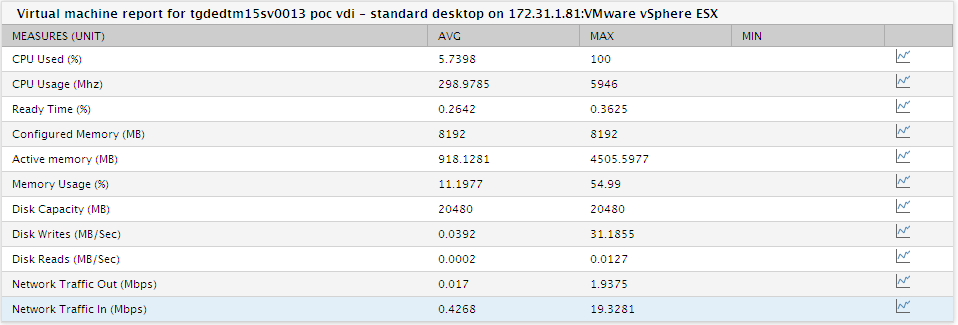
Figure 6 : A Server Performance report for a virtual machine
-
The information that appears in the server report is configurable. To configure the details, you will have to access the consolidated measures page in the eG administrative interface. To access this page, do the following:
- Select the Consolidated Reports option from the Reporter option of the Settings tile in the eG administrative interface.
- In the CONSOLIDATED REPORTS page that appears, click on the Configure metrics for specific component type button.
- The CONSOLIDATED MEASURES page then appears. To know how to configure measures for a Server Performance report using this page, refer to Section Consolidated Reports of this manual.