Service Level Analysis - By Component Report
Using the Service Level Analysis - By Component reports, you can receive an overview of the performance of a particular component during a specific period. To achieve the same, do the following:
- Select the By Component option from the Service Level Analysis sub node available under the Executive Reports node of the REPORTS BY FUNCTION tree (see Figure 1).
-
From the Component list box in the page that appears, select the component for which the executive summary report needs to be viewed (see Figure 1). If there are too many components in the list to choose from, you can narrow your search further by using the Filter by text box. Specify the whole/part of the component name to search for in this text box, and click the right-arrow button next to it. The Component list will then be populated with all component names that embed the specified search string. Select the component of your choice from this list.
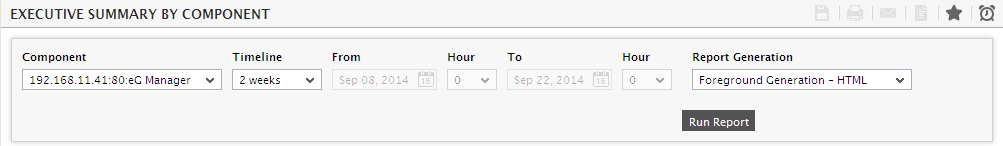
Figure 1 : Generating the Executive Summary By Component Report
-
Provide a Timeline for the report. You can either provide a fixed time line such as 1 hour, 2 days, etc., or select the Any option from the list to provide a From and To date/time for report generation.
Note:
For every user registered with the eG Enterprise system, the administrator can indicate the maximum timeline for which that user can generate a report. Once the maximum timeline is set for a user, then, whenever that user logs into eG Reporter and attempts to generate a report, the Timeline list box in the report page will display options according to the maximum timeline setting of that user. For instance, if a user can generate a report for a maximum period of 3 days only, then 3 days will be the highest option displayed in the Timeline list - i.e., 3 days will be the last option in the fixed Timeline list. Similarly, if the user chooses the Any option from the Timeline list and proceeds to provide a start date and end date for report generation using the From and To specifications, eG Enterprise will first check if the user's Timeline specification conforms to his/her maximum timeline setting. If not, report generation will fail. For instance, for a user who is allowed to generate reports spanning over a maximum period of 3 days only, the difference between the From and To dates should never be over 3 days. If it is, then, upon clicking the Run Report button a message box will appear, prompting the user to change the From and To specification.
-
In large environments, reports generated using months of data can take a long time to complete. Administrators now have the option of generating reports on-line or in the background. When a report is scheduled for background generation, administrators can proceed with their other monitoring, diagnosis, and reporting tasks, while the eG manager is processing the report. This saves the administrator valuable time. To schedule background processing of a report, you can either select the Background Save - PDF option or the Background Save - CSV option from the Report Generation list. In this case, a Report Name text box will appear, where you would have to provide the name with which the report is to be saved in the background. To process reports in the foreground, select the Foreground Generation - HTML option from this list.
Note:
- The Report Generation list will appear only if the EnableBackgroundReport flag in the [BACKGROUND_PROCESS] section of the eg_report.ini file (in the [EG_INSTALL_DIR]\manager\config directory) is set to Yes.
- The default selection in the Report Generation list will change according to the Timeline specified for the report. If the Timeline set is greater than or equal to the number of days specified against the MinDurationForReport parameter in the [BACKGROUND_PROCESS] section of the eg_report.ini file, then the default selection in the Report Generation list will be Background Save - PDF. On the other hand, if the Timeline set for the report is lesser than the value of the MinDurationForReport parameter, then the default selection in the Report Generation list will be Foreground. This is because, the MinDurationForReport setting governs when reports are to be processed in the background. By default, this parameter is set to 2 weeks - this indicates that by default, reports with a timeline of 2 weeks and above will be processed in the background.
-
Finally, click on the Run Report button to generate the report. If the option chosen from the Report Generation list is Foreground Generation - HTML, then, clicking on the Run Report button will invoke Figure 2.
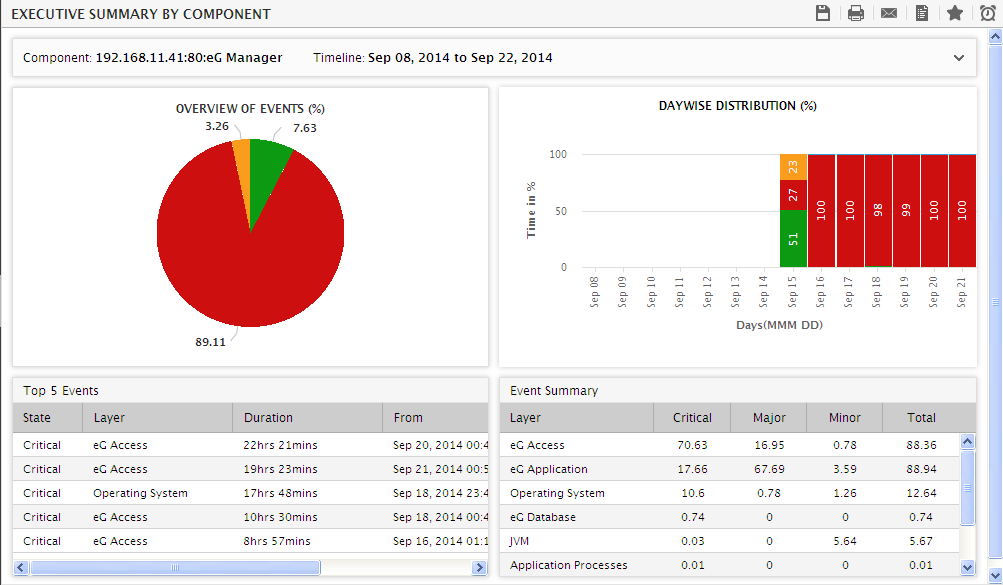
Figure 2 : The generated Service Level Analysis - By Component report
- There are four sections in the generated report. The first section is a pie chart that provides a bird's-eye view of the health of the component during the designated period. The slices of the pie chart and their respective colors represent the percentage of time the component has been in different states (Normal, Critical, Major, Minor, and Unknown).
-
To facilitate quick and accurate root-cause identification, the eG Reporter component includes a unique drill-down feature. To use this feature, click on a problem (Critical/Major/Minor) slice in the pie chart. This will lead you to the Snapshot Report of the chosen component (see Figure 3) for the chosen period. The snapshot will reveal the measures that were responsible for the problem conditions indicated by the slice clicked on. For more details on Snapshot Reports, refer to Measurement Snapshot Reports.
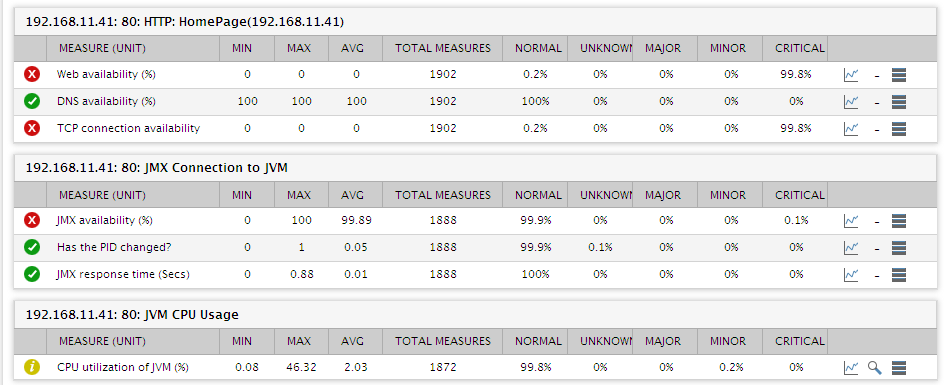
Figure 3 : The Snapshot that appears when a slice in the pie chart is clicked
-
The second section of the Service Level Analysis - By Component report depicts how well the component has performed on a daily basis during the specified period. The information depicted here enables an executive to detect the daily trends in the performance of the component. Here again, the various divisions within a bar and their respective colors denote the state variations in the component during the given period. The height of a division depends upon the duration (in minutes) for which the component has remained in a particular state.
Note:
By default, the DAYWISE DISTRIBUTION section of this page depicts the duration for which a component has remained in a particular state, in minutes. Instead, if you prefer to view the percentage of time during a day a component was in any particular state, set the Daywise distribution reports in flag in the MONITOR SETTINGS page (Configure -> Settings menu in the eG administrative interface) to Percentage.
-
If you click on a bar corresponding to a particular date, then, a Snapshot Report of the chosen component for that date will be displayed (see Figure 4).
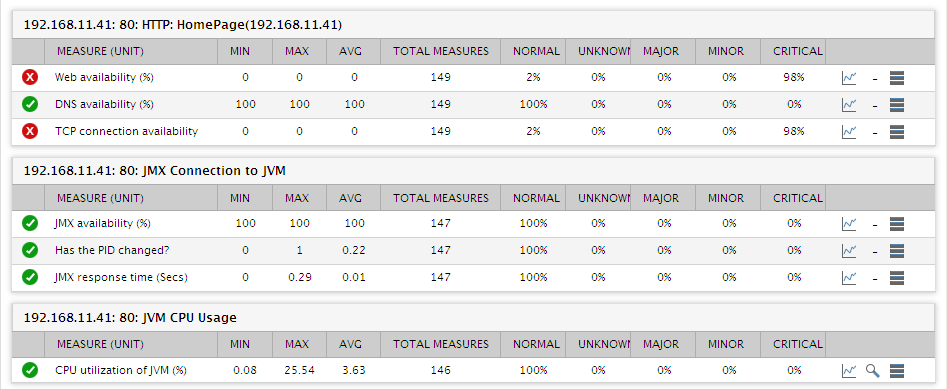
Figure 4 : The Snapshot Report which appears when the bar corresponding to a particular date is clicked
-
The third section of the Service Level Analysis - By Component report is a summary table that highlights the top five alarms that have remained for the longest duration. The details displayed include the alarm priority, the Layer in which the problem was detected, the Duration of the problem, the date and time of problem occurrence (From) and the date and time of problem resolution (To). This information will help an executive figure out which layers were responsible for some of the worst problems in the component. It is also a good indicator of the efficiency of the administrative staff in fixing issues. If an entry in the To column is prefixed by the phrase "Open @" it indicates that the problem remained open until the end of the chosen Timeline. To zero-in on the exact problem that affected a layer for the displayed Duration, click on the layer name hyperlink. An Event History page (see Figure 5) will appear, listing the performance metrics that deviated causing the layer to suffer for the displayed Duration.
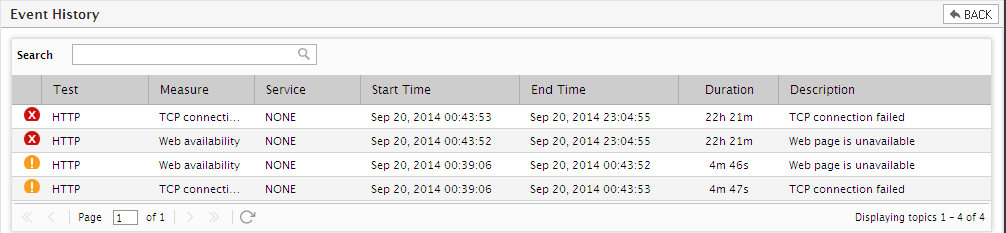
Figure 5 : The history of alarms corresponding to the layer clicked on
-
The fourth section of the Service Level Analysis - By Component report (see Figure 2) is an event summary, which lists all the layers in the layer model of the chosen component, and displays the percentage of time during the specified Timeline a layer encountered Critical/Major/Minor issues. This event summary, when viewed along with the top 5 summary, will enable you to accurately identify the problem-prone layers of the component (see Figure 2). Clicking on a layer name here will enable you to view all the measures that were responsible for the problems in the layer during the chosen period (see Figure 6).
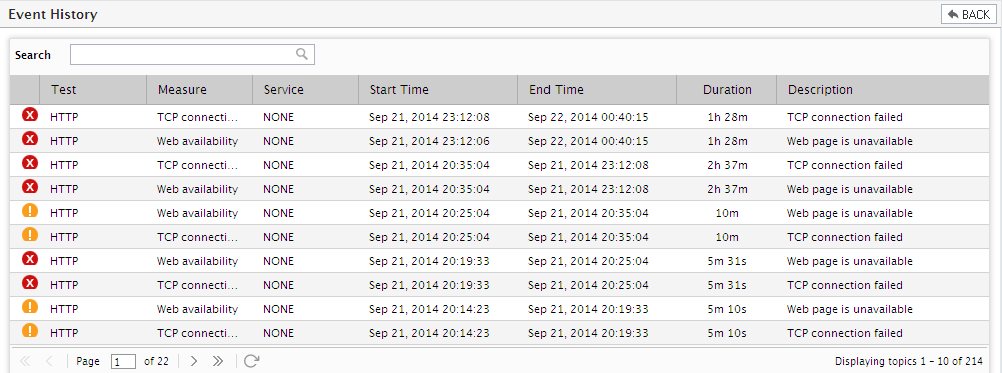
Figure 6 : The history of alarms pertaining to the layer clicked on
-
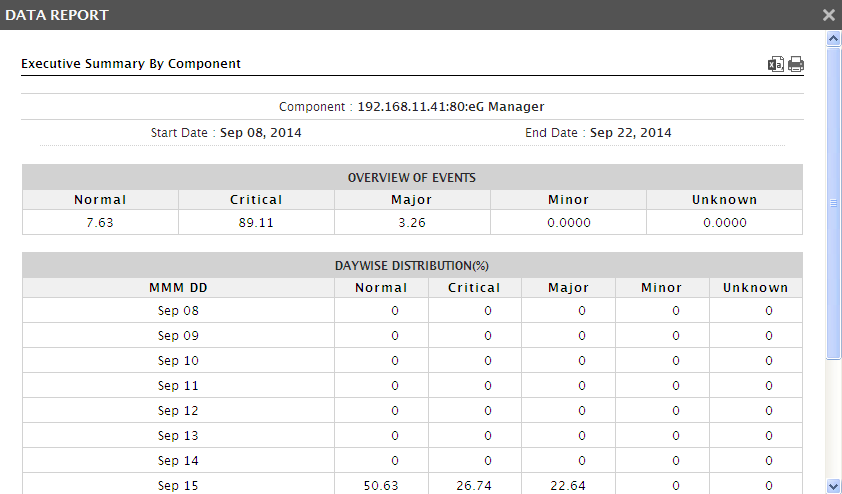
To view the data that is plotted on the bar graph of Figure 2, click on the DATA button therein. Figure 7 will then appear. You can print the data or save it as a CSV file by clicking on the required icons at the right, top corner of Figure 7.
-
On the other hand, if the Background Save - PDF option is chosen from the Report Generation list, then, clicking on the Run Report button will not invoke the report. Instead, a message depicted by Figure 8 will appear.
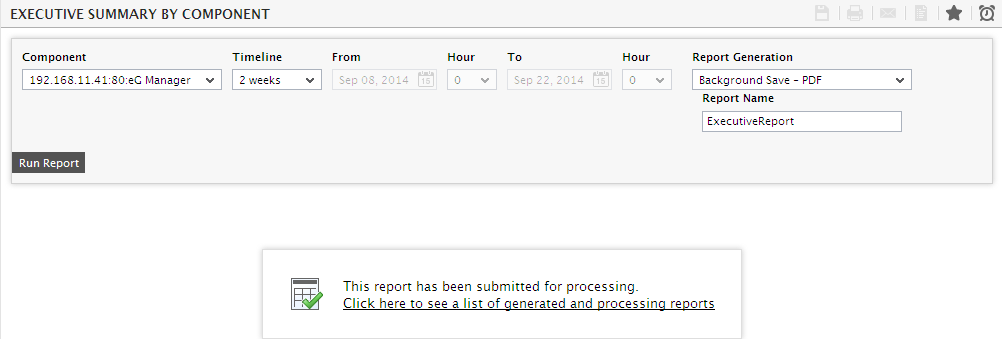
Figure 8 : A message indicating that the report is being processed in the background
- To view the report, click on the Click here to see a list of generated and processing reports link in Figure 8.
-
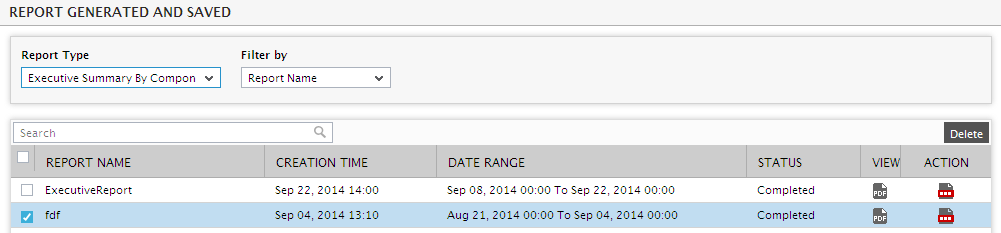
Figure 9 will then appear listing the executive reports that have been scheduled for background generation.
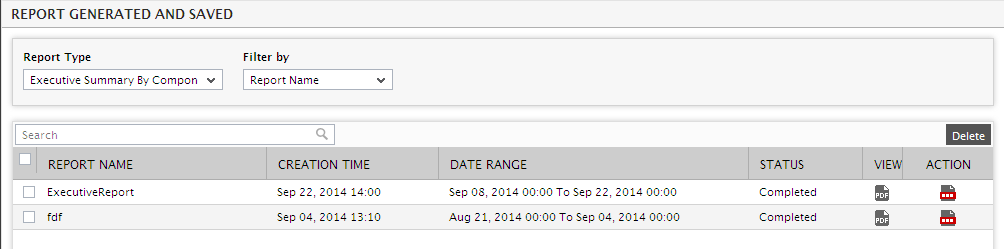
- Alongside a report name in this page, you can view when background processing of the report started (Creation Time), the report Timeline, the Date Range for which the report was generated, and the Status of the background processing of the report. Once processing completes, the report is saved as a PDF file.
- If the Status column corresponding to a report displays Completed, then, you can view the report as a PDF by clicking on the
 icon against that report. If for some reason background processing fails, then the Status column will display Failed instead. In this case, you can either regenerate the report in the background, or delete the report. To regenerate the report, click on the
  icon.
icon. - If this page lists too many reports, then, you can apply one/more filter criteria on the list, so that you can quickly view information related to only those background reports that are of specific interest to you. For instance, to view the background reports of a particular type alone, select a Report Type from this page. To view details pertaining to all background reports, pick the All Report Types option from the Report Type list.
-
Similarly, you can view the status of a particular report, by doing the following:
- Pick Report Name from the Filter by list.
- Specify the whole/part of the report name in the Search text box and click the right-arrow button next to it.
- The page will then display the details of only that background report, which has the name provided in the Search text box.
-
In the same way, you can even search for reports by status. For this, do the following:
- Pick Status from the Filter by list.
- Specify the status to search for in the Search text box and click the right-arrow button next to it.
- The page will then display the details of only those background reports which are in the state provided in the Search text box.
-
To delete any of the listed reports, click on the check box alongside the report, and then click on the DELETE button in this page (see Figure 10). To delete all the listed reports, first, click on the check box adjacent to the column heading, Report Type; this will mark all the reports displayed in this page for deletion. Then, click on the Delete button.