VDI Resource Usage - Desktop Distribution report
To assess the resource consumption of the desktops in a VDI environment, you can use the VDI Resource Usage - Desktop Distribution report. To generate the VDI Resource Usage - Desktop Distribution report, do the following:
- Select the Desktop Distribution option by following the menu sequence: REPORTS BY FUNCTION -> Domain-specific Reports-> Virtual Applications / Desktops -> VDI Resource Usage
-
Figure 1 will then appear. Select an option for analysis of the report from the Analyzeby list. By default, this list will display Component as its selection. You can however narrow your search by opting to view only those virtual servers that are part of a service/segment/zone. For this, select the Zone, Service, or Segment, option from the Analyze By field:
- Selecting the Zone option will allow you to select the desired zone from the Zone list box. To include the virtual servers within a specific subzone, set the Include subzone flag to Yes.
-
In the same way, to make the virtual servers that are part of a particular segment or service, select Service or Segment from the Analyze by list box. Then, select the desired service or segment from the Service or Segment list.
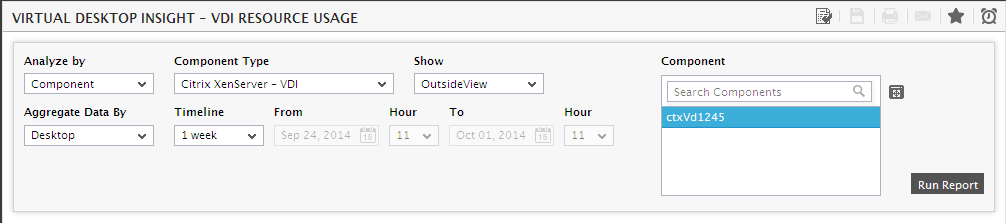
Figure 1 : Selecting the criteria for generating the Desktop Distribution report
- Next, from the Component Type list, select the virtual server type for which this report is to be generated.
- In the Component list box, all the components pertaining to the chosen Component Type will be listed. If the Component list consists of too many virtual servers, then viewing all the components and selecting the ones you need for report generation could require endless scrolling. To avoid this, you can click the
 icon next to the Component list. This will open the COMPONENTS pop up window using which you can view almost all the components in a single interface and Select the ones for which the report is to be generated. If there are still too many components in the list to choose from, you can narrow your search further by using the Search Components text box. Specify the whole/part of the component name to search for in this text box, and click the
  icon next to it. The Component list will then be populated with all component names that embed the specified search string. Select the component of your choice from this list.
 - By default, this report will be generated based on the outside view metrics of the chosen Component. Therefore, OutsideView will be the default selection from the Show list box. If the report needs to be generated based on the inside view metrics of the chosen component, then the InsideView option will be selected from this list.
- If you wish to generate the report from the virtual desktops perspective, then select the Desktop option from the Aggregate Data By list box. If you wish to generate the report from the user-perspective (users who are currently using the desktops), then choose User from this list.
- Next, specify the start time and end time for report generation against the Time period field.
-
Specify the report Timeline. You can either provide a fixed time line such as 1 hour, 2 days, etc., or select the Any option from the list to provide a From and To date/time for report generation.
Note:
For every user registered with the eG Enterprise system, the administrator can indicate the maximum timeline for which that user can generate a report. Once the maximum timeline is set for a user, then, whenever that user logs into eG Reporter and attempts to generate a report, the Timeline list box in the report page will display options according to the maximum timeline setting of that user. For instance, if a user can generate a report for a maximum period of 3 days only, then 3 days will be the highest option displayed in the Timeline list - i.e., 3 days will be the last option in the fixed Timeline list. Similarly, if the user chooses the Any option from the Timeline list and proceeds to provide a start date and end date for report generation using the From and To specifications, eG Enterprise will first check if the user's Timeline specification conforms to his/her maximum timeline setting. If not, report generation will fail. For instance, for a user who is allowed to generate reports spanning over a maximum period of 3 days only, the difference between the From and To dates should never be over 3 days. If it is, then, upon clicking the Run Report button a message box will appear, prompting the user to change the From and To specification.
-
In addition to the settings discussed above, this report comes with a set of default specifications. These settings are hidden by default. If you do not want to disturb these default settings, then you can proceed to generate the report by clicking the Run Report button soon after you pick the criteria for generating the report. However, if you want to view and then alter these settings (if required), click on the
 button. The default settings will then appear in the MORE OPTIONS drop down window (see Figure 2). The steps below discuss each of these settings and how they can be customized.
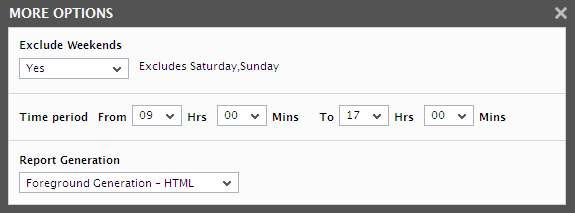
Figure 2 : The default settings for generating the Desktop Distribution report
-
If the timeline specified for the report needs to exclude the data collected during the Weekends, then set Exclude weekends to Yes. If not, select No.
Note:
By default, the weekend constitutes Saturday and Sunday. To override this default setting, do the following:
- Edit the eg_report.ini file in the <EG_INSTALL_DIR>\manager\config directory.
- In the [measure_group] section of the file, the exclude_weekend parameter is set to Saturday,Sunday by default. You can modify this by setting the exclude_weekend parameter to a comma-separated list of other days of the week - say Friday,Saturday.
- Save the file after making the required changes.
- Specify the start time and end time for report generation against the Time period field (see Figure 2).
-
In large environments, reports generated using months of data can take a long time to complete. Administrators now have the option of generating reports on-line or in the background. When a report is scheduled for background generation, administrators can proceed with their other monitoring, diagnosis, and reporting tasks, while the eG manager is processing the report. This saves the administrator valuable time. To schedule background processing of a report, select the Background Save - PDF option from the Report Generation list. In this case, a Report Name text box will appear, where you would have to provide the name with which the report is to be saved in the background. To process reports in the foreground, select the Foreground Generation - HTML option from this list.
Note:
- The Report Generation list will appear only if the EnableBackgroundReport flag in the [BACKGROUND_PROCESS] section of the eg_report.ini file (in the {EG_INSTALL_DIR}\manager\config directory) is set to Yes.
- The default selection in the Report Generation list will change according to the Timeline specified for the report. If the Timeline set is greater than or equal to the number of days specified against the MinDurationForReport parameter in the [BACKGROUND_PROCESS] section of the eg_report.ini file, then the default selection in the Report Generation list will be Background. On the other hand, if the Timeline set for the report is lesser than the value of the MinDurationForReport parameter, then the default selection in the Report Generation list will be Foreground. This is because, the MinDurationForReport setting governs when reports are to be processed in the background. By default, this parameter is set to 2 weeks - this indicates that by default, reports with a timeline of 2 weeks and above will be processed in the background.
-
Finally, click the Run Report button. Figure 3 will now appear.
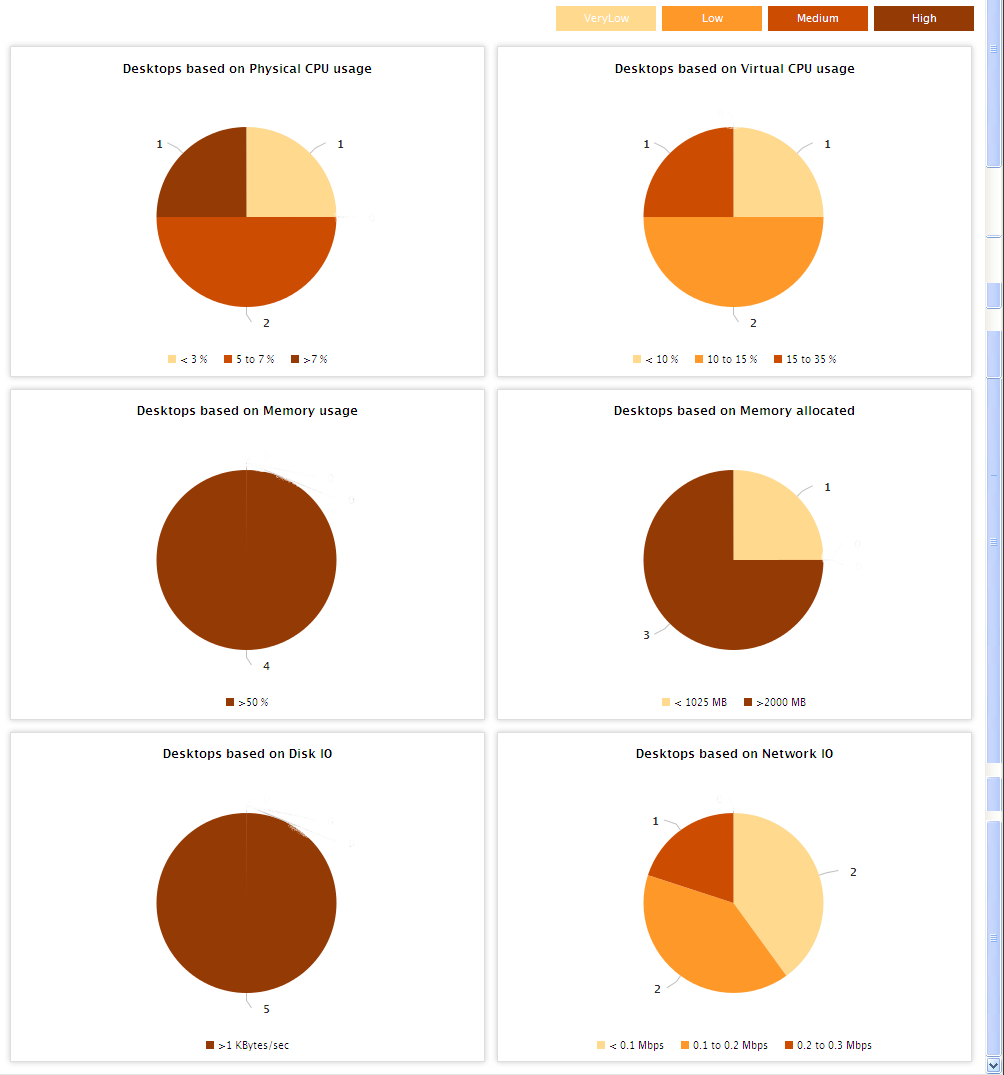
Figure 3 : The VDI Resource Usage - Desktop Distribution report
- Figure 3 shows a series of distribution pie charts for the virtual desktops based on their Physical CPU usage, Virtual CPU usage, Memory usage, allocated memory, Disk IO and Network IO. Each slice of the pie and their respective colors represent the different levels of desktop resource utilization (VeryLow, Low, Medium and High).
-
Clicking on any of the slices of a particular distribution pie chart will lead you to the Desktops Resource Usage DETAILS pop up window (see Figure 4) that contains the resource utilization of all the desktops in data format. The Data Sorted By field available in this window will represent the section on which the slice of pie was actually clicked. If you click on a slice from the Desktops based on Memory allocated section, then Memory allocated will be displayed in the Data Sorted By field. The Memory allocated column will be sorted in descending order as shown in Figure 4. Using this data report, you can actually correlate the resource usage of the desktops and identify those desktops that are in dire need of additional resources. If the Desktop option is chosen from the Aggregate Data By list, then the names of the desktops alone will be listed in the Desktop column of the Desktops Resource usage details pop up window.
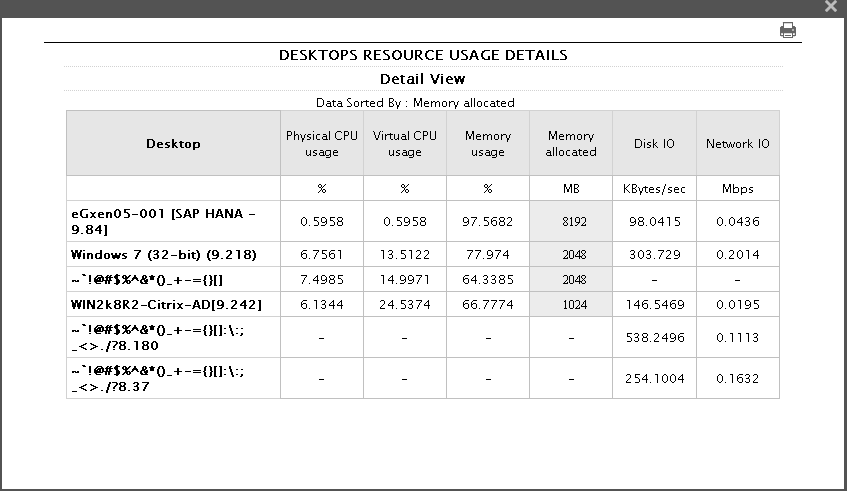
Figure 4 : The Desktops Resource Usage Details pop up window
-
If User option is chosen from the Aggregate Data By list of Figure 1, then the report will be generated considering the desktops on which users are currently active:
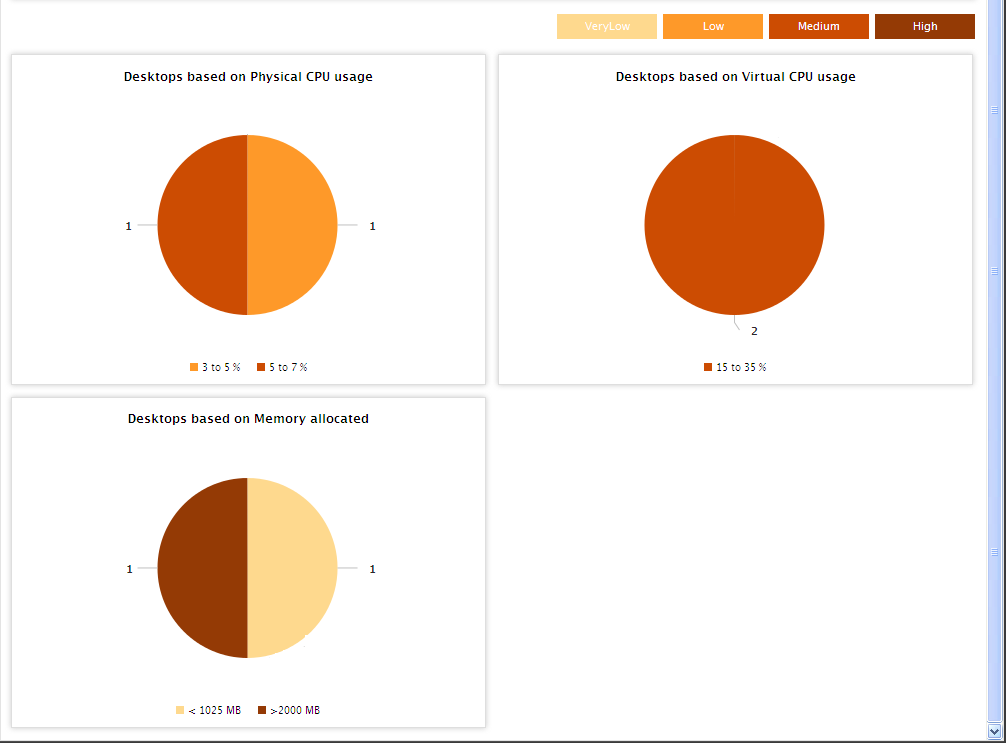
Figure 5 : The VDI Resource Usage report that is generated when User option is chosen
-
Clicking on a slice of the distribution pie chart will reveal the DESKTOPS RESOURCE USAGE DETAILS pop up window which will sport a User column unlike the Desktop column of Figure 4. This User column lists the name of the desktop and the user who is currently logged into that desktop (see Figure 6).
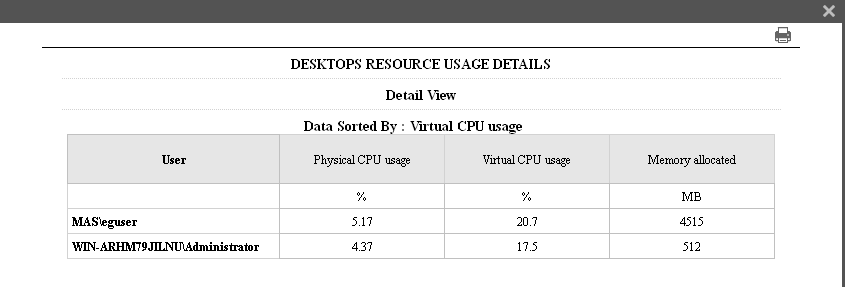
Figure 6 : The Desktops Resource Usage Details pop up that appears when the User option is selected
-
If Inside View option is chosen from the Show list and the Desktop option is chosen from the Aggregate Data By list, then the report will comprise a series of distribution pie charts (see Figure 7) for the Virtual CPU usage, Physical memory utilized, free physical memory, percent writes to virtual disk, incoming connection to VM, outgoing connections to VM and bandwidth usage. The distribution pie chart will list only the desktops that have reported measures to the eG Manager during the last measurement period (see Figure 7).
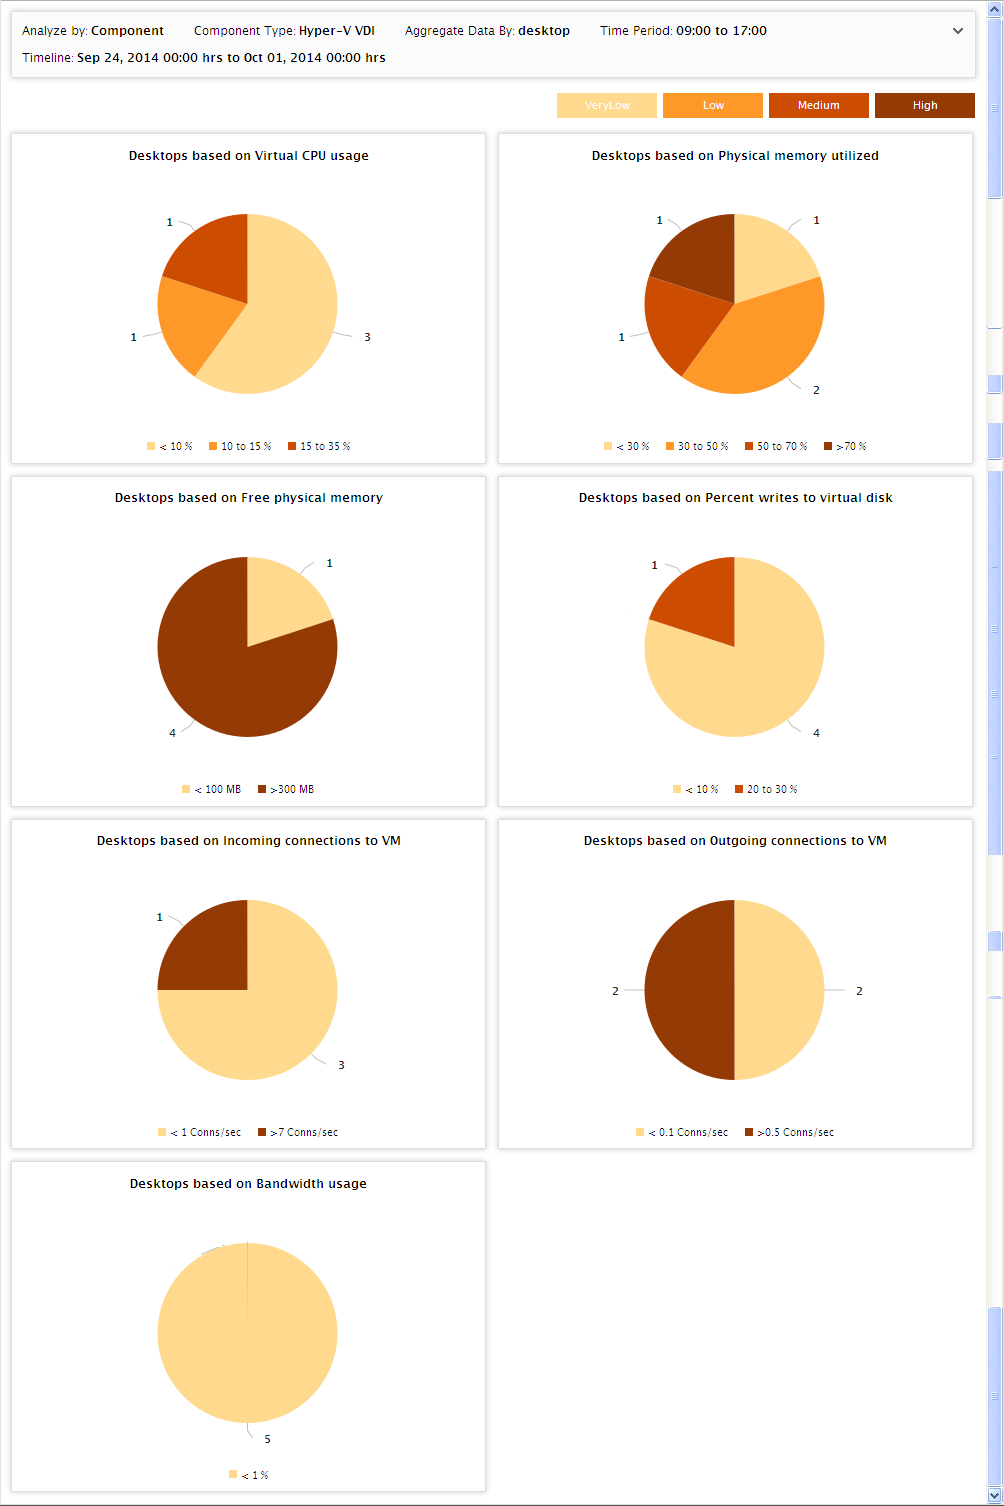
Figure 7 : The VDI Resource usage report when Inside view option is selected
-
Clicking on a slice of the distribution pie chart will reveal the DESKTOP RESOURCE USAGE DETAILS pop up window which will list the data report of each desktop. Figure 8 reveals the data report based on the Virtual CPU usage of the desktops.
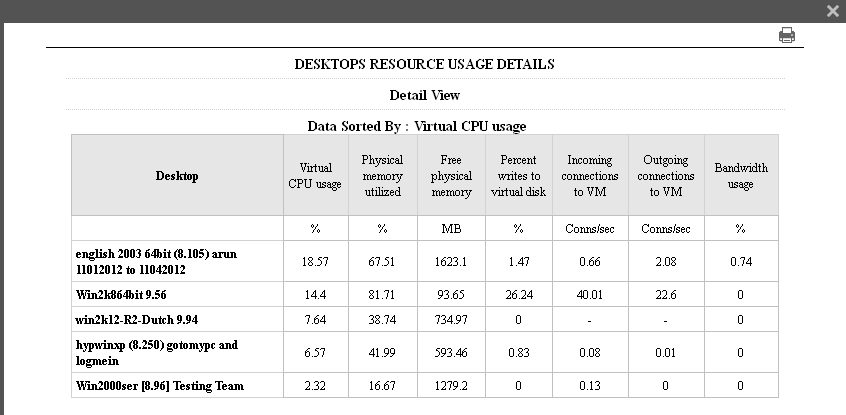
Figure 8 : The Desktop Resource Usage Details pop up window displaying the Inside view metrics
-
If Inside View option is chosen from the Show list and the User option is chosen from the Aggregate Data By list, then the report will be generated considering the desktops on which the users are currently active (see ).
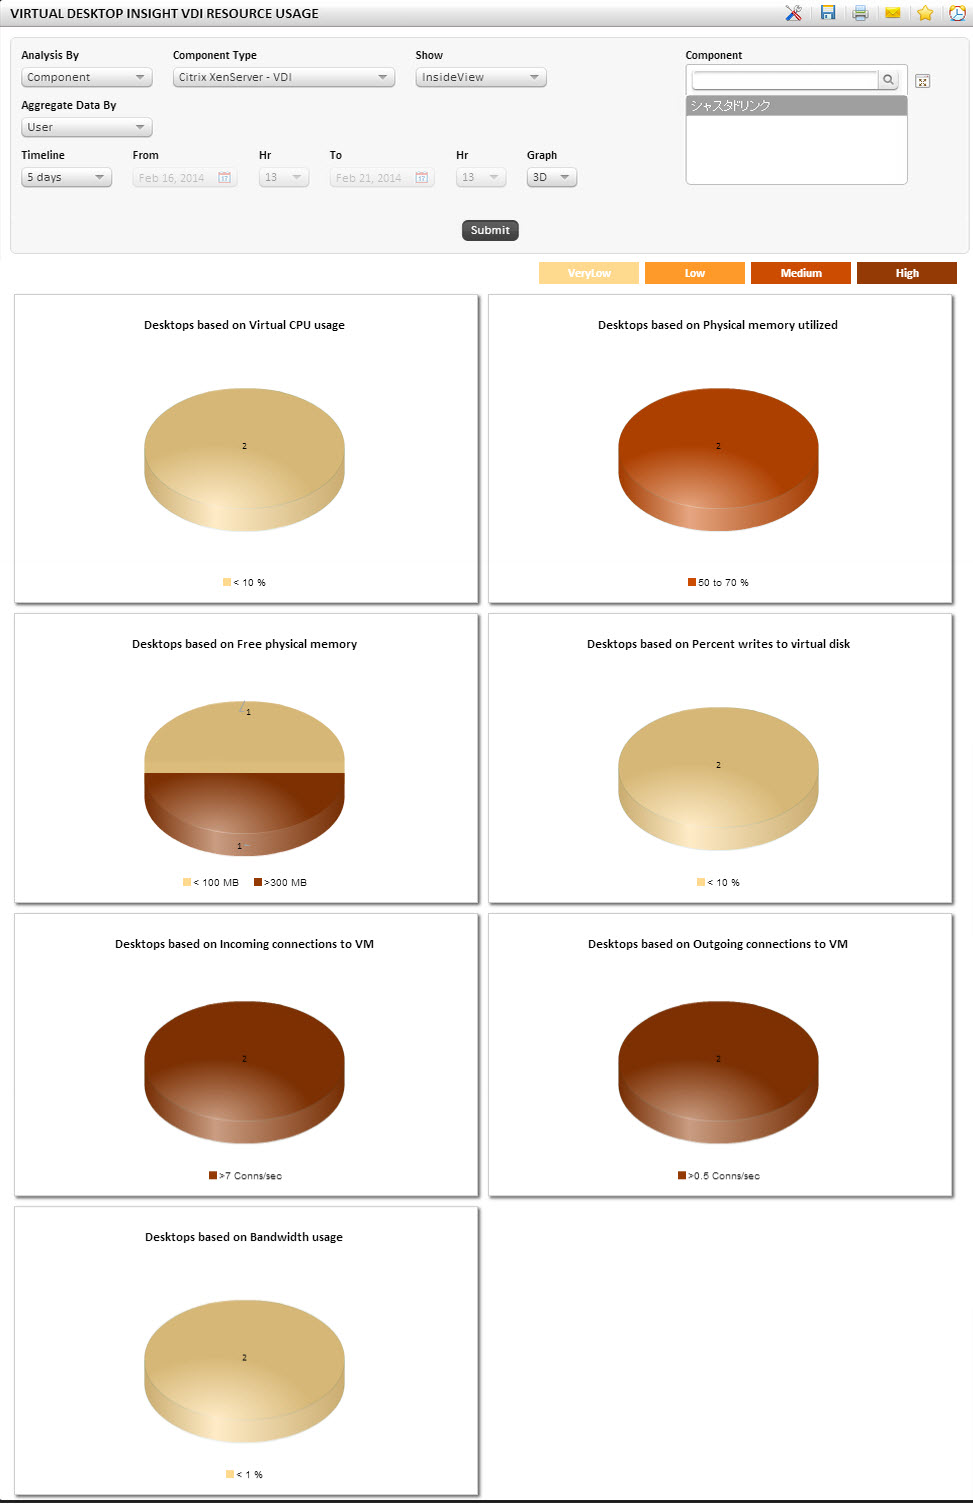
Figure 9 : The VDI Resource Usage report that is generated when Inside View and User options are chosen
-
Clicking on a slice of the distributed pie chart, say for example – a slice of the Desktops based on Virtual CPU usage will reveal the DESKTOPS RESOURCE USAGE DETAILS pop up window. The User column in the DESKTOPS RESOURCE USAGE DETAILS pop up window will list the name of the desktop and the user who is currently logged into that desktop (see Figure 10).
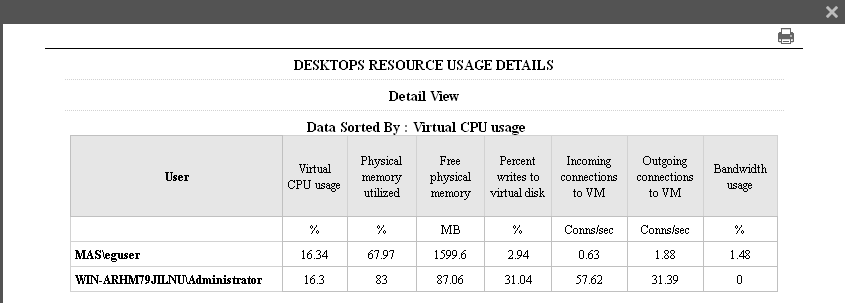
Figure 10 : The Desktops Resource Usage Details window that appears upon clicking a slice of the pie chart
Note:
Sometimes, desktops that are powered on during a measurement period may be powered off during another measurement period. But in general, the report will be generated only for the desktops that are currently powered on in the target environment. Administrators may however, wish to take all the desktops into consideration. In such a situation, set the OmitPoweredOFFVMs flag in the [Desktop_Insight_Resource_Usage] section of the eg_report.ini to No. This will ensure displaying the measures for all the available desktops in the target environment.
Note:
The number of virtual desktops whose data is to be displayed in theDESKTOP RESOURCE USAGE DETAILS pop up window is configurable. To specify the number, do the following:
- Edit the eg_report.ini file in the <EG_INSTALL_DIR>\manager\config directory.
- Specify a number of your choice against the noOfDesktopToDisplay parameter in the [Desktop_Insight_Resource_Usage] section of the file. By default, the value displayed here is 20, indicating that, by default, the data report will be for the Top 20 virtual desktops. For example, if you change this value to 5, then the data report will display only the Top 5 virtual desktops in terms of resource usage.
- Finally, save the eg_report.ini file.