Users - Logon Performance Report
Administrators are often interested in figuring out the login duration of the each user in the Citrix XenApp farms. They would like to identify the user who has taken the maximum time duration to login into the server and where exactly the user login has taken the maximum time – is it during the user profile loading? or is it the LDAP bind time to the active directory? or is it the DC Discovery time?. The Users - Logon Performance report helps administrators historically analyze the login patterns to the server, identify the servers that were slow in responding to the user logon requests and rectify the problems caused due to the poor responsiveness of the servers.
To generate this report, do the following:
- Select the Logon Performance option from the Users sub node by following the menu sequence: REPORTS BY FUNCTION -> Domain-specific Reports -> Virtual Applications / Desktops.
-
When Figure 1 appears, do the following:
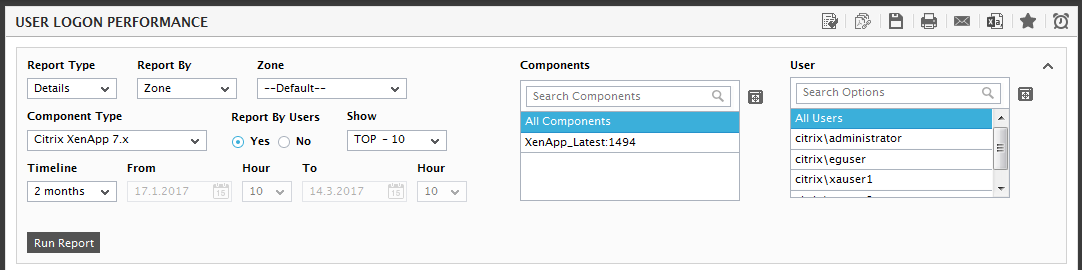
- Choose a Report Type (Summary or Details) for generating the report. The default Report Type is Summary. A Details report helps in generating the report in a tabular format.
-
Administrators of large IT infrastructures, which are characterized by hundreds of components, may find it difficult to pick and choose the components for which a report is to be generated; this is because, in such environments, the Components list in this page will be populated with a large number of components, which would naturally make component selection tough. To enable administrators of such environments to quickly locate the components of interest to them and swiftly generate the reports, eG Enterprise provides a Report By list that consists of a variety of filter options. By default, the Zone option is chosen from this list (see Figure 1) – this indicates that the components for which a report is to be generated is part of a zone. To include sub-zones also in your search for components, set the Include Subzones flag to Yes. In addition to this, the Report for list provides the following filter options as well:
- Service:If the component for which reports are to be generated is involved in the delivery of a particular service, then pick this option from the Report for list. Doing so will invoke a Service list from which a service name is to be chosen. Upon selection of a service, the component types that are part of the service will populate the Component Type list in this page. Once you pick a component type, all components of that type, which are engaged in the delivery of the chosen service, will be displayed as candidates for selection in the Components list. If there are still too many components in the list to choose from, you can narrow your search further by using the Search text box. Specify the whole/part of the component name to search for in this text box, and click the
 icon next to it. The Components list will then be populated with all component names that embed the specified search string. Select the component of your choice from this list.
 - Segment:If the components for which a report is to be generated is part of a segment, pick the Segment option from the Report for list. Then, select the segment of interest to you from the Segment list. This will populate the Component Type list with the types of components that are part of the chosen segment. If you select a component type from the Component Type list, then, all components of that type, which are part of the chosen segment, will be displayed in the Components list for selection. If there are still too many components in the list to choose from, you can narrow your search further by using the Search text box. Specify the whole/part of the component name to search for in this text box, and click the icon button next to it. The Components list will then be populated with all component names that embed the specified search string. Select the component of your choice from this list.
- Component:If you select a Component from the Report By list and a component type from the Component Type list, then, all components of that type, which are not part of a zone/segment/service, will be displayed in the Components list for selection. If the Components list consists of too many components, then viewing all the components and selecting the ones you need for report generation could require endless scrolling. To avoid this, you can click the
 icon next to the Components list. A COMPONENTS pop up window will then appear using which you can view almost all the components in a single interface and Select the ones to be included for generating the report. If there are still too many components in the list to choose from, you can narrow your search further by using the Search text box. Specify the whole/part of the component name to search for in this text box, and click the icon next to it. The Components list will then be populated with all component names that embed the specified search string. Select the component of your choice from this list.
- Service:If the component for which reports are to be generated is involved in the delivery of a particular service, then pick this option from the Report for list. Doing so will invoke a Service list from which a service name is to be chosen. Upon selection of a service, the component types that are part of the service will populate the Component Type list in this page. Once you pick a component type, all components of that type, which are engaged in the delivery of the chosen service, will be displayed as candidates for selection in the Components list. If there are still too many components in the list to choose from, you can narrow your search further by using the Search text box. Specify the whole/part of the component name to search for in this text box, and click the
- Select the Zone to which the servers of interest to you belong. If no zones have been configured in your environment, then all the managed servers in the environment will be automatically grouped under a zone named Default; in such cases therefore, select the Default zone.
- Next, from the Component Type list, select the virtual server type for which this report is to be generated.
- By default, this report will be generated for the virtual desktops that were provisioned by Citrix XenDesktop brokers. To this effect, the Citrix option is chosen by default, from the Brokered by list. If the virtual desktops in your environment are provisioned using non-citrix brokers (e.g., Horizon View), then, choose Other option from this list.
- If the Report Type is Details, then, in the Components list box, all the components pertaining to the chosen Component Type will be listed. Select the servers for which this report is to be generated. If the Components list consists of too many components, then viewing all the components and selecting the ones you need for report generation could require endless scrolling. To avoid this, you can click the icon next to the Components list. A COMPONENTS pop up window will then appear using which you can view almost all the components in a single interface and Select the ones to be included for generating the report.
- If the Report Type is Details, then, in the User list box, all the users logged into the chosen Components will be listed. If the User list is too long, then viewing all the users and selecting the ones you need for report generation could require endless scrolling. To avoid this, you can click the icon next to the User list. This will open the USER pop up window using which you can view almost all the users in a single interface and Select the ones for which the report is to be generated. If there are still too many users in the list to choose from, you can narrow your search further by using the Search Options text box. Specify the whole/part of the user name to search for in this text box, and click the icon next to it. The User list will then be populated with all user names that embed the specified search string. Select the user of your choice from this list.
- If the Report Type is Details, then a Report By Users flag appears. By default, this flag is set to Yes indicating that the Data report will be generated for each user by consolidating multiple logins of the users. If this flag is set to No, then this report will be generated each time a user logs into the target server.
- If the Report Type is Details, by default, this report will list the of the Top 10 users/logon time. If you wish to view the report for the number of users/logon time of your choice, then, you may do so by selecting an option from the Show list box.
-
Then, specify the Timeline for the report. You can either provide a fixed time line such as 1 hour, 2 days, etc., or select the Any option from the list to provide a From and To date/time for report generation.
Note:
For every user registered with the eG Enterprise system, the administrator can indicate the maximum timeline for which that user can generate a report. Once the maximum timeline is set for a user, then, whenever that user logs into eG Reporter and attempts to generate a report, the Timeline list box in the report page will display options according to the maximum timeline setting of that user. For instance, if a user can generate a report for a maximum period of 3 days only, then 3 days will be the highest option displayed in the Timeline list - i.e., 3 days will be the last option in the fixed Timeline list. Similarly, if the user chooses the Any option from the Timeline list and proceeds to provide a start date and end date for report generation using the From and To specifications, eG Enterprise will first check if the user’s Timeline specification conforms to his/her maximum timeline setting. If not, report generation will fail. For instance, for a user who is allowed to generate reports spanning over a maximum period of 3 days only, the difference between the From and To dates should never be over 3 days. If it is, then, upon clicking the Run Report button a message box will appear, prompting the user to change the From and To specification.
-
In addition to the settings discussed above, this report comes with a set of default specifications. These settings are hidden by default. If you do not want to disturb these default settings, then you can proceed to generate the report by clicking the Run Report button soon after you pick the criteria for generating the report. However, if you want to view and then alter these settings (if required), click on the
 button. The default settings will then appear in the MORE OPTIONS drop down window (see Figure 2). The steps below discuss each of these settings and how they can be customized.
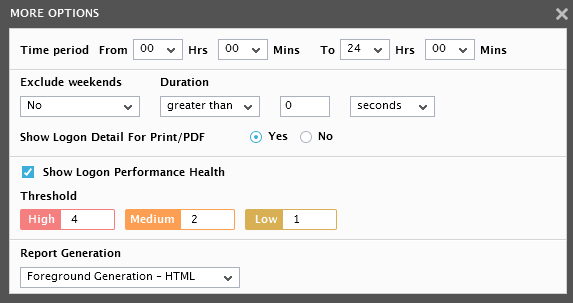
Figure 2 : The default settings for generating the User Logon Performance report
-
Specify the start time and end time for report generation against the Time period field (see Figure 2).
Note:
The default Time period to be displayed here can be configured using the consolidated reports page in the eG administrative interface; to access this page, follow the menu sequence: Settings -> Reporter -> Consolidated Reports. For more details regarding this page, refer to Consolidated Reports of this manual.
-
If the timeline specified for the report needs to exclude the data collected during the Weekends, then set Exclude weekends to Yes. If not, select No.
Note:
By default, the weekend constitutes Saturday and Sunday. To override this default setting, do the following:
- Edit the eg_report.ini file in the <eg_install_dir>\manager\config directory.
- In the [measure_group] section of the file, the exclude_weekend parameter is set to Saturday,Sunday by default. You can modify this by setting the exclude_weekend parameter to a comma-separated list of other days of the week - say Friday,Saturday.
- Save the file after making the required changes.
- If the Report Type is Details, then a Duration list box will appear. By default, the greater than option is chosen from this list. For example, if you wish to identify the generate the report only when the login time exceeds 2 seconds, then you can do so by selecting greater than 2 seconds from the Duration list box.
- If the Report Type is Details, then a Show Logon Performance Health check box will appear as shown in Figure 2. If you wish to set the thresholds for the login duration, then you can do so by selecting the check box. The Threshold section will then appear where you will be allowed to choose the Critical, Major and Minor thresholds.
-
If the Report Type is Details, then an additional Show Logon Detail for Print/PDF will appear in the MORE OPTIONS pop up window. By default, this flag is set to Yes indicating that this report when generated for a Citrix Director 7.x and printed/emailed would reveal the logon duration of each user session and the time taken by that session at each stage of the logon process, starting from StoreFront login till session start-up on a XenApp server / virtual desktop along with the default information provided in the report.
- If there are too many reconnects for a user session, then, this report may skew the average user logon time calculated. To avoid this, administrators may exclude reconnects during report generation by choosing No from the Include Reconnects list. By default, Yes option is chosen from the Include Reconnects list.
-
In large environments, reports generated using months of data can take a long time to complete. Administrators now have the option of generating reports on-line or in the background. When a report is scheduled for background generation, administrators can proceed with their other monitoring, diagnosis, and reporting tasks, while the eG manager is processing the report. This saves the administrator valuable time. To schedule background processing of a report, select the Background Save - PDF option from the Report Generation list. In this case, a Report Name text box will appear, where you would have to provide the name with which the report is to be saved in the background. To process reports in the foreground, select the Foreground Generation - HTML option from this list.
Note:
- The Report Generation list will appear only if the EnableBackgroundReport flag in the [BACKGROUND_PROCESS] section of the eg_report.ini file (in the [EG_INSTALL_DIR]\manager\config directory) is set to Yes.
- The default selection in the Report Generation list will change according to the Timeline specified for the report. If the Timeline set is greater than or equal to the number of days specified against the MinDurationForReport parameter in the [BACKGROUND_PROCESS] section of the eg_report.ini file, then the default selection in the Report Generation list will be Background. On the other hand, if the Timeline set for the report is lesser than the value of the MinDurationForReport parameter, then the default selection in the Report Generation list will be Foreground. This is because, the MinDurationForReport setting governs when reports are to be processed in the background. By default, this parameter is set to 2 weeks - this indicates that by default, reports with a timeline of 2 weeks and above will be processed in the background.
-
Finally, click the Run Report button to generate the report.
-
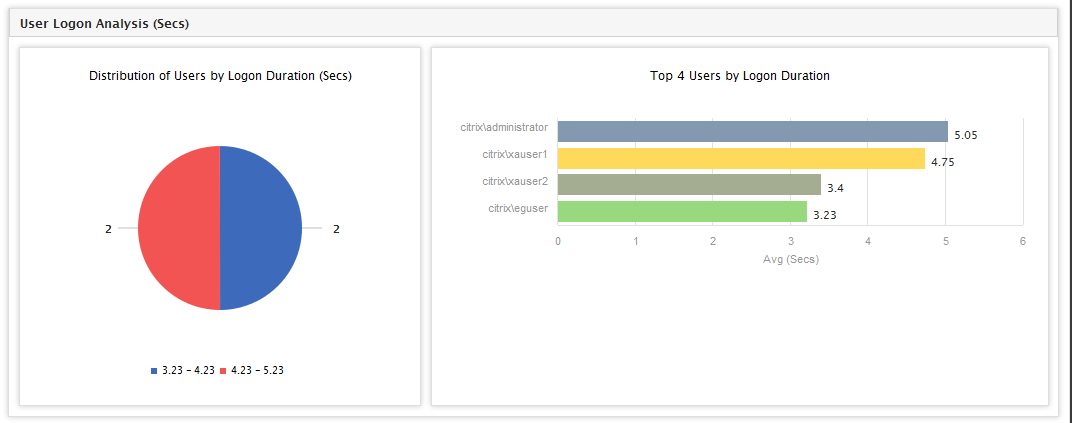
If the Report Type is Summary and the option chosen from the Report Generation list is Foreground Generation - HTML, then, clicking on the Run Report button will invoke Figure 3, which will comprise of the following:
-
A distribution pie chart reveals the number of users in different distribution ranges of their login time (see Figure 3). The distribution ranges are obtained based on the first of the configured functions for the chosen Measure. For instance, assume that Avg logon duration is the chosen Measure. Say that you have configured to display the Avg and Max of Avg logon duration in this report. Typically, both these configured values will appear only in a Details report. In the case of a Summaryreport however, the first of the two functions - i.e., Avg of Avg logon duration- alone is calculated for every component of the chosen component-type. The resulting pie chart enables administrators to deduce, at a glance, the number of users who were logged in for a longer/shorter duration. Clicking on a particular slice in the pie chart lists the users who fall within the value range represented by that slice (see Figure 3). Against every user, the actual values for each of the configured functions (Avg, in our example), will be displayed.
Note:
By default, the chart type for distribution is a pie chart. However, you can have a bar graph depict the same data instead of a pie chart, by following the steps given below:
- Edit the eg_report.ini file in the <EG_INSTALL_DIR>\manager\config directory.
- Change the value of the chartTypeForDist parameter in the [zone_report] section of this file from the default Pie, to Bar.
- Save the eg_report.ini file.
By default, the number of value ranges that need to be configured for the distribution chart is 10. To override this default setting, do the following:
- Edit the eg_report.ini file in the <EG_INSTALL_DIR>\manager\config directory.
- Specify a number of your choice against the nofRangeForDist parameter in the [zone_report] section of this file. By default, this parameter will hold the value 10.
- Save the eg_report.ini file.
-
Adjacent to the pie chart, you will find a bar chart that indicates the users that have topped/failed in a selected performance realm (i.e., the Measure) during the specified Timeline. For example, for the Avg logon durationmeasure, this bar chart reveals the top users who were logged in for a longer duration. Like the pie chart, the values for the bar chart are also calculated by applying the first of the configured functions on the chosen Measure.
Note:
The number of components to be displayed in the Top <N> Components bar chart is configurable. To specify the number, do the following:
- Finally, save the eg_report.ini file.
- Specify a number of your choice against the NoOfServersforChart parameter in the [zone_report] section of the file. By default, the value displayed here is 10, indicating that, by default, the bar chart will be for the Top 10 Components. For example, if you change this value to 5, then a bar chart displaying the Top 5 Components will appear.
- Edit the eg_report.ini file in the <EG_INSTALL_DIR>\manager\config directory.
Similarly, you can configure the depth of the bars in the bar chart by specifying a numeric value against the 3DDepthforChart parameter in the [ZONE_REPORT] section of the eg_report.ini file (in the {EG_INSTALL_DIR}\manager\config directory).
By default, 10 bars will be visible in a single glance in the bar chart. If there are more bars, you will have to scroll down to view them. This default setting can be overridden by editing the eg_report.ini file (in the {EG_INSTALL_DIR}\manager\config directory). The [ZONE_REPORT] section of this file contains a VisibleSamples parameter that holds the default value 10. You can change this value.
Note:
You can configure the colors to be used in the distribution chart and the Top <N> Components bar chart in the zone report, by editing the eg_report.ini file in the <eg_install_dir>\manager\config directory. The [zone_report] section of the file defines the 20 default colors of the distribution and bar charts:
[ZONE_REPORT]
ChartColor=#8399b0,#ffd95a,#a4ac91,#98d980,#d5b996,#f48848,#8b8cc2,
#eb4052,#c4b3d0,#b18651,#ebb7ce,#028768,#f5c372,#887c65,#e4c536,
#b5582c,#f94989,#770d72,#97a067,#89aeb7distColor=#115fa6,#f25454,#60bd68,#b276b2,#81bef7,#a61120,#ffd13e,
#770d72,#887c65,#a4ac91You override the default color settings of the distribution chart by modifying the color-codes specifying against distColor. For changing the colors used by the Top <N> Components chart, alter the codes listed against the ChartColor parameter.
-
- If the Report Type is Details, the Report By Users flag is set to Yes and the option chosen from the Report Generation list is Foreground Generation - HTML, then, clicking on the Run Report button will invoke Figure 4, which will comprise the following:
- A Logon Duration Trend graph that displays the overall login trend of the users in the chosen time period. Adjacent to the Logon Duration Trend graph is the Distribution of Logon Duraiton pie chart. This pie chart provides you with the split up time of the logon duration. Using this graph, administrators can visually identify where exactly the user is facing difficulty during login – is it the DC Discovery Time? or is it the User profile load time? or is it the LDAP bind time to active directory?
-
The User Logon Analysis section provides the consolidated login duration of each user if the Reporty By Users flag is set to Yes. If the thresholds are set in the Threshold section of Figure 10.54, then the values in the Logon Duration column will be color coded accordingly.
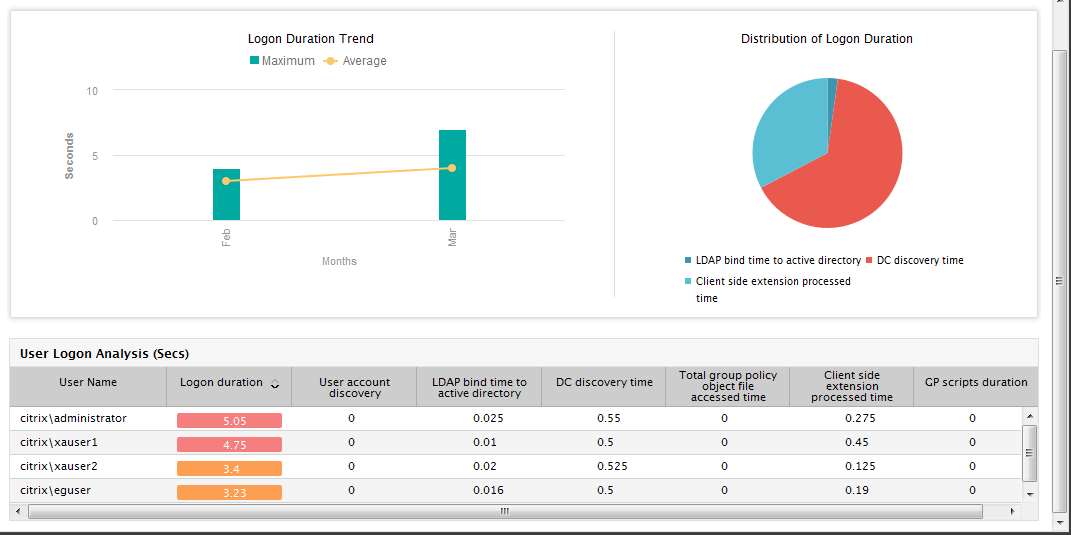
Figure 4 : The User Logon Performance report generated when Report By Users flag is set to Yes
If the Report Type is Details and the Report By Users flag is set to No, then the report will be generated each time a user logs into the virtual server as shown in .
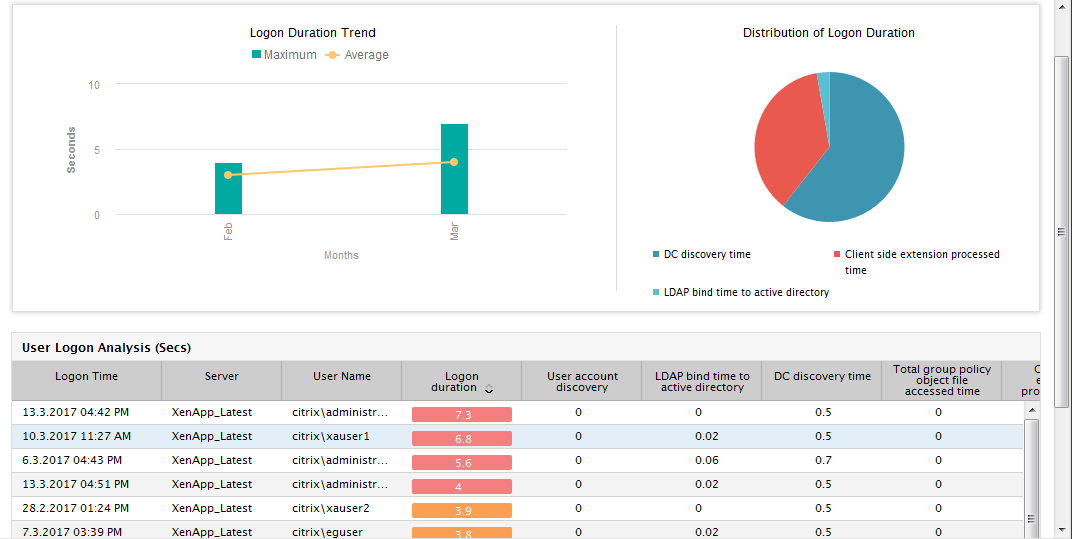
Figure 5 : The User Logon Performance report generated when Report By Users flag is set to No
-
By default, if this report is generated for a Citrix Director or a Citrix XA/XD Site component, and the Report by Users flag is set to Yes, then the report provides the end-to-end visibility into the logon experience of a user by revealing the logon duration of each user session and the time taken by that session at each stage of the logon process, starting from StoreFront login, session start-up on a XenApp server / virtual desktop till the user actually logged out of the session on the XenApp server/virtual desktop. If such end to end visibility is provided for a user, then a
 button is available against that user as shown in Figure 6.
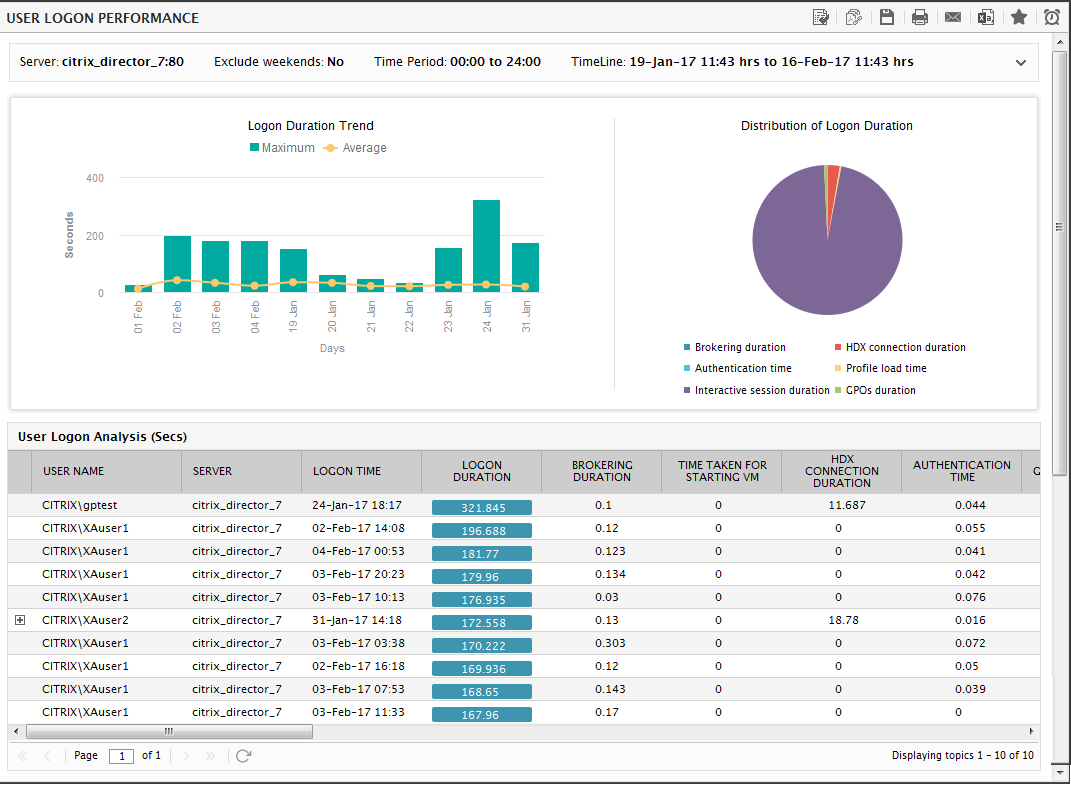
Figure 6 : The User Logon Performance Report when generated for a Citrix Director
-
By clicking on the
button, you can now drill-down from a user session in the report to view details of session start-up on the XenApp server/virtual desktop (see Figure 7). This useful insight reveals to administrators whether problems in session start-up could have delayed logon, and if so, where exactly the slowdown occurred – at the server-side or client side? 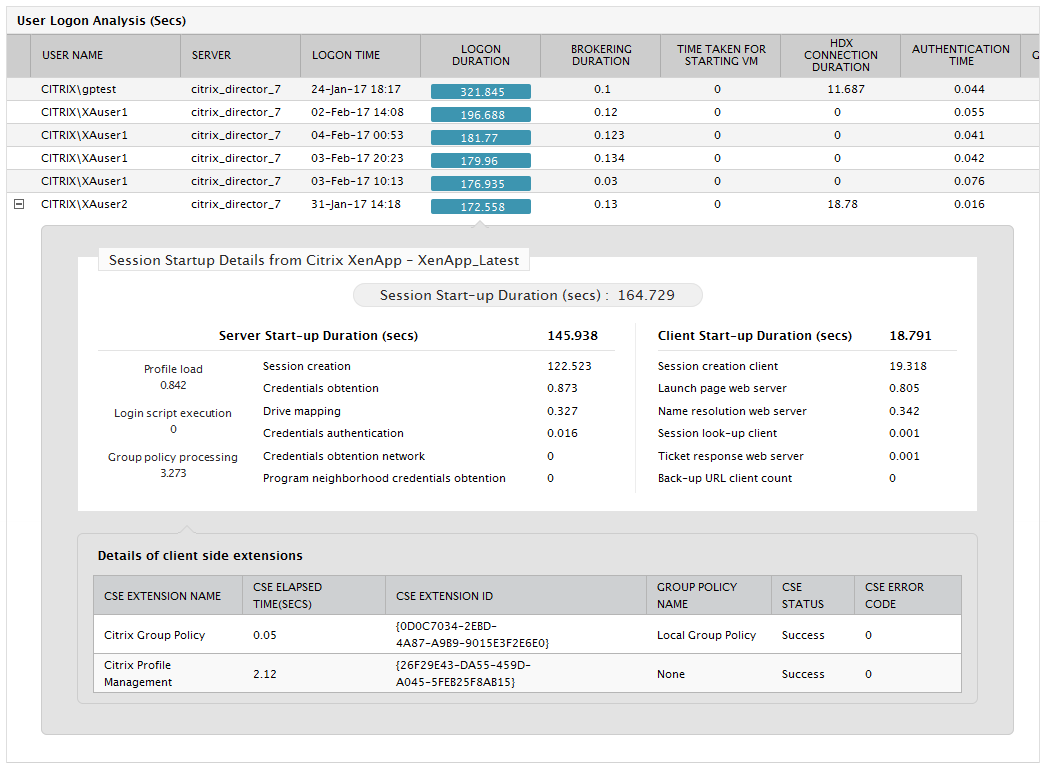
Figure 7 : End-to-end user analysis reported in the User Logon Performance Report
Note:
If you do not want to generate such end to end analysis report, then you can do so by setting the enableDetailedData flag under the [USER_LOGON_REPORT] section of the <eG_INSTALL_DIR>\manager\config\eg_report.ini file to No.