Application Performance Report
To generate application-specific reports, first, click on the Application Performance option from the Operational Reports node of the REPORTS BY FUNCTION tree. Figure 1 will then appear.
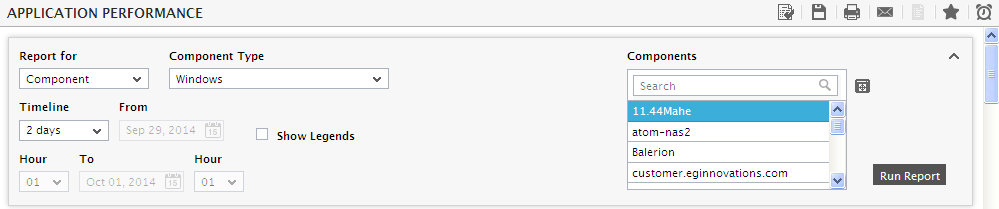
Figure 1 : Generating the Application Performance report
In order to generate the Application Performance report, provide the following information:
-
Administrators of large IT infrastructures, which are characterized by hundreds of components, may find it difficult to pick and choose the components for which a report is to be generated; this is because, in such environments, the Components list in this page will be populated with a large number of components, which would naturally make component selection tough. To enable administrators of such environments to quickly locate the components of interest to them and swiftly generate the reports, eG Enterprise provides a Report for list that consists of a variety of filter options. By default, the Component option is chosen from this list (see Figure 1) - this indicates that all the managed components of a chosen type will be available for selection in the Components list by default. In addition to this, the Report for list provides the following filter options as well:
- Service:If the component for which reports are to be generated is involved in the delivery of a particular service, then pick this option from the Report for list. Doing so will invoke a Service list from which a service name is to be chosen. Upon selection of a service, the component types that are part of the service will populate the Component Type list in this page. Once you pick a component type, all components of that type, which are engaged in the delivery of the chosen service, will be displayed as candidates for selection in the Components list. If there are still too many components in the list to choose from, you can narrow your search further by using the Search text box. Specify the whole/part of the component name to search for in this text box, and click the
 icon next to it. The Components list will then be populated with all component names that embed the specified search string. Select the component of your choice from this list.
 - Segment:If the components for which a report is to be generated is part of a segment, pick the Segment option from the Report for list. Then, select the segment of interest to you from the Segment list. This will populate the Component Type list with the types of components that are part of the chosen segment. If you select a component type from the Component Type list, then, all components of that type, which are part of the chosen segment, will be displayed in the Components list for selection. If there are still too many components in the list to choose from, you can narrow your search further by using the Search text box. Specify the whole/part of the component name to search for in this text box, and click the icon button next to it. The Components list will then be populated with all component names that embed the specified search string. Select the component of your choice from this list.
-
Zone:If the components for which a report is to be generated is part of a zone, pick the Zone option from the Report for list. To include sub-zones also in your search for components, set the Include Subzones flag to Yes. Then, select the zone of interest to you from the Zone list. This will populate the Component Type list with the types of components that are part of the chosen zone. If you select a component type from the Component Type list, then, all components of that type, which are part of the chosen zone, will be displayed in the Components list for selection. If there are too many components in the list to choose from, you can narrow your search further by using the Search text box. Specify the whole/part of the component name to search for in this text box, and click the
icon next to it. The Components list will then be populated with all component names that embed the specified search string. Select the component of your choice from this list.If the Components list consists of too many components, then viewing all the components and selecting the ones you need for report generation could require endless scrolling. To avoid this, you can click the
 button next to the Components list. The COMPONENTS pop up window will then appear using which you can view almost all the components in a single interface and select the ones for which the report is to be generated.
- Service:If the component for which reports are to be generated is involved in the delivery of a particular service, then pick this option from the Report for list. Doing so will invoke a Service list from which a service name is to be chosen. Upon selection of a service, the component types that are part of the service will populate the Component Type list in this page. Once you pick a component type, all components of that type, which are engaged in the delivery of the chosen service, will be displayed as candidates for selection in the Components list. If there are still too many components in the list to choose from, you can narrow your search further by using the Search text box. Specify the whole/part of the component name to search for in this text box, and click the
-
Then, select the period (Timeline) for which the graph is to be generated (see Figure 1). You can either provide a fixed time line such as 1 hour, 2 days, etc., or select the Any option from the list to provide a From and To date/time for report generation.
Note:
For every user registered with the eG Enterprise system, the administrator can indicate the maximum timeline for which that user can generate a report. Once the maximum timeline is set for a user, then, whenever that user logs into eG Reporter and attempts to generate a report, the Timeline list box in the report page will display options according to the maximum timeline setting of that user. For instance, if a user can generate a report for a maximum period of 3 days only, then 3 days will be the highest option displayed in the Timeline list - i.e., 3 days will be the last option in the fixed Timeline list. Similarly, if the user chooses the Any option from the Timeline list and proceeds to provide a start date and end date for report generation using the From and To specifications, eG Enterprise will first check if the user's Timeline specification conforms to his/her maximum timeline setting. If not, report generation will fail. For instance, for a user who is allowed to generate reports spanning over a maximum period of 3 days only, the difference between the From and To dates should never be over 3 days. If it is, then, upon clicking the Run Report button a message box will appear, prompting the user to change the From and To specification.
-
In addition to the settings discussed above, this report comes with a set of default specifications. These settings are hidden by default. If you do not want to disturb these default settings, then you can proceed to generate the report by clicking the Run Report button soon after you pick one/more components from the Components list. However, if you want to view and then alter these settings (if required), click on the
 icon. The MORE OPTIONS drop down window will then appear with the default settings (see Figure 2). The steps below discuss each of these settings and how they can be customized.
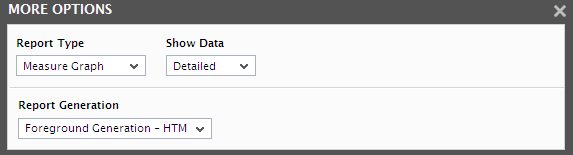
Figure 2 : The default settings for generating the Application Performance report
-
From Figure 2, select the type of report to be generated from the Report Type list box. The options available are as follows:
- Measure: Select this option if measurement values for different metrics have to be plotted with time of day.
-
Summary: Select this option to plot the service level achievements of different metrics during a designated period. When this option is chosen, a Duration list will appear with the following options:
- Hourly Summary: This option, when chosen, highlights the service levels of different measurements (i.e. the % of time a measurement was in compliance with its threshold) on an hourly basis.
- Daily Summary: This option, when chosen, highlights the service levels of different measurements (i.e. the % of time a measurement was in compliance with its threshold) on a daily basis.
- Monthly Summary: This option, when chosen, highlights the service levels of different measurements (i.e. the % of time a measurement was in compliance with its threshold) on a monthly basis.
-
Trend: Selecting this option will enable you to plot the trend values of different metrics computed over a period of time. Past trends in performance can be analyzed and accordingly, the future operational capacity of the targets can be planned using this report. If you select Trend as the Report type, a Graph Type list will appear. The Graph Type options are as follows:
- Min/Max : Select this option to generate a report that plots the minimum and maximum values registered by different metrics during a specified timeline.
- Avg: Select this option to generate a report that plots the average values computed for various metrics during a specified timeline.
- Sum: Select this option to generate a report that plots the sum of the values of a measure during a specified timeline.
-
The speed with which a report is generated depends primarily on the report Timeline. While a Timeline that varies between a couple of days to a week enables the eG Enterprise system to quickly retrieve the required data, timelines that span multiple weeks/months could slow-down the data retrieval and report generation process to a considerable extent, owing to the volume of data involved. In order to ensure quick and easy access to reports, eG Enterprise provides you the option of enabling data retrieval from the Trend information in the database, instead of the Detailed test information that is used by default for report generation. The Detailed test information based comprises of multiple measurement records for a test - one or more each for every test execution. Whereas, the Trend information includes only hourly, daily, and monthly summary computations for a test performed on a continuous basis. For instance, during a period of 1 hour, a test that runs every 5 minutes inserts atleast 12 records into the Detailed test information base. On the other hand, the Trend information base would consist of only 1 record for the same 1 hour period. Fewer the number of records, query execution becomes much quicker, and data retrieval faster. To use the trend data for report generation, you will have to select the Trend option from the Show Data field in Figure 2. By default, the Detailed option is selected here in Figure 2 indicating that the report data is retrieved from the detailed test information in the database. If need be, you can also ensure that all reports always use the Detailed test tables alone by hiding the Show Data field from the reporter interface. To achieve this, do the following:
- Login to the eG administrative interface as 'admin'.
- Select the Manager option from the Settings tile that appears when the
 button against the Admin tab is clicked.
 -
From the GENERAL SETTINGS page that then appears, if you set the Compute average/sum of metrics while trending flag to No, then the Show Data field will not appear in the reporter interface; this denies users access to the Trend option, and thus ensures that reports are always generated using the Detailed tables.
Note:
- A Trendreport will not include the data for the current day since trend data is only computed at the end of the day.
- If the Trend option is chosen, the time period of the report should be greater than 1 day.
-
The usage of Detailed test tables for generating reports, especially those that span weeks, increases the stress on the eG database, thus resulting in undue delays in report generation. In order to ensure that the database is not choked by such voluminous data requests, you can configure eG Enterprise to automatically "force" the use of the Trend option if the Timeline of a report exceeds a pre-configured duration. To specify this time boundary, do the following:
- Edit the eg_report.ini file in the <EG_INSTALL_DIR>\manager\config directory.
- In the [MISC] section of the file, you will find a DetailedTime parameter.
- Specify the duration (in days) beyond which Detailed reports cannot be generated, against the DetailedTime parameter, and save the eg_report.ini file.
- For instance, to make sure that Detailed reports are disallowed for a Timeline of over 2 weeks, set the DetailedTime parameter to 14 and save the file.
- Say, subsequently, you attempt to generate a Detailed report for a Fixed Timeline of 3 weeks (which is greater than the 14-day limit set in our example). The instant you select the 3 weeks option from the Fixed list box, the Detailed option gets automatically disabled, and the Trend option gets enabled. Similarly, if you specify an Any Timeline that runs over 14 days, then, upon clicking the Run Report button to generate the report, a message box appears (see Figure 8) informing you that only the Trend option is permitted.
- To proceed with the Trend report generation, click the OK button in the message box.
-
In large environments, reports generated using months of data can take a long time to complete. Administrators now have the option of generating reports on-line or in the background. When a report is scheduled for background generation, administrators can proceed with their other monitoring, diagnosis, and reporting tasks, while the eG manager is processing the report. This saves the administrator valuable time. To schedule background processing of a report, select the Background Save - PDF from the Report Generation list. In this case, a Report Name text box will appear, where you would have to provide the name with which the report is to be saved in the background. To process reports in the foreground, select the Foreground Generation - HTML option from this list.
Note:
- The Report Generation list will appear only if the EnableBackgroundReport flag in the [BACKGROUND_PROCESS] section of the eg_report.ini file (in the <EG_INSTALL_DIR>\manager\config directory) is set to Yes.
- The default selection in the Report Generation list will change according to the Timeline specified for the report. If the Timeline set is greater than or equal to the number of days specified against the MinDurationForReport parameter in the [BACKGROUND_PROCESS] section of the eg_report.ini file, then the default selection in the Report Generation list will be Background Save - PDF. On the other hand, if the Timeline set for the report is lesser than the value of the MinDurationForReport parameter, then the default selection in the Report Generation list will be Foreground. This is because, the MinDurationForReport setting governs when reports are to be processed in the background. By default, this parameter is set to 2 weeks - this indicates that by default, reports with a timeline of 2 weeks and above will be processed in the background.
-
Finally, click on the Run Report button to generate the graph. If the option chosen from the Report Generation list is Foreground Generation - HTML, then, clicking on the Run Report button will invoke Figure 3.
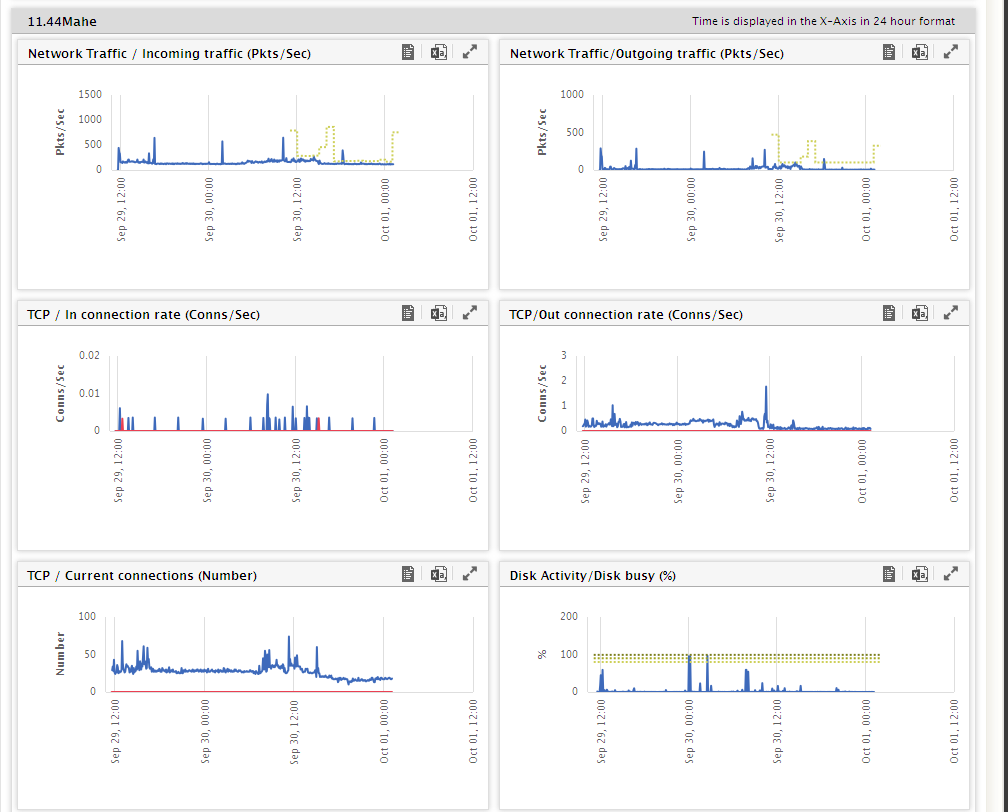
- Figure 3 is a classic example for specific configurations overriding the default ones. Accordingly, Application-Measure reports specifically defined for the Oracle server 192.168.10.8:1521:egurkha have been generated and displayed. Also, note that the graphs for the OracleTablespaces test measures are descriptor-based. For more details on configuring specific Application-Measure reports, refer to Section Specific Reports .
-
In the case of measures that take descriptors, Figure 4 will be able to display a maximum of 10 descriptors in one graph, by default. To view the complete list of descriptors more clearly, click on the graph. Note that the OracleTablespaces test of Figure 4 takes descriptors. To view the descriptors more clearly, click on the OracleTablespaces test graph (see Figure 4).
Note:
The maximum number of descriptors that can be displayed in the OPERATIONS REPORTpage is configurable. For that, set the MaxInfos parameter in the [INFOS] section of the eg_report.ini (in the <EG_INSTALL_DIR>\manager\config directory) to the required value. By default, this parameter will be set to 10, indicating that a maximum of 10 descriptors can be plotted in a single graph in the APPLICATION PERFORMANCEpage.
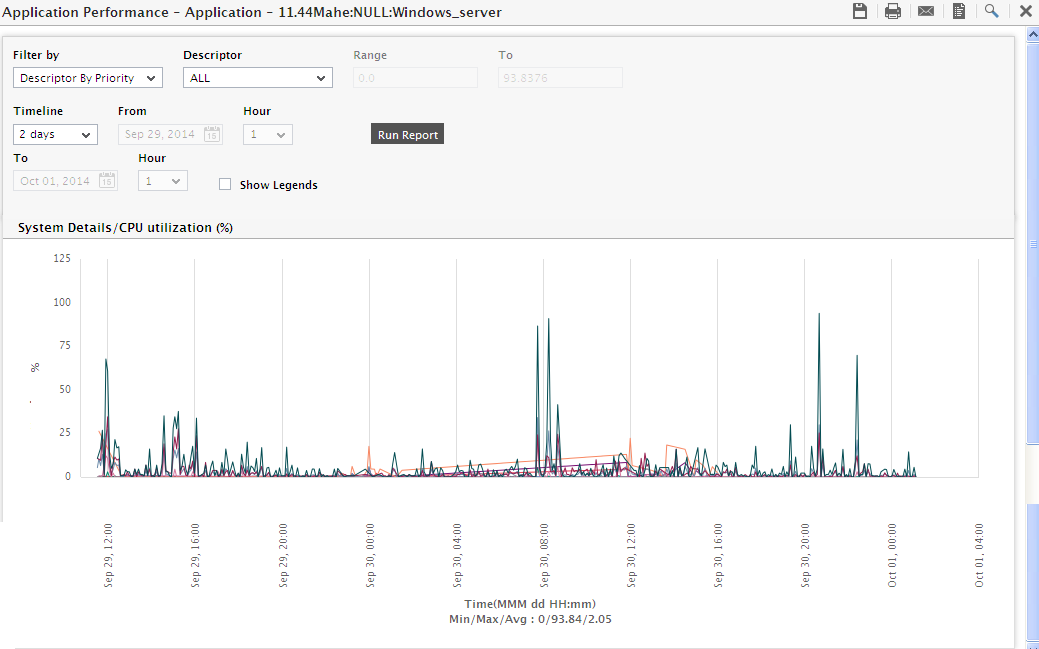
Figure 4 : Enlarged OracleTablespaces test graph displaying the descriptors (the tablespaces)
-
If a report comprising of more than 5 descriptors is enlarged, then Figure 4 will provide you with options to restrict your view to specific descriptors only. In our example, let us view the graph pertaining to the top 5 tablespaces that have utilized the maximum space. To do so, first, select the Descriptors option from Figure 4. Then, select the Top - 5 option from the adjoining list box. Figure 5 will then appear.
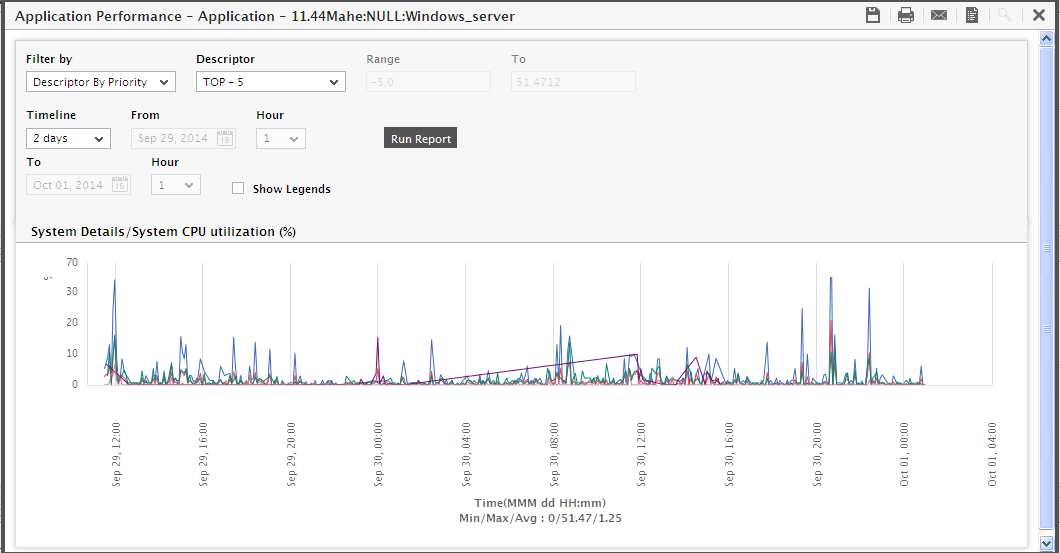
-
Similarly, you can choose to view reports pertaining to the Top - 1 to the Top - 10 consumers of tablespace. Alternatively, you can select the Range option. If this is done, then, using the adjoining text boxes you can specify a minimum and maximum value. The eG Reporter will then generate a report for only those tablespaces which currently consume space within the specified limits (see Figure 5). For example, to know the tablespaces that consume space between the range of 20 to 27 %, specify ‘20’ in the text box before To, and 27 in the text box that follows To (see Figure 5). Figure 6 will then appear.
Note:
The threshold setting of a measure determines the options that will be displayed in the Descriptor list box of Figure 4. If only a Minimum Threshold is set for a measure, then the Descriptor list box will display ‘Last’ options and not ‘Top’ options. For example, the Free_memory measure of the OracleTablespaces Test carries a Minimum threshold setting only. In such a case, using the Descriptor option of Figure 4, you will be able to view information on tablespaces with the least free space. In other words, the usual ‘Top - 1’ to ‘Top - 10’ options will be replaced by ‘Last - 1’ to ‘Last - 10’ options. Similarly, if a measure carries only a Maximum Threshold setting, or both Minimum and Maximum thresholds, then only the ‘Top’ options will be available in the Descriptor list box.
If a measure takes less than 10 descriptors, say only 5 descriptors, then the Descriptor list box in Figure 4 will offer only the Top - 1 to Top - 5 options (or Last - 1 to Last - 5 options, as the case may be). If the number of descriptors exceeds 10, then the Descriptor list box will provide an option range of Top - 1 to Top - 10 (or Last - 1 to Last - 10) only.
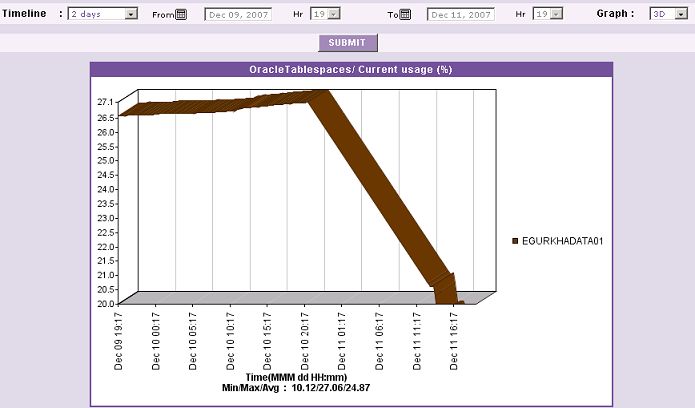
Figure 6 : Viewing the report for tablespaces that consume space in the range of 20-27%
- On the other hand, if the Background Save - PDF option is chosen from the Report Generation list, then clicking on the Run Report button will not generate the report and display it in this page for your benefit. Instead, a message indicating that the report is being processed in the background will appear. This will be accompanied by a link that will lead you to the page that lists all the reports that are being processed in the background, and their current status. If background report generation fails for a report, you can regenerate that report using this page, or can even delete that report if need be. On the other hand, if background processing successfully completes for your report, then, you can view a PDF of the report by clicking on the
 icon in that page.