Virtual Applications / Desktops - Zone Performance
A Virtual Applications / Desktops - Zone Performance report provides a comprehensive overview of the performance of a thin-client farm. Metrics of interest (pre-specified by the administrator) are aggregated across all the Citrix/Microsoft RDS/VMware VDI servers in the farm, and a summary describing the performance of a farm is provided as part of the Zone Performance report. Additionally, for each of the servers, critical metrics are reported for the timeline chosen by the user. These metrics provide key insights into how the server farm is performing and where the bottlenecks may be.
To view the Virtual Applications / Desktops - Zone Performance report, do the following:
- Select the Zone Performance option from the Virtual Applications / Desktops sub-node of the Domain-specific Reports node of the REPORTS BY FUNCTION tree.
-
Figure 1 will then appear. To monitor the servers that form part of a specific farm, select the Zone to which the servers in the farm have been added. By default, the Zone list displays only those zones that contain components belonging to thin client servers.
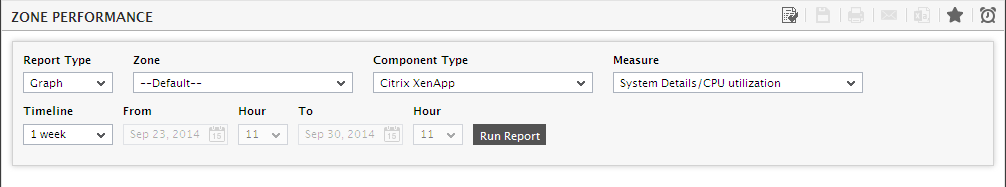
Figure 1 : Generating a Zone Performance report for a thin client server
-
Once the Zone is chosen, eG searches the zone for component types that are applicable for this report. The matching component types alone populate the Component Type list. To receive an overview of the performance of all servers of a particular type across a chosen zone, select a Component type from this list.
Note:
If no zones are currently configured, then you can use the Default zone to generate the Zone Performancereport.
- Next, choose a Report Type (Graph or Data). The default Report Type is Graph. To closely observe and clearly understand the behavior of a single performance parameter across a component-type, you can plot a single measure's data alone in a Graph report (see Figure 1).
- When the Report Type is Graph, a Criteria list box will appear, containing the complete list of measures that has been configured for generating the report. From this list, pick a measure for which the report is to be generated as a graph (see Figure 1).
-
You can either provide a fixed Timeline such as 1 hour, 2 days, etc., or select the Any option from the list to provide a From and To date/time for report generation.
Note:
- The default Timeline can be set using the CONSOLIDATED REPORTS page in the eG administrative interface; to access this page, follow the menu sequence: Admin -> Settings -> Reporter -> Consolidated Reports. For more details regarding this page, refer to Section Consolidated Reports of this manual.
-
Shorter the Timeline for a report, lighter would be the query that is executed on the database, and faster the report generation. Report Timelines that run across many weeks therefore, cause excessive strain on the database, thus slowing-down report generation. To save the eG backend from injury, eG Enterprise automatically restricts the maximum Timeline for which a thin client report can be generated to the lower of the following values:
- the value of the Citrix LoginTest parameter in the [ddd_cleanup] section of the eg_format.ini file (in the <EG_INSTALL_DIR>\manager\config directory)
- the value of the MaxTimeline parameter in the [MISC] section of the eg_report.ini file (in the <EG_INSTALL_DIR>\manager\config directory).
-
The maximum Timeline for which the current user to eG Reporter is permitted to generate reports;
The [ddd_cleanup] section is where you define the interval (in days) at which the detailed diagnosis of specific tests is to be purged from the database. For the Citrix LoginTest, the default interval is set to 32 days (i.e., just over a month), indicating that, by default, the detailed diagnosis of the Citrix LoginTest is cleared from the database at the end of every month. Since critical thin client reports are generated based on the detailed diagnosis information, a Timeline that exceeds the duration set against Citrix LoginTest would result in a report that displays invalid/no data. This duration however, is configurable. Similarly, you can also configure a MaxTimeline in the [misc] section of the eg_report.ini file. By default, this parameter is set to 168 (hours), indicating that the maximum Timeline for a thin client report is 1 week (i.e., 24 * 7 = 168 hours). Also, while creating user profiles using the eG administrative interface, an administrator can indicate the maximum timeline for which that user can generate reports, so as to avoid long running reports.
Now, assume that you have set the Citrix LoginTest parameter to 21 days (i.e., 3 weeks) and the MaxTimeline parameter to 336 hours (i.e., 2 weeks). Also, say that user john with access rights to eG Reporter has been configured to generate reports for a maximum timeline of 1 week. Therefore, whenever user john logs into eG Reporter and attempts to generate a thin client report, eG Enterprise compares the three values, picks the lowest of the three, and sets that value as the maximum Timeline for thin client reports. In our example, the maximum timeline settings of user john (i.e., 1 week) is the lowest Therefore, the maximum value that will be available for selection from the Fixed Timeline list box in the thin client report page will be 1 week.
Note that this timeline restriction does not apply to fixed timeline settings alone. If a user chooses the Any option from the Timeline list and proceeds to provide a start date and end date for report generation using the From and To specifications, eG Enterprise will first check if the user's Timeline specification is equal to or below the lowest of the three values discussed above. If not, report generation will fail. For instance, for a user who is allowed to generate reports spanning over a maximum period of 3 days only, the difference between the From and To dates should never be over 3 days. If it is, then, upon clicking the Run Report button a message box will appear, prompting the user to change the From and To specification.
-
In addition to the settings discussed above, this report comes with a set of default specifications. These settings are hidden by default. If you do not want to disturb these default settings, then you can proceed to generate the report by clicking the Run Report button soon after you pick a Criteria. However, if you want to view and then alter these settings (if required), click on the
 icon. The default settings will then appear in the MORE OPTIONS drop down window (see Figure 2). The steps below discuss each of these settings and how they can be customized.
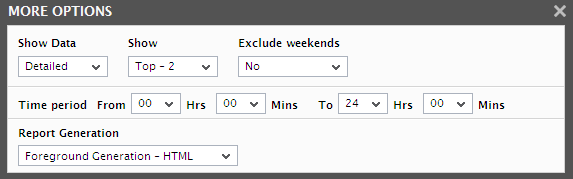
Figure 2 : The default settings for generating a thin client Zone Performance report
-
The speed with which a report is generated depends primarily on the report Timeline. While a Timeline that varies between a couple of days to a week enables the eG Enterprise system to quickly retrieve the required data, timelines that span multiple weeks/months could slow-down the data retrieval and report generation process to a considerable extent, owing to the volume of data involved. In order to ensure quick and easy access to reports, eG Enterprise provides you the option of enabling data retrieval from the Trend information in the database, instead of the Detailed test information that is used by default for report generation. The Detailed test information base comprises of multiple measurement records for a test - one or more each for every test execution. Whereas, the Trend information includes only hourly, daily, and monthly summary computations for a test performed on a continuous basis. For instance, during a period of 1 hour, a test that runs every 5 minutes inserts atleast 12 records into the Detailed test information base. On the other hand, the Trend information base would consist of only 1 record for the same 1 hour period. Fewer the number of records, query execution becomes much quicker, and data retrieval faster. To use the trend data for report generation, you will have to select the Trend option from the Show Data field in Figure 2. By default, the Detailed option is selected in Figure 2 indicating that the report data is retrieved from the detailed test information in the database. If need be, you can also ensure that all reports always use the Detailed test tables alone by hiding the Show Data field from the reporter interface. To achieve this, do the following:
- Login to the eG administrative interface as 'admin'.
- Select the Manager option from the Settings tile that appears when the
 button against the Admin tab is clicked.
 -
From the GENERAL SETTINGS page that then appears, if you set the Compute average/sum of metrics while trending flag to No, then the Show Data field will not appear in the reporter interface; this denies users access to the Trend option, and thus ensures that reports are always generated using the Detailed tables.
Note:
- A Trend report will not include the data for the current day since trend data is only computed at the end of the day.
- If the Trend option is chosen, the time period of the report should be greater than 1 day.
-
The usage of Detailed test tables for generating reports, especially those that span weeks, increases the stress on the eG database, thus resulting in undue delays in report generation. In order to ensure that the database is not choked by such voluminous data requests, you can configure eG Enterprise to automatically "force" the use of the Trend option if the Timeline of a report exceeds a pre-configured duration. To specify this time boundary, do the following:
- Edit the eg_report.ini file in the <EG_INSTALL_DIR>\manager\config directory.
- In the [MISC] section of the file, you will find a DetailedTime parameter.
- Specify the duration (in days) beyond which Detailed reports cannot be generated, against the DetailedTime parameter, and save the eg_report.ini file.
- For instance, to make sure that Detailed reports are disallowed for a Timeline of over 2 weeks, set the DetailedTime parameter to 14 and save the file.
- Say, subsequently, you attempt to generate a Detailed report for a FixedTimeline of 3 weeks (which is greater than the 14-day limit set in our example). The instant you select the 3 weeks option from the Fixed list box, the Detailed option gets automatically disabled, and the Trend option gets enabled. Similarly, if you specify an AnyTimeline that runs over 14 days, then, upon clicking the Run Report button to generate the report, a message box appears informing you that only the Trend option is permitted.
- To proceed with the Trend report generation, click the OK button in the message box. To terminate Trend report generation, click the Cancel button.
-
Next, specify the start time and end time for report generation against the Time period field.
Note:
The default Time period to be displayed here can be configured using the consolidated reports page in the eG administrative interface; to access this page, follow the menu sequence: Configure -> Reports -> Consolidated. For more details regarding this page, refer to Section Consolidated Reports of this manual.
-
If the timeline specified for the report needs to exclude the data collected during the Weekends, then set Exclude weekends to Yes. If not, select No.
Note:
You can configure the days of the week that need to be considered as a ‘weekend’ using the consolidated reports page in the eG administrative interface; to access this page, follow the menu sequence: Configure -> Reports -> Consolidated. For more details regarding this page, refer to Section Consolidated Reports of this manual.
-
Besides a pie chart, the report of type Graph will also invoke a comparative bar graph. This bar graph will, by default, reveal the top - 10 components (of a particular type or across all types) in the selected Zone in terms of the Measure chosen. This is why, the Show list is set to Top-10 by default. You can however view any number of top/bottom players in a particular performance area by picking any top or last option from the Show list.
Note:
By default, the values displayed in the Show list range from top-10 to Last-10. This is because, the Showtop parameter in the [infos] section of the eg_report.ini file (in the <EG_INSTALL_DIR>\manager\config directory) is set to 10, by default. You can, if required, configure the Show list to display a different range of options. For this, specify a different number against the Showtop parameter, and save the eg_report.ini file.
-
In large environments, reports generated using months of data can take a long time to complete. Administrators now have the option of generating reports online or in the background. When a report is scheduled for background generation, administrators can proceed with their other monitoring, diagnosis, and reporting tasks, while the eG manager is processing the report. This saves the administrator valuable time. To schedule background processing of a report, select the Background Save - PDF option from the Report Generation list. In this case, a Report Name text box will appear, where you would have to provide the name with which the report is to be saved in the background. To process reports in the foreground, select the Foreground Generation - HTML option from this list.
Note:
- The Report Generation list will appear only if the EnableBackgroundReport flag in the [BACKGROUND_PROCESS] section of the eg_report.ini file (in the {EG_INSTALL_DIR}\manager\config directory) is set to Yes.
- The default selection in the Report Generation list will change according to the Timeline specified for the report. If the Timeline set is greater than or equal to the number of days specified against the MinDurationForReport parameter in the [BACKGROUND_PROCESS] section of the eg_report.ini file, then the default selection in the Report Generation list will be Background. On the other hand, if the Timeline set for the report is lesser than the value of the MinDurationForReport parameter, then the default selection in the Report Generation list will be Foreground. This is because, the MinDurationForReport setting governs when reports are to be processed in the background. By default, this parameter is set to 2 weeks - this indicates that by default, reports with a timeline of 2 weeks and above will be processed in the background.
- Finally, click the Run Report button to generate the report.
-
If the Report Type is Graph and the option chosen from the Report Generation list is Foreground Generation - HTML, then, clicking on the Run Report button will invoke Figure 3, which will comprise of the following:
-
A distribution pie chart that reveals the number of components in different distribution ranges (see Figure 3). The distribution ranges are obtained based on the first of the configured functions for the chosen Criteria. For instance, assume that CPU utilization is the chosen Criteria. Say that you have configured to display the Avg and Max of CPU utilization in the zone report. Typically, both these configured values will appear only in a Data report. In the case of a Graph report however, the first of the two functions - i.e., Avg of CPU utilization - alone is calculated for every component of the chosen component-type. The resulting pie chart enables administrators to deduce, at a glance, the number of components where the chosen performance metric has fared well and/or badly. Clicking on a particular slice in the pie chart lists the components that fall within the value range represented by that slice (see Figure 4). Against every component name, the actual values for each of the configured functions (both Avg and Max, in our example), and also the Health % of each of the components will be displayed. A zone-level Summary of the chosen Measure and the Normal % will also be available.
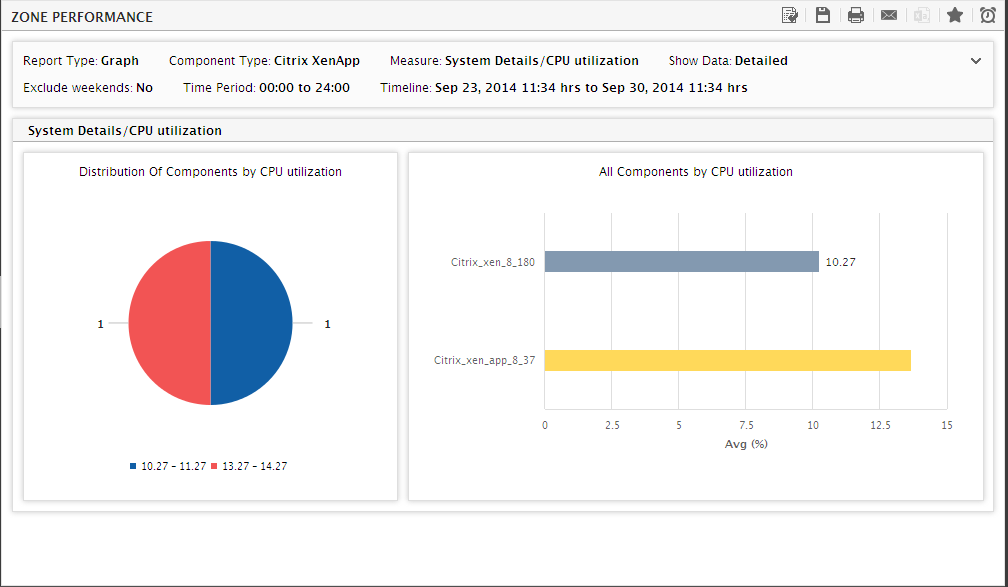
Figure 3 : A graphical Zone report
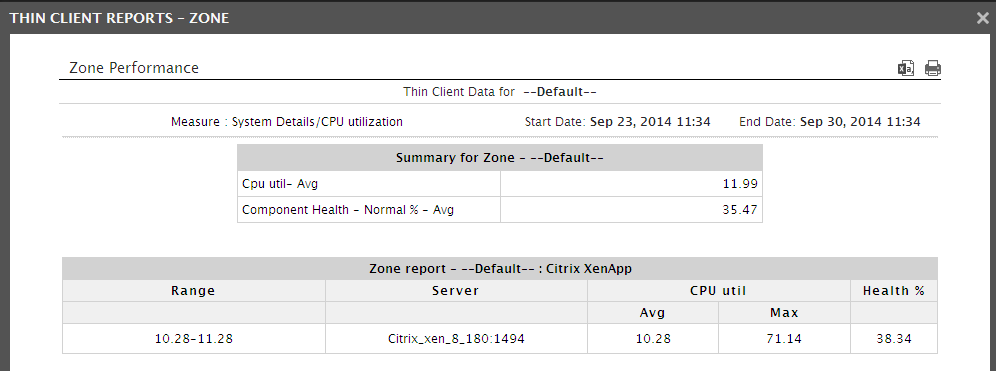
Figure 4 : A list of components with CPU utilization in a given range
Note:
By default, the chart type for distribution is a pie chart. However, you can have a bar graph depict the same data instead of a pie chart, by following the steps given below:
- Edit the eg_report.ini file in the <EG_INSTALL_DIR>\manager\config directory.
- Change the value of the chartTypeForDist parameter in the [zone_report] section of this file from the default Pie, to Bar.
- Save the eg_report.ini file.
By default, the number of value ranges that need to be configured for the distribution chart is 10. To override this default setting, do the following:
- Edit the eg_report.ini file in the <EG_INSTALL_DIR>\manager\config directory.
- Specify a number of your choice against the nofRangeForDist parameter in the [zone_report] section of this file. By default, this parameter will hold the value 10.
- Save the eg_report.ini file.
-
Adjacent to the pie chart, you will find a bar chart that indicates the components that have topped/failed in a selected performance realm (i.e., the Measure) during the specified Timeline. For example, for the CPU utilization measure, this bar chart reveals the components that are the top CPU-consumers. Like the pie chart, the values for the bar chart are also calculated by applying the first of the configured functions on the chosen Measure. Clicking on the bar corresponding to a server name results in a Server Report (see Figure 5) that enables you to focus on the performance of that server.
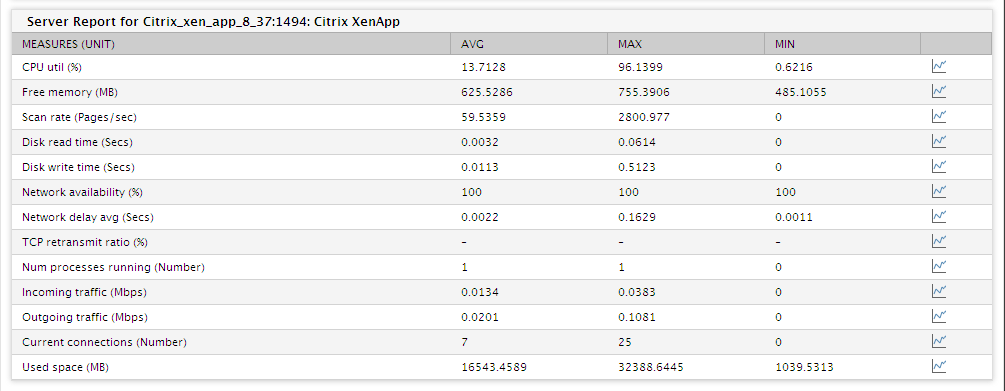
Figure 5 : The server report that appears upon clicking on a bar chart
Note:
The number of components to be displayed in the Top <N> Components bar chart is configurable. To specify the number, do the following:
- Edit the eg_report.ini file in the <EG_INSTALL_DIR>\manager\config directory.
- Specify a number of your choice against the NoOfServersforChart parameter in the [zone_report] section of the file. By default, the value displayed here is 10, indicating that, by default, the bar chart will be for the Top 10 Components. For example, if you change this value to 5, then a bar chart displaying the Top 5 Components will appear.
- Finally, save the eg_report.ini file.
Similarly, you can configure the depth of the bars in the bar chart by specifying a numeric value against the 3DDepthforChart parameter in the [ZONE_REPORT] section of the eg_report.ini file (in the [EG_INSTALL_DIR]\manager\config directory).
By default, 10 bars will be visible in a single glance in the bar chart. If there are more bars, you will have to scroll down to view them. This default setting can be overridden by editing the eg_report.ini file (in the [EG_INSTALL_DIR]\manager\config directory). The [ZONE_REPORT] section of this file contains a VisibleSamples parameter that holds the default value 10. You can change this value.
Note:
You can configure the colors to be used in the distribution chart and the Top <N> Components bar chart in the zone report, by editing the eg_report.ini file in the <EG_INSTALL_DIR>\manager\config directory. The [ZONE_REPORT] section of the file defines the 20 default colors of the distribution and bar charts:
[ZONE_REPORT]
ChartColor=#8399b0,#ffd95a,#a4ac91,#98d980,#d5b996,#f48848,#8b8cc2,
#eb4052,#c4b3d0,#b18651,#ebb7ce,#028768,#f5c372,#887c65,#e4c536,
#b5582c,#f94989,#770d72,#97a067,#89aeb7distColor=#115fa6,#f25454,#60bd68,#b276b2,#81bef7,#a61120,#ffd13e,
#770d72,#887c65,#a4ac91You override the default color settings of the distribution chart by modifying the color-codes specifying against distColor. For changing the colors used by the Top <N> Components chart, alter the codes listed against the ChartColor parameter.
-
- Unlike a Graph report, a Data report does not graphically represent the measure data. Instead, the configured details are presented in a tabular format in the report.
- If the Report Type is Data , then, like in the case of a Graph report, specify a Time period, indicate whether to Exclude weekends or not, indicate whether report is to be generated using Detailed data or Trend data, and then provide a report Timeline.
- Finally, click the Run Report button.
-
The Data report will display two tables providing the user-configured details (see Figure 6) for the chosen component-type. By default, the Summary section of the report will display the average values of each of the configured measures across the farm. In the section providing per-server information though, eG Enterprise will display multiple values for a measure depending upon the number and type of functions that have been configured for the measure. For example, in Figure 6, note that the second section displays both the Avg and Max values for the Cpu util measure, but only the Avg value for the Network Availability measure.
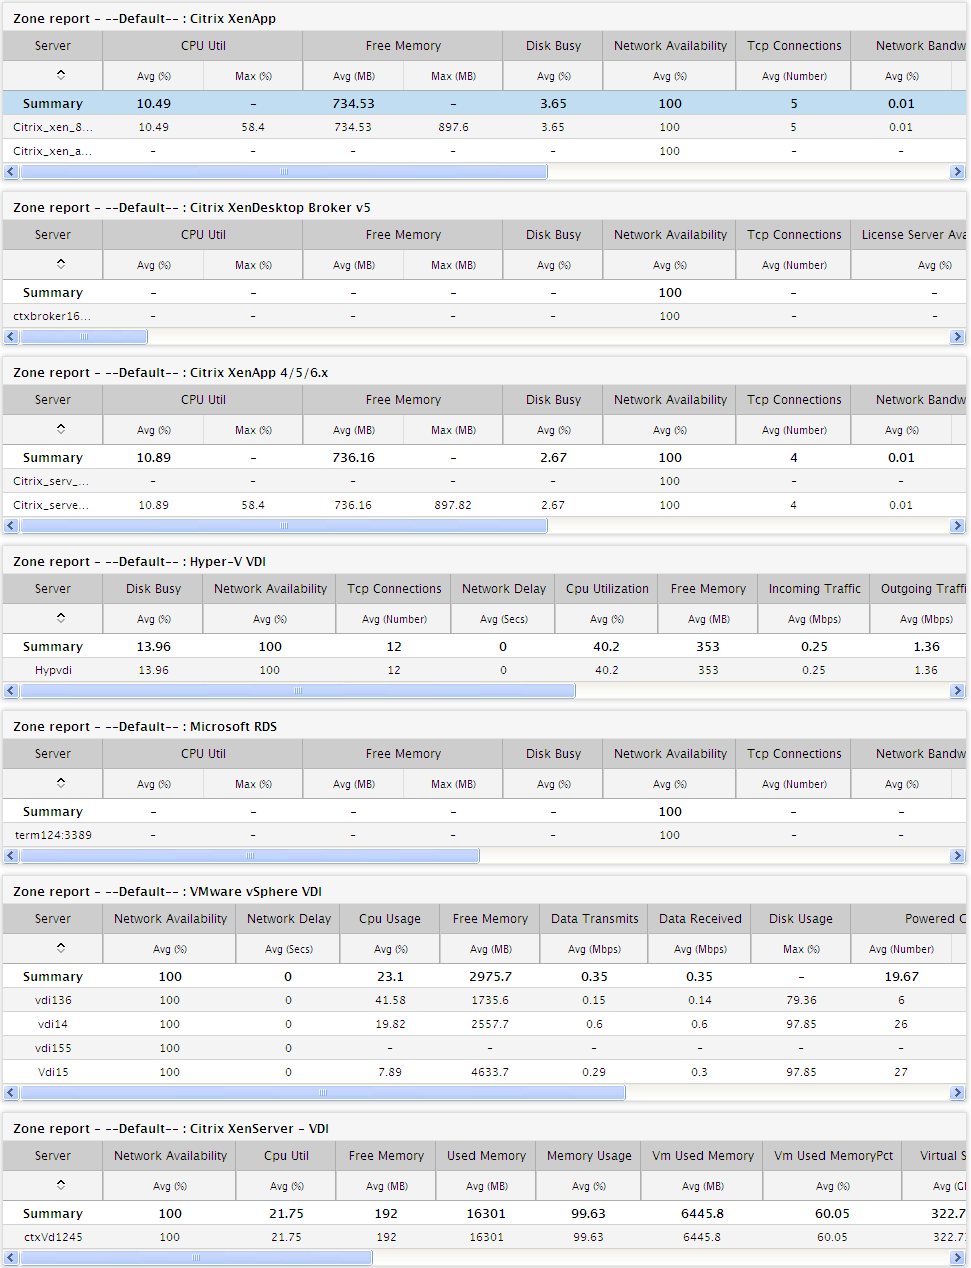
- Besides the above-mentioned details, the second section of the Data report also contains a Health % column. This column indicates the percentage of time a particular server has been in the Normal state during the chosen timeline. If a server has remained the constant victim of problems during the specified time period, then this percentage will obviously be low. To drill down to the root-cause of the issues affecting the server, click on the corresponding Health % value. This will lead you to the Executive report of the problem server, which will reveal when and what type of problems were encountered by the server.
-
Also, to focus on the health of a particular server displayed in the zone Data report, click on the corresponding Server name in Figure 6. The Server Report will then appear (see Figure 7).
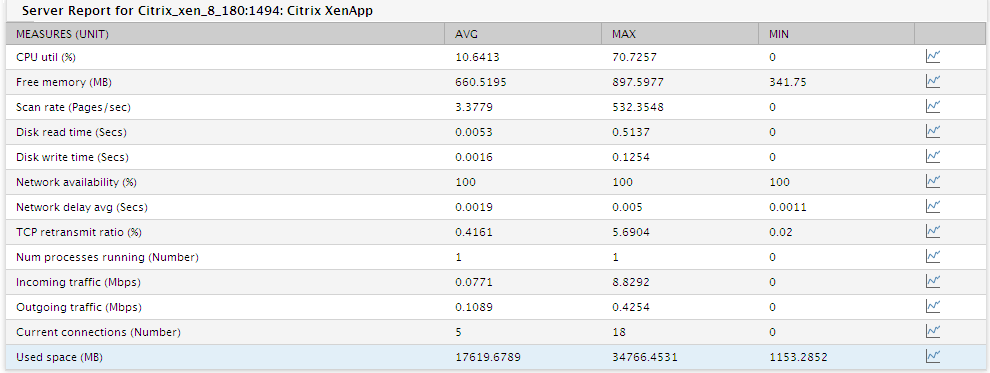
Figure 7 : The Server report of the problem server in the farm report
As stated earlier, you can configure the information that needs to appear in the zone report, by editing the eg_report.ini file in the <EG_INSTALL_DIR>\manager\config directory. For example, to generate the report depicted by Figure 6, specify the following in the [zone_report] section of the eg_report.ini file:
[ZONE_REPORT]
Citrix_MF_XP:SystemTest:Cpu_util#Cpu util=Avg,Max
Citrix_MF_XP:SystemTest:Free_memory#Free Memory (MB)=Avg,Max
Citrix_MF_XP:DiskActivityTest:Percent_busy#Disk busy=Avg
Citrix_MF_XP:NetworkTest:Availability#Network Availability %=Avg
Citrix_MF_XP:TcpTest:Current_connections#Tcp conns=Avg
Citrix_MF_XP:NetworkTrafficTest:Bandwidth_usage#Network bandwidth usage %=Avg,Max
Citrix_MF_XP:CtxConnectionTest:Availability#Citrix availability %=Avg,Max
Citrix_MF_XP:CtxConnectionTest:Pkt_loss_pct#Citrix pkt loss %=Avg,Max
Citrix_MF_XP:CtxDisconnectsTest:Total_disconnects#Total disconnects=Avg,Max
Citrix_MF_XP:SystemTest:Cpu_util#Cpu util=Avg,Max
Typically, measure configurations in the [zone_report] section of the eg_report.ini file should be of the following format:
<InternalComponenttype>:<InternalTest>:<InternalMeasure>#<Display name of measure>=<Comma-separated list of functions>
Before proceeding with the configuring, determine the internal component type, test, and measure names, using the procedure discussed in Page First, determine the Internal name of the test and measure to be configured. For that, do the following: of this manual.
Accordingly, in the first line of the example above:
- Citrix_MF_XP is the <InternalComponenttype>
- SystemTest is the <InternalTest> that reports the measure of interest to us
- Cpu_util is the <InternalMeasure> that is to be displayed in the report page
- The display name of the measure is Cpu util, and finally,
- Avg and Max are the functions that are to be executed on the value of the Cpu_util measure
- The other measures that have been configured are: Free_memory, Percent_busy, Availability (network), Current_connections, Bandwdith_usage, Availability (Citrix), Pkt_loss_pct, Total_disconnects.
This indicates that for the Citrix servers in a zone, the Summary section of the report will display the average values of each of the configured measures. However, for each of the Citrix servers in the zone, the following values will be displayed in the second section of the report:
- The average (Avg) of CPU utilization
- The Max of CPU utilization
- The average (Avg) of Free memory
- The Max of Free memory
- The average (Avg) of Percent_busy
- The average (Avg) of network Availability
- The average (Avg) of Current_connections
- The average (Avg) of Bandwidth_usage
- The average and maximum (Max) of Bandwidth_usage
- The average (Avg) of connection Availability
- The maximum (Max) of connection Availability
- The average (Avg) Packet loss
- The maximum (Max) Packet loss
- The average (Avg) of Total disconnects
- The maximum (Max) of Total disconnects
Note:
- If functions such as Avg, Max, etc., are not explicitly configured in the [ZONE_REPORT] section in the manner discussed above, then the second section of the farm report will, by default, display the average (Avg) values for the configured measures.
- If a display name is not provided for a measure, then the actual measure name will automatically become the display name.