Monitoring Components
To view the status of the components managed in your infrastructure, select the Components option from the Hosts/Applications menu in the eG monitor interface. By default, the page that appears lists the key performance metrics of a component that is managed in your infrastructure.
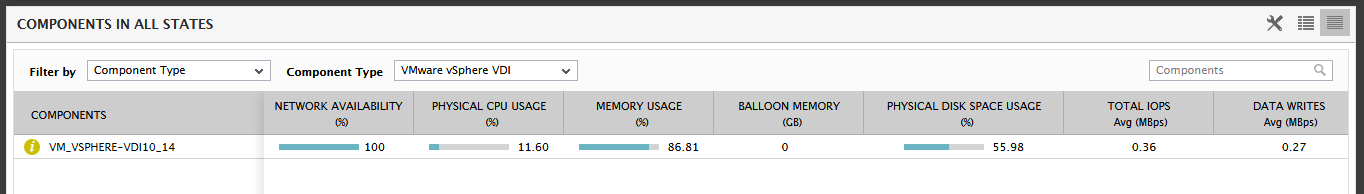
Figure 1 : The COMPONENTS page displaying the key performance metrics
By default, the Component Type option is chosen from the Filter by list. If the zones/services/segments are created by the user who is accessing the eG monitor interface, then the components that are part of the zone/segment/service can be filtered using this list. The Component Type list box by default, lists all the components managed in the target infrastructure. When the COMPONENTS page is accessed for the very first time, the key performance metrics of the component type that comes first in the alphabetical order will be displayed against each component. Clicking on a component will lead you to the layer model page which displays the tests associated with the component and the measures corresponding to each test.
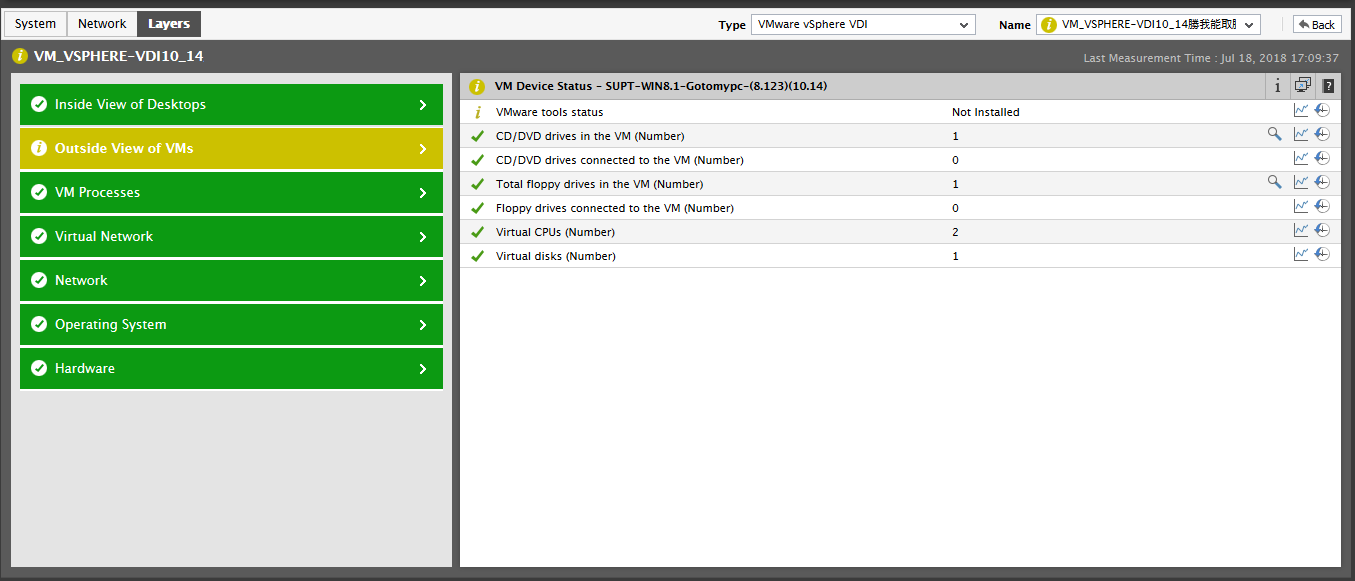
Figure 2 : The layer model page
If the egsm user wants to know the manager on which the component is managed, he/she can click on the name of the component. Figure 3 then appears listing the URL of the manager on which the component is managed.
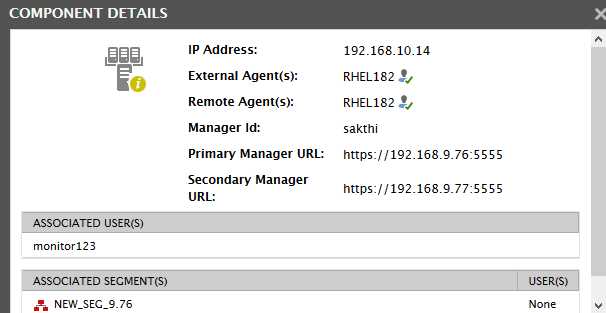
Figure 3 : The URL of the manager on which the chosen component is managed
If the manager on which the component is managed is part of a redundant setup, then both the Primary Manager URL and the Secondary Manager URL will be displayed. Note that clicking on the URL will lead you to the login page of the manager on which the component is managed.
Note:
- If a maintenance policy is applied to a component by an administrator in an individual eG manager, then, the state of the component will automatically be reflected as Normal in the eG SuperManager while the details of the maintenance policy applied on the component cannot be viewed from the eG SuperManager monitor console.
- If a virtual server is monitored in one of the eG managers managed by the eG SuperManager, then, the virtual topology of that server cannot be viewed when you navigate from the layer model page of that server in the eG SuperManager monitor console.
To know more about the COMPONENTS page, refer to the