Monitoring the Tuxedo PIA
eG Enterprise provides a specialized Tuxedo PIA model (see Figure 1.2) for monitoring the Tuxedo Application Server that is at the ‘heart’ of the PeopleSoft Internet Architecture. Using this model, processing bottlenecks within an application domain can be rapidly detected and the reason for these bottlenecks, pinpointed.
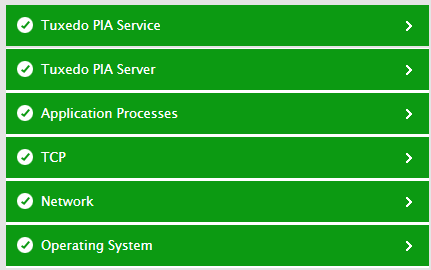
Figure 1 : The layer model of a Tuxedo PIA
Each layer of Figure 2.1 is mapped to tests that run native PeopleSoft Server Administration (PSADMIN) commands on a single application domain in the target application server and pull out metrics. To run these commands, the pre-requisites discussed in the How does eG Enterprise Monitor the Tuxedo PIA Server? chapter should be fulfilled.
Once the tests run and collect the desired metrics, administrators can use these domain-specific metrics to find quick and accurate answers to the following persistent performance queries:
- What is the transaction load on the monitored domain?
- Have any transactions to the domain aborted? If so, which ones are these?
- Is any transaction to the domain about to abort? Which is this?
- What is the current workload of the domain? Which client is imposing the maximum load on the domain?
- Has the domain been configured with adequate server process instances, services, and interfaces to handle the load?
- Are all instances of a server process busy servicing requests presently? Are there idle server process instances in the domain?
- Which is the busiest service in the domain? How quickly is this service processing the requests it receives?
- Is any service unavailable?
- Have too many pending requests been enqueued in any request queue in the domain? Which queue is this and which server process is using this queue? How are the requests in this queue impacting the overall workload of the domain? Should more instances of this server process be configured to reduce the queue length, and consequently, the workload?
- Is the Tuxedo application server able to connect to the database? Are there sufficient number of free connections in the database connection pool to facilitate the connection?
- What is the current workload of the conversational server process (PSSAMSRV) in the monitored domain? Which are the conversations that are contributing to this workload? Has the PSSAMSRV server process been configured right to handle this load?
- Have any errors/warnings been captured by the appsrv log files and tuxlog files?