CPU - ESX Test
This test alerts administrators to issues with the overall CPU usage of the ESX host across processors.
Target of the test : An ESX server host
Agent deploying the test : An internal/remote agent
Outputs of the test : One set of results the ESX server host that is monitored
| Parameter | Description |
|---|---|
|
Test Period |
How often should the test be executed |
|
Host |
The host for which the test is to be configured |
|
Port |
The port at which the specified HOST listens. By default, this is NULL. |
|
ESX User and ESX Password |
In order to enable the test to extract the desired metrics from a target ESX server, you need to configure the test with an ESX USER and ESX PASSWORD. The user credentials to be passed here depend upon the mechanism used by the eG agent for auto-discovering the VMs on the target vSphere server and monitoring the server and its VMs. These discovery/monitoring methodologies and their corresponding configuration requirements have been discussed hereunder:
|
|
Confirm Password |
Confirm the specified ESX PASSWORD by retyping it here. |
|
SSL |
By default, the ESX server is SSL-enabled. Accordingly, the SSL flag is set to Yes by default. This indicates that the eG agent will communicate with the ESX server via HTTPS by default. On the other hand, if the eG agent has been configured to use the VMPerl API or CLI for monitoring (i.e., if the ESX USER parameter is set to none), then the status of the SSL flag is irrelevant. Like the ESX sever, the vCenter is also SSL-enabled by default. If you have chosen to use the vCenter for monitoring all the ESX servers in your environment, then you have to set the SSL flag to Yes. |
|
Webport |
By default, in most virtualized environments, the ESX server and vCenter listen on port 80 (if not SSL-enabled) or on port 443 (if SSL-enabled). This implies that while monitoring an SSL-enabled ESX server directly, the eG agent, by default, connects to port 443 of the ESX server to pull out metrics, and while monitoring a non-SSL-enabled ESX server, the eG agent connects to port 80. Similarly, while monitoring an ESX server via an SSL-enabled vCenter, the eG agent connects to port 443 of vCenter to pull out the metrics, and while monitoring via a non-SSL-enabled vCenter, the eG agent connects to port 80 of vCenter. Accordingly, the WEBPORT parameter is set to 80 or 443 depending upon the status of the ssl flag. In some environments however, the default ports 80 or 443 might not apply. In such a case, against the WEBPORT parameter, you can specify the exact port at which the ESX server or vCenter in your environment listens so that the eG agent communicates with that port. |
|
Virtual Center |
If the eG manager had discovered the target ESX server by connecting to vCenter, then the IP address of the vCenter server used for discovering this ESX server would be automatically displayed against the VIRTUAL CENTER parameter; similarly, the ESX USER and ESX PASSWORD text boxes will be automatically populated with the vCenter user credentials, using which ESX discovery was performed. If this ESX server has not been discovered using vCenter, but you still want to discover the guests on the ESX server via vCenter, then select the IP address of the vCenter host that you wish to use for guest discovery from the VIRTUAL CENTER list. By default, this list is populated with the IP address of all vCenter hosts that were added to the eG Enterprise system at the time of discovery. Upon selection, the ESX USERand ESX PASSWORD that were pre-configured for that vCenter server will be automatically displayed against the respective text boxes. On the other hand, if the IP address of the vCenter server of interest to you is not available in the list, then, you can add the details of the vCenter server on-the-fly, by selecting the Other option from the VIRTUAL CENTER list. This will invoke the ADD VCENTER SERVER DETAILS page. Refer to Adding the Details of a vCenter Server for VM Discovery On the other hand, if you want the eG agent to behave in the default manner -i.e., communicate with each ESX server for monitoring and VM information - then set the VIRTUAL CENTER parameter to ‘none’. |
|
DD Frequency |
Refers to the frequency with which detailed diagnosis measures are to be generated for this test. The default is 1:1. This indicates that, by default, detailed measures will be generated every time this test runs, and also every time the test detects a problem. You can modify this frequency, if you so desire. Also, if you intend to disable the detailed diagnosis capability for this test, you can do so by specifying none against DD FREQUENCY. |
|
Detailed Diagnosis |
To make diagnosis more efficient and accurate, eG Enterprise embeds an optional detailed diagnostic capability. With this capability, the eG agents can be configured to run detailed, more elaborate tests as and when specific problems are detected. To enable the detailed diagnosis capability of this test for a particular server, choose the On option. To disable the capability, click on the Off option. The option to selectively enable/disable the detailed diagnosis capability will be available only if the following conditions are fulfilled:
|
| Measurement | Description | Measurement Unit | Interpretation |
|---|---|---|---|
|
Overall physical CPU utilization: |
Indicates the percentage of physical CPU used by the host. |
Percent |
A very high value for this measure indicates excessive CPU utilization by the host. The CPU utilization may be high because a few processes are consuming a lot of CPU, or because there are too many processes contending for a limited resource. In the event of a CPU contention, you can use the detailed diagnosis of this measure to know which subsystems are consuming CPU resources excessively. |
|
Overall physical CPU throttled: |
Indicates the percentage of scheduling limit over a past minute. |
Percent |
|
|
Overall physical CPU used: |
Indicates the CPU usage in MHz of the VMware ESX host. |
Mhz |
|
|
Reserved capacity: |
Indicates the total CPU capacity that is reserved by the VMs. |
Mhz |
|
|
Time in the COSTOP state: |
Indicates the percentage of time the virtual host was ready to execute commands but was waiting for the availability of multiple pCPUs as the virtual host was configured to use multiple vCPUs. |
Percent |
If the virtual host is unresponsive and the value of this measure is high, it may indicate that the vSphere host has limited CPU resources to simultaneously co-schedule all pCPUs. If this value is low, then any performance problems should be attributed to other issues and not to the co-scheduling of the pCPU. |
|
Total capacity |
Indicates the total CPU capacity reserved by and available for virtual machines. |
MHz |
|
|
Demand |
Indicates the total amount of CPU resources that all the powered on virtual machine on the host would use if there were no CPU contention or CPU limit. |
MHz |
By observing the variations to this measure over time, you will be able to judge how much CPU resources the VMs really require. |
|
Latency |
Indicates the percentage of time for which the powered on virtual machines on the host are ready to run, but are not running because they have reached their maximum CPU limit setting. |
Percent |
A high value of this measure is a cause for concern as it indicates that the VMs on the host have been non-operational for a long time for want of CPU resources. You may want to consider increasing the CPU limits, reservations, and shares for the VMs, so as to preempt such unpleasant situations. |
|
Swap wait |
Indicates the percentage of CPU time spent waiting for swap-in. |
Percent |
If the value of this measure is abnormally high, then check if the host has enough memory for running all VMs. |
|
CPU wait |
Indicates the percentage of CPU time spent in wait state. |
Percent |
CPU wait time includes CPU swap wait time, CPU idle time, and CPU I/O wait time. If the value of this measure is abnormally high, then you may want to check the value of the CPU swap wait time and CPU idle time measures to know on what CPU was waiting the longest - was it waiting for swapping? was it waiting for an I/O operation to complete? or was it just being idle? |
|
Ready |
Indicates the total time that the virtual machines on the host were ready, but could not get scheduled to run on the physical CPU during last measurement interval. |
Percent |
This metric should typically be low - generally 5% or less. If VMs wait too long to run, it can significantly affect the responsiveness of the VMs. |
|
CPU idle |
Indicates the percentage of time that the CPU spent in an idle state. |
Percent |
If the CPU wait time measure is abnormally high, then compare the value of this measure with that of the Swap wait measure to know where the CPU spent maximum time - waiting for swapping? in the idle state? or waiting for an I/O operation? |
|
vCPU vs pCPU utilization ratio |
Indicates the ratio of the number of virtual CPUs utilized to the number of available physical CPUs. |
Percent |
pCPU or ‘physical’ CPU in its simplest terms refers to a physical CPU core i.e. a physical hardware execution context (HEC) if hyper-threading is unavailable or disabled. If hyperthreading has been enabled then a pCPU would consitute a logical CPU. This is because hyperthreading enables a single processor core to act like two processors i.e. logical processors. So for example, if an ESX 8-core server has hyper-threading enabled it would have 16 threads that appear as 16 logical processors and that would constitute 16 pCPUs. As for a virtual CPU (vCPU) this refers to a virtual machine’s virtual processor and can be thought of in the same vein as the CPU in a traditional physical server. vCPUs run on pCPUs and by default, virtual machines are allocated one vCPU each. However, VMware have an add-on software module named Virtual SMP (symmetric multi-processing) that allows virtual machines to have access to more than one CPU and hence be allocated more than one vCPU. The number of virtual machine vCPUs allocated compared to the number of physical CPU cores available is the vCPU-to-pCPU ratio. Determining this ratio will depend on the CPU utilization of the workloads. If workloads are CPU-intensive, the vCPU-to-pCPU ratio will need to be smaller; if workloads are not CPU-intensive, the vCPU-to-pCPU ratio can be larger. If the vCPU-to-pCPU ratio is too large - i.e., if the value of this measure is very high - it can result in high CPU Ready times. This may have a negative impact on the virtual machine's performance. Here are some recommendations:
|
|
Overall CPU core utilization |
Indicates the CPU utilization of the corresponding core as a percentage during the interval. |
Percent |
This measure is reported only if hyper-threading is enabled. |
The detailed diagnosis of the Overall physical CPU utilization measure reveals the percentage of CPU resources that each subsystem consumes. This way, you can quickly identify the subsystem that is consuming CPU abnormally.
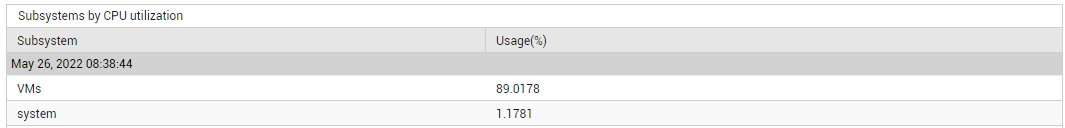
Figure 1 : The detailed diagnosis of the Overall physical CPU utilization measure