Subsystems – ESX Test
This test reports real-time CPU utilization statistics pertaining to the sub-systems of an ESX server, and helps identify those sub-systems that consume too much CPU resources.
Target of the test : An ESX server host
Agent deploying the test : An internal/remote agent
Outputs of the test : One set of results for every sub-system executing on the ESX server host
| Parameter | Description |
|---|---|
|
Test Period |
How often should the test be executed |
|
Host |
The host for which the test is to be configured |
|
Port |
The port at which the specified HOST listens. By default, this is NULL. |
|
ESX User and ESX Password |
In order to enable the test to extract the desired metrics from a target ESX server, you need to configure the test with an ESX USER and ESX PASSWORD. The user credentials to be passed here depend upon the mechanism used by the eG agent for auto-discovering the VMs on the target vSphere server and monitoring the server and its VMs. These discovery/monitoring methodologies and their corresponding configuration requirements have been discussed hereunder:
|
|
Confirm Password |
Confirm the specified ESX PASSWORD by retyping it here. |
|
SSL |
By default, the ESX server is SSL-enabled. Accordingly, the SSL flag is set to Yes by default. This indicates that the eG agent will communicate with the ESX server via HTTPS by default. On the other hand, if the eG agent has been configured to use the VMPerl API or CLI for monitoring (i.e., if the ESX USER parameter is set to none), then the status of the SSL flag is irrelevant. Like the ESX sever, the vCenter is also SSL-enabled by default. If you have chosen to use the vCenter for monitoring all the ESX servers in your environment, then you have to set the SSL flag to Yes. |
|
Webport |
By default, in most virtualized environments, the ESX server and vCenter listen on port 80 (if not SSL-enabled) or on port 443 (if SSL-enabled). This implies that while monitoring an SSL-enabled ESX server directly, the eG agent, by default, connects to port 443 of the ESX server to pull out metrics, and while monitoring a non-SSL-enabled ESX server, the eG agent connects to port 80. Similarly, while monitoring an ESX server via an SSL-enabled vCenter, the eG agent connects to port 443 of vCenter to pull out the metrics, and while monitoring via a non-SSL-enabled vCenter, the eG agent connects to port 80 of vCenter. Accordingly, the WEBPORT parameter is set to 80 or 443 depending upon the status of the SSL flag. In some environments however, the default ports 80 or 443 might not apply. In such a case, against the WEBPORT parameter, you can specify the exact port at which the ESX server or vCenter in your environment listens so that the eG agent communicates with that port. |
|
Virtual Center |
If the eG manager had discovered the target ESX server by connecting to vCenter, then the IP address of the vCenter server used for discovering this ESX server would be automatically displayed against the VIRTUAL CENTER parameter; similarly, the ESX USER and ESX PASSWORD text boxes will be automatically populated with the vCenter user credentials, using which ESX discovery was performed. If this ESX server has not been discovered using vCenter, but you still want to discover the guests on the ESX server via vCenter, then select the IP address of the vCenter host that you wish to use for guest discovery from the VIRTUAL CENTER list. By default, this list is populated with the IP address of all vCenter hosts that were added to the eG Enterprise system at the time of discovery. Upon selection, the ESX USERand ESX PASSWORD that were pre-configured for that vCenter server will be automatically displayed against the respective text boxes. On the other hand, if the IP address of the vCenter server of interest to you is not available in the list, then, you can add the details of the vCenter server on-the-fly, by selecting the Other option from the VIRTUAL CENTER list. This will invoke the ADD VCENTER SERVER DETAILS page. Refer to Adding the Details of a vCenter Server for VM Discovery On the other hand, if you want the eG agent to behave in the default manner -i.e., communicate with each ESX server for monitoring and VM information - then set the VIRTUAL CENTER parameter to ‘none’. |
|
Descriptor Limit |
This test reports a set of metrics for every sub-system that is auto-discovered by the eG agent. Typically, many levels of sub-systems operate on a vSphere erver. If all these sub-systems are monitored, hundreds of records related to sub-systems will end up being stored in the eG database, leaving the database strained. To reduce the stress on the eG database, you may want to restrict the monitoring scope of this test to a few sub-system levels alone. By default, the value of this parameter is set to 2. This means that the test, by default, will monitor only 2 levels of sub-systems.In the sub-system name, the character ‘/’ separates one level from the other. For instance, the sub-systemssystem and vim, which contain no ‘/’ characters in their name,are said to be sub-systems at the first level. The sub-systems system/driversand vim/tmp, which contain a single ‘/’ are sub-systems at the second level. Likewise, system/drivers/kernel is a sub-system at the third level, and so on. In the above example, the default value 2 for this parameter will ensure that the test reports metrics for system, vim, system/drivers,andvim/tmponly, as these are the sub-systems at the first 2 levels. This test therefore will report system, vim, system/drivers,andvim/tmpas its descriptors. If you want the test to monitor the system/drivers/kernelsub-system as well, then you will have to change the value of this parameter to 3. |
|
Detailed Diagnosis |
To make diagnosis more efficient and accurate, eG Enterprise embeds an optional detailed diagnostic capability. With this capability, the eG agents can be configured to run detailed, more elaborate tests as and when specific problems are detected. To enable the detailed diagnosis capability of this test for a particular server, choose the On option. To disable the capability, click on the Off option. The option to selectively enable/disable the detailed diagnosis capability will be available only if the following conditions are fulfilled:
|
| Measurement | Description | Measurement Unit | Interpretation |
|---|---|---|---|
|
Physical CPU usage: |
Indicates the percentage of physical CPU used by this subsystem. |
Percent |
A very high value for this measure indicates excessive CPU utilization by the component. The CPU utilization may be high because a few processes are consuming a lot of CPU, or because there are too many processes contending for a limited resource. If the ESX server being monitored is of version 3 or 3.5, then, an additional vim/console descriptor will appear for this test, which would report the CPU usage of the processes executing on the service console. A high value for the vim/console descriptor indicates that one/more service console processes are consuming CPU resources excessively. The VMs descriptor on the other hand, reports the overall physical CPU usage of all VMs executing on the target vSphere/ESX server. In the event of high physical CPU usage by VMs, you can use the detailed diagnosis available for this descriptor to know which VMs are resource-intensive. |
|
Resource memory overhead: |
Indicates the total of all overhead metrics for powered-on virtual machines, plus the overhead of running vSphere services on this sub-system. |
MB |
vSphere/ESXi virtual machines can incur two kinds of memory overhead:
vSphere/ESXi memory virtualization adds little time overhead to memory accesses. Because the processor’s paging hardware uses page tables (shadow page tables for software-based approach or nested page tables for hardware-assisted approach) directly, most memory accesses in the virtual machine can execute without address translation overhead. The memory space overhead has two components:
Overhead memory includes space reserved for the virtual machine frame buffer and various virtualization data structures, such as shadow page tables. Overhead memory depends on the number of virtual CPUs and the configured memory for the guest operating system. vSphere/ESXi also provides optimizations such as memory sharing to reduce the amount of physical memory used on the underlying server. These optimizations can save more memory than is taken up by the overhead. |
|
Resource memory swapped: |
Indicates the amount of memory that is swapped out of this sub-system group which includes kernels, VMs and console. |
MB |
|
|
Resource memory zero: |
Indicates the amount of memory that is zeroed out of this sub-system. |
MB |
The “Memory Zero” amount will fluctuate as memory is over allocated. vSphere will zero out the VM’s memory to use with other VMs. |
|
Resource memory mapped: |
Indicates the amount of memory that is mapped by this sub-system. |
MB |
|
|
Resource memory share saved: |
Indicates the amount of memory saved from the memory share that is allocated for this sub-system. |
MB |
|
|
Resource memory shared: |
Indicates the current amount of memory that is shared by this sub-system. |
MB |
vShere/ESX can share common memory pages across VMs. This includes pages from VMs running the same virtual machine OS and applications. |
|
Resource memory touched: |
Indicates the amount of memory that has been touched i.e., read from or written to this sub-system in the past X minutes, where X refers to the time period for which this test is executed. |
MB |
|
The VMs descriptor on the other hand, reports the overall physical CPU usage of all VMs executing on the target vSphere/ESX server. In the event of high physical CPU usage by VMs, you can use the detailed diagnosis available for this descriptor to know which VMs are resource-intensive.
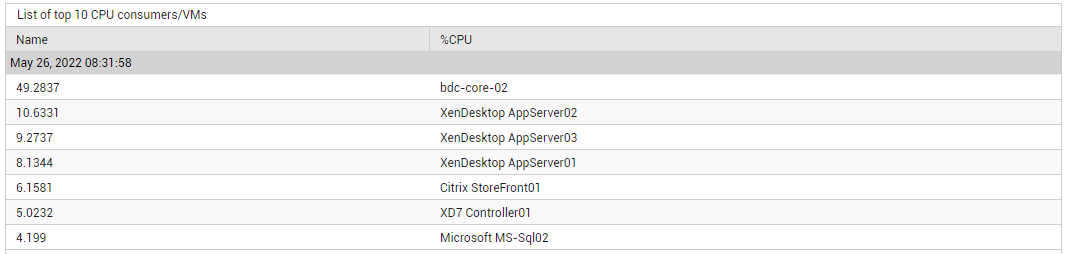
Figure 1 : The detailed diagnosis of the VMs descriptor of the Subsystems - Esx Test