Virtual Network Traffic Test
Each virtual network is serviced by a single virtual switch (vSwitch). Typically, every vSwitch is associated with one/more port groups; a port group specifies port configuration options such as bandwidth limitations and VLAN tagging policies for each logical port on the vSwitch, and thus defines how a connection to the network is made via the vSwitch.
This test monitors the traffic to and from each of the port groups associated with every vSwitch that services the virtual networks on an ESX server. Besides alerting administrators to abnormally high traffic on a vSwitch, this test also leads them to the exact VM in the virtual network that is responsible for this abnormality.
Target of the test : An ESX server host
Agent deploying the test : An internal/remote agent
Outputs of the test : One set of results for each port group associated with every virtual switch that services the virtual networks on the ESX server being monitored
| Parameter | Description |
|---|---|
|
Test Period |
How often should the test be executed |
|
Host |
The host for which the test is to be configured |
|
Port |
The port at which the specified HOST listens. By default, this is NULL. |
|
ESX User and ESX Password |
In order to enable the test to extract the desired metrics from a target ESX server, you need to configure the test with an ESX USER and ESX PASSWORD. The user credentials to be passed here depend upon the mechanism used by the eG agent for auto-discovering the VMs on the target vSphere server and monitoring the server and its VMs. These discovery/monitoring methodologies and their corresponding configuration requirements have been discussed hereunder:
|
|
Confirm Password |
Confirm the specified ESX PASSWORD by retyping it here. |
|
SSL |
By default, the ESX server is SSL-enabled. Accordingly, the SSL flag is set to Yes by default. This indicates that the eG agent will communicate with the ESX server via HTTPS by default. On the other hand, if the eG agent has been configured to use the VMPerl API or CLI for monitoring (i.e., if the ESX USER parameter is set to none), then the status of the SSL flag is irrelevant. Like the ESX sever, the vCenter is also SSL-enabled by default. If you have chosen to use the vCenter for monitoring all the ESX servers in your environment, then you have to set the SSL flag to Yes. |
|
Webport |
By default, in most virtualized environments, the ESX server and vCenter listen on port 80 (if not SSL-enabled) or on port 443 (if SSL-enabled). This implies that while monitoring an SSL-enabled ESX server directly, the eG agent, by default, connects to port 443 of the ESX server to pull out metrics, and while monitoring a non-SSL-enabled ESX server, the eG agent connects to port 80. Similarly, while monitoring an ESX server via an SSL-enabled vCenter, the eG agent connects to port 443 of vCenter to pull out the metrics, and while monitoring via a non-SSL-enabled vCenter, the eG agent connects to port 80 of vCenter. Accordingly, the WEBPORT parameter is set to 80 or 443 depending upon the status of the SSL flag. In some environments however, the default ports 80 or 443 might not apply. In such a case, against the WEBPORT parameter, you can specify the exact port at which the ESX server or vCenter in your environment listens so that the eG agent communicates with that port. |
|
Virtual Center |
If the eG manager had discovered the target ESX server by connecting to vCenter, then the IP address of the vCenter server used for discovering this ESX server would be automatically displayed against the VIRTUAL CENTER parameter; similarly, the ESX USER and ESX PASSWORD text boxes will be automatically populated with the vCenter user credentials, using which ESX discovery was performed. If this ESX server has not been discovered using vCenter, but you still want to discover the guests on the ESX server via vCenter, then select the IP address of the vCenter host that you wish to use for guest discovery from the VIRTUAL CENTER list. By default, this list is populated with the IP address of all vCenter hosts that were added to the eG Enterprise system at the time of discovery. Upon selection, the ESX USERand ESX PASSWORD that were pre-configured for that vCenter server will be automatically displayed against the respective text boxes. On the other hand, if the IP address of the vCenter server of interest to you is not available in the list, then, you can add the details of the vCenter server on-the-fly, by selecting the Other option from the VIRTUAL CENTER list. This will invoke the ADD VCENTER SERVER DETAILS page. Refer to Adding the Details of a vCenter Server for VM Discovery On the other hand, if you want the eG agent to behave in the default manner -i.e., communicate with each ESX server for monitoring and VM information - then set the VIRTUAL CENTER parameter to ‘none’. |
|
DD Frequency |
Refers to the frequency with which detailed diagnosis measures are to be generated for this test. The default is 2:1. This indicates that, by default, detailed measures will be generated every second time this test runs, and also every time the test detects a problem. You can modify this frequency, if you so desire. Also, if you intend to disable the detailed diagnosis capability for this test, you can do so by specifying none against DD FREQUENCY. |
|
Detailed Diagnosis |
To make diagnosis more efficient and accurate, eG Enterprise embeds an optional detailed diagnostic capability. With this capability, the eG agents can be configured to run detailed, more elaborate tests as and when specific problems are detected. To enable the detailed diagnosis capability of this test for a particular server, choose the On option. To disable the capability, click on the Off option. The option to selectively enable/disable the detailed diagnosis capability will be available only if the following conditions are fulfilled:
|
| Measurement | Description | Measurement Unit | Interpretation |
|---|---|---|---|
|
Data received: |
Indicates the rate at which data is received by this port group mapped to this vSwitch. |
Mbps |
An increase in traffic to the server can indicate an increase in accesses to the server (from users or from other applications external to the server) or that the server is under an attack of some form. The detailed diagnosis of this measure lists the top-10 VMs in the virtual network that are receiving data at a high rate. Using this information, you can accurately identify the VM that is experiencing the most traffic. |
|
Packets received: |
Indicates the rate at which data packets were received by this port group mapped to this vSwitch. |
Packets/Sec |
An increase in traffic to the server can indicate an increase in accesses to the server (from users or from other applications external to the server) or that the server is under an attack of some form. The detailed diagnosis of this measure lists the top-10 VMs in the virtual network that are receiving packets at a high rate. Using this information, you can accurately identify the VM that is experiencing the most traffic. |
|
Data transmitted: |
Indicates the rate at which data was transmitted by this port group mapped to this vSwitch. |
Mbps |
An increase in traffic from the server can indicate an increase in accesses from the server (from users on the ESX server, or from the virtual machines on the server). The detailed diagnosis of this measure lists the top-10 VMs in the virtual network that are sending data at a high rate. Using this information, you can accurately identify the VM that is experiencing the most traffic. |
|
Packets transmitted: |
Indicates the rate at which packets were transmitted by this port group mapped to this vSwitch. |
Packets/Sec |
An increase in traffic from the server can indicate an increase in accesses from the server (from users on the ESX server, or from the virtual machines on the server). The detailed diagnosis of this measure lists the top-10 VMs in the virtual network that are sending packets at a high rate. Using this information, you can accurately identify the VM that is experiencing the most traffic. |
|
Packets dropped during transmission |
Indicates the number of outbound packets that were dropped while being transmitted from this port group mapped to this vSwitch. |
Packets/Sec |
A high value indicates network congestion, insufficient buffer capacity, or issues with the physical NIC or uplink. Dropped transmit packets degrade VM network performance and can lead to slow application response or failed outbound connections. Consistently high transmit drops usually mean the VM or host is attempting to send more traffic than the network can handle. |
|
Packets dropped during reception |
Indicates the number of inbound packets that were dropped while being received by this port group mapped to this vSwitch. |
Packets/Sec |
High receive packet drops often indicate oversubscription of the virtual switch, CPU contention on the host, insufficient receive buffers, or driver-level issues on the physical NIC. This impacts VM responsiveness because incoming data never reaches the VM, resulting in communication failures or slow application behavior. |
|
Network usage |
Indicates the percentage of the allocated network bandwidth that is currently being utilized by this port group mapped to this vSwitch. |
Mbps |
Higher usage indicates heavy network activity on the associated virtual network. If usage approaches or exceeds expected thresholds, it may indicate, Bandwidth bottlenecks, High traffic load from specific VMs, Oversubscription of the host network resources, Potential performance impact to other VMs sharing the same uplinks. Sustained high network usage should be investigated to avoid network saturation and ensure consistent VM performance. |
The detailed diagnosis of the Data received measure lists the top-10 VMs in the virtual network that are receiving data at a high rate. Using this information, you can accurately identify the VM that is experiencing the most traffic.
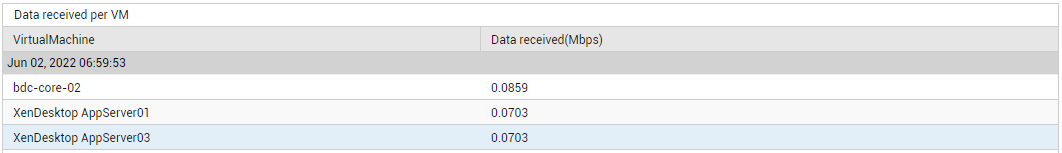
Figure 1 : The detailed diagnosis of the Data received measure
The detailed diagnosis of the Packets received measure lists the top-10 VMs in the virtual network that are receiving packets at a high rate. Using this information, you can accurately identify the VM that is experiencing the most traffic.
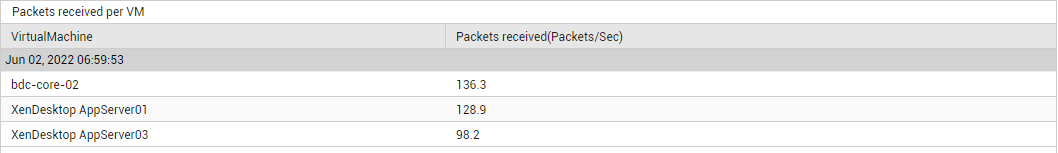
Figure 2 : The detailed diagnosis of the Packets received measure
The detailed diagnosis of the Data transmitted measure lists the top-10 VMs in the virtual network that are sending data at a high rate. Using this information, you can accurately identify the VM that is experiencing the most traffic.
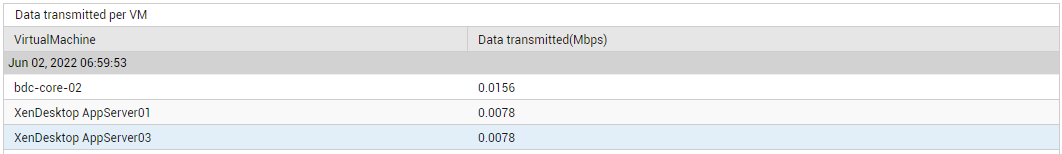
Figure 3 : The detailed diagnosis of the Data transmitted measure
The detailed diagnosis of the Packets transmitted measure lists the top-10 VMs in the virtual network that are sending packets at a high rate. Using this information, you can accurately identify the VM that is experiencing the most traffic.
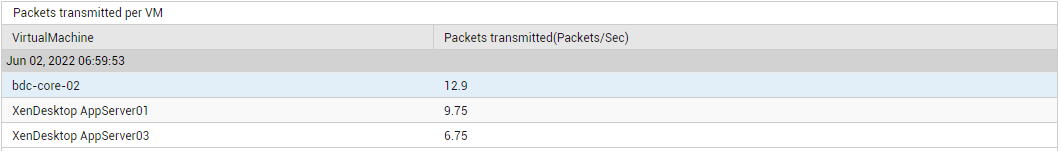
Figure 4 : The detailed diagnosis of the Packets transmitted measure