Monitoring WildFly JBoss servers
WildFly is a flexible, lightweight, managed application runtime that helps you build various applications such as Java applications, web applications, and portals, and also offers extended enterprise services such as clustering, caching, and persistence.
WildFly offers two modes: a traditional, single JVM, standalone mode, and a multi-JVM option, domain mode, which synchronizes configuration across any number of processes and hosts. The domain mode adds a central control point, the domain controller, for all of your systems, though the management capabilities of both the standalone and domain modes are the same.
Once the WildFly JBoss server is deployed in either standlaone mode or the domain mode, the eG agent periodically executes tests on the WildFly JBoss server, collects the necessary statistics, and reports them to the eG manager. These tests are mapped to specific layers of the WildFly JBoss server's layer model (see Figure 1).
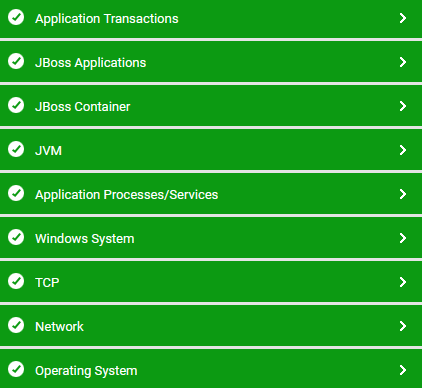
Figure 1 : The layer model of the WildFly JBoss server
Using the metrics reported, administrators can find quick and accurate answers for the following performance questions:
-
How well each connector is processing the incoming requests?
-
Are enough connections available in the connection pool of the datasources and XA-datasources, or do more connections have to be allotted to the pool?
-
Are there adequate prepared statements available? How well the prepared statements are accessed from the prepared statement cache?
-
How frequently was the servlet invoked?
-
Does the servlet take too long to execute?
-
How frequently are EJBs created/removed?
-
Are there any EJBs that are ready to service clients?
-
How many EJBs are currently in the EJB pool?
-
Are too many messages have been enqueued?
-
How quickly does the queue process messages within?
-
Does the topic take too long to process messages?
-
What type of messages are currently available in the topic - durable or non-durable?
-
How many durable subscribers are there to a topic?
-
How well each type of transaction is processed?
The Operating System, Network, TCP, Application Processes and Windows Services layers of the WildFly JBoss monitoring model is similar to that of a Windows Generic server model. Refer to the Monitoring Unix and Windows Servers document to know more about the tests pertaining to these layers. The JVM layer of this server is similar to that of the Java Application server monitoring model. Since the tests pertaining to these layers have been dealt with in the Monitoring Java Application servers document, let us now discuss only the JBoss Container Layer in the forthcoming section.