The RUM Dashboard
eG's Real User Monitor (RUM) is capable of tracking the transactions of real users to web sites/web applications, and measures the response time of each transaction in real-time. The key metrics reported by the eG RUM can be viewed using the RUM Dashboard provided by the eG Mobile App regardless of where you are. This dashboard helps you to find out overall user experience with a web site/application. In addition, this dashboard facilitates the rapid identification of web sites/web applications in your environment that do not enjoy user confidence and the probable reasons for this unfavorable user perception.
To access this dashboard, click on the Dashboards option in the Menu tab page of the eG Mobile App (see Figure 1).
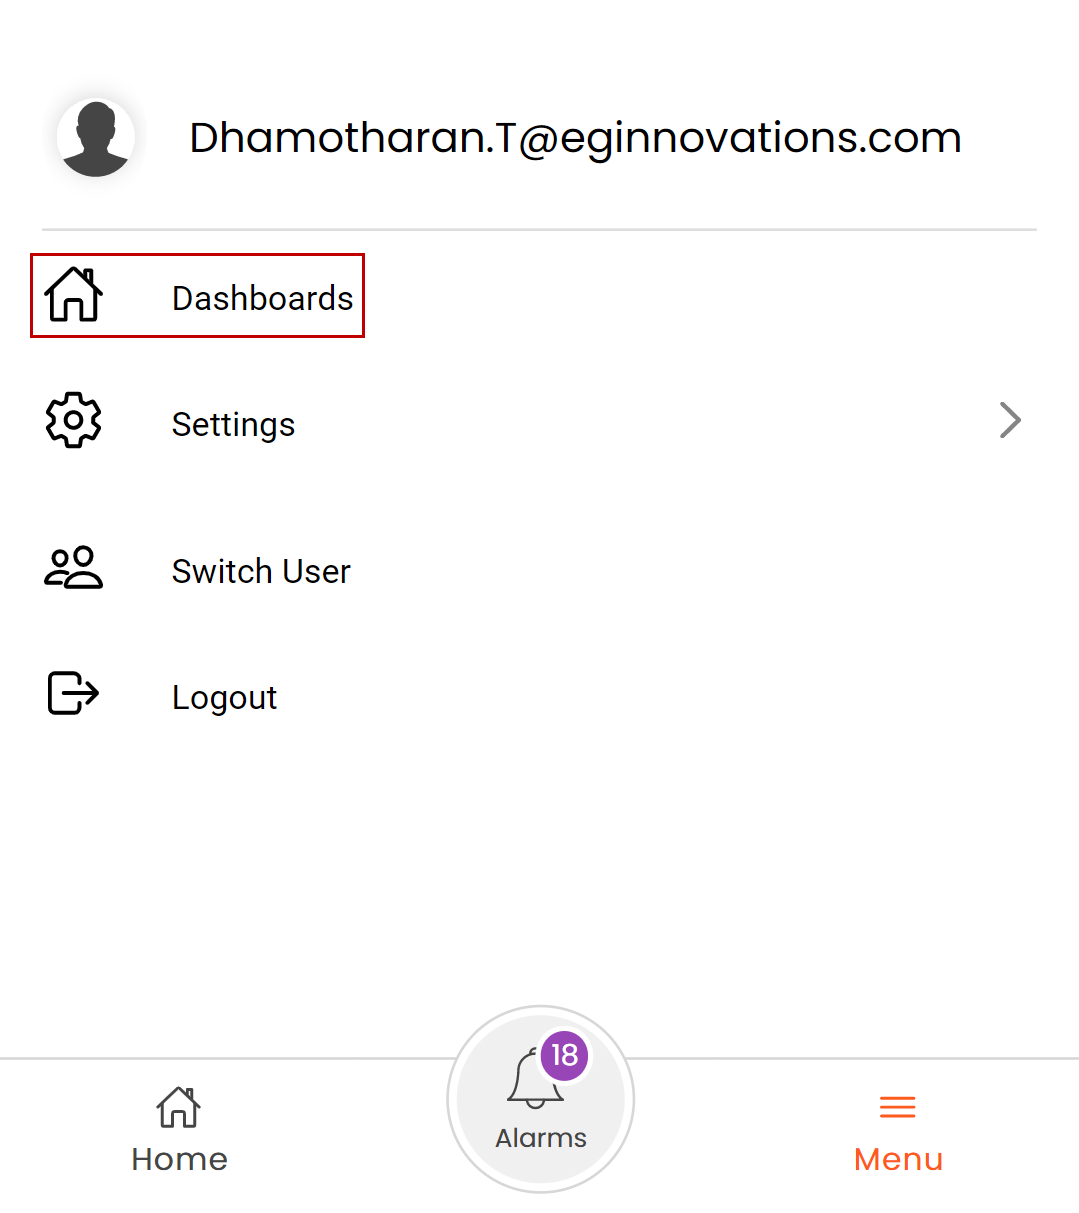
Figure 1 : Selecting Dashboards from main menu
Clicking the Dashboards option in the main menu will lead you to the Dashboards page which lists the available dashboards as shown in Figure 2
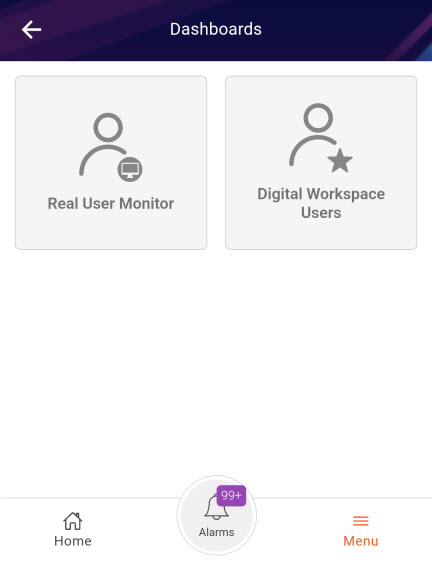
Figure 2 : The Dashboards page
Now, select the Real User Monitoring tile to view the Real User Monitoring Dashboard page that lists the available dashboards as shown in Figure 3.
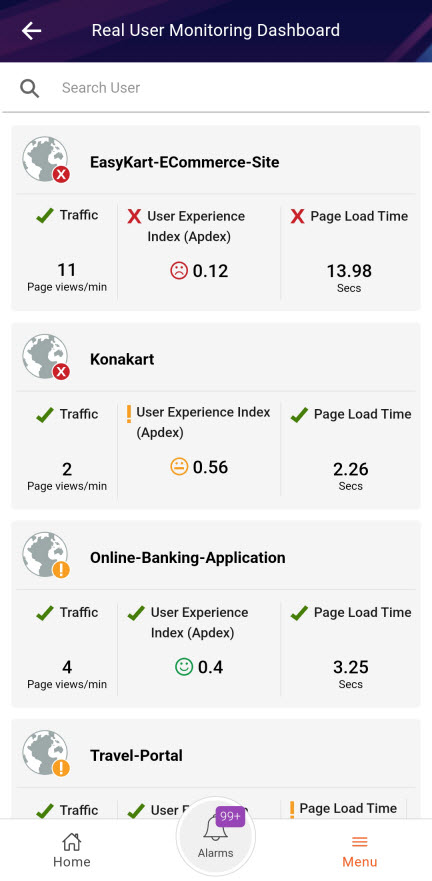
Figure 3 : The Real User Monitoring Dashboard
This helps you understand, from just a glance, the following:
- How is the traffic to the managed web sites/web applications in your environment? Is the traffic to any web site/web application suspiciously high or low?
- From which devices is this traffic coming from – desktops? Mobile phones? Or tablets? Which is the most popular device
- Is the user experience with any managed web service poor presently? If so, what is causing service quality to degrade – delay in page loading? Or JavaScript errors?
-
How many distinct users are currently connected to each web site / web application being monitored? - this is a good indicator of the number of users who are truly contributing to the traffic on the web site.
Click on the dashboard of your choice to review and analyze different facets of real user experience with the chosen web site/application. By default, the Overview option is selected. As a result, Figure 4 appears by default, which provides an overview of the user experience with the target application. Using the Response TIme Breakup section in Figure 4, you can see, at-a-glance, the response time per device type (such as desktop and tablet). This application-level response time analysis provides insights across all pages in the application.
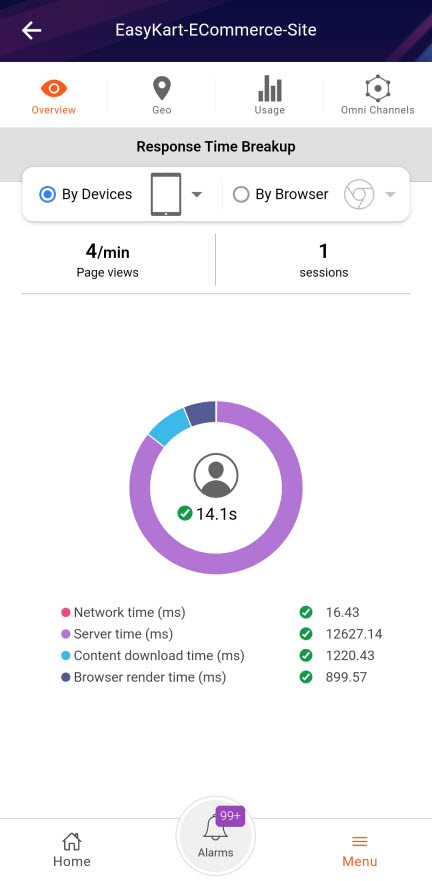
Figure 4 : The Overview page of the Real User Monitoring Dashboard
You can use the drop-down list provided adjacent to the By Devices option icon to choose the device type of your interest. For instance, click on the drop-down list to know where desktop users are experiencing a bottleneck (Figure 5).
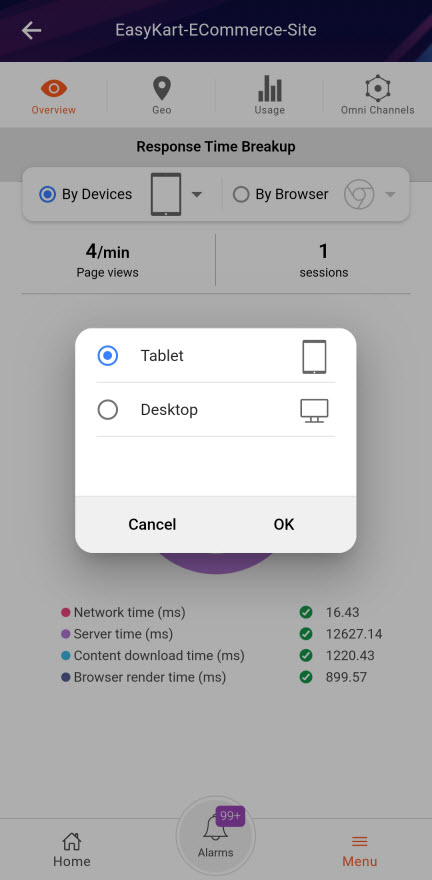
Figure 5 : Selecting the device type
Likewise, you can view the response time and user experience with a specific browser using the drop-down provided adjacent to the By Browser option.
For a more detailed analysis of response time and user experience with the applications, click on the User icon provided at the center of the Response Time Breakup dough-nut chart. This will invoke Figure 6.
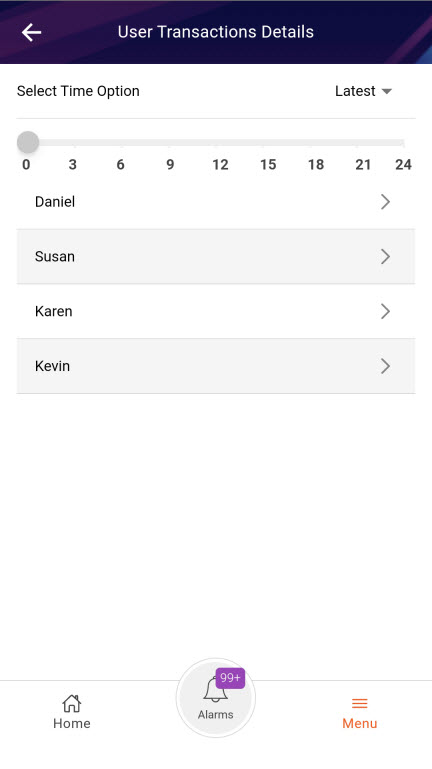
Figure 6 : The user transaction details
To zoom into experience of a particular user in the dashboard, simply click on his/her name in the dashboard of Figure 6. The details will be displayed as shown in Figure 7. The details include user experience, the URL and type of the page that the user accessed , the time stamp at which the request was made and the time taken for loading the requested page.
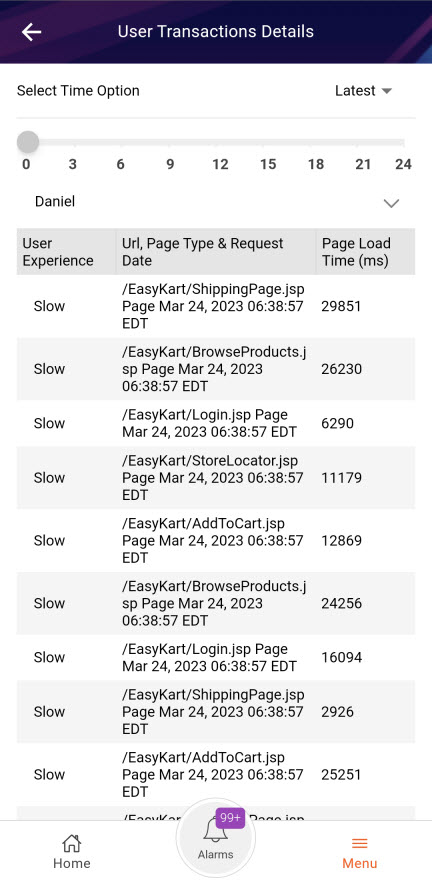
Figure 7 : Transaction details of a user
To analyze user experience geographically, click on the Geo icon in the array of icons (see Figure 1) in the top panel of the dashboard. Figure 8 will then appear.
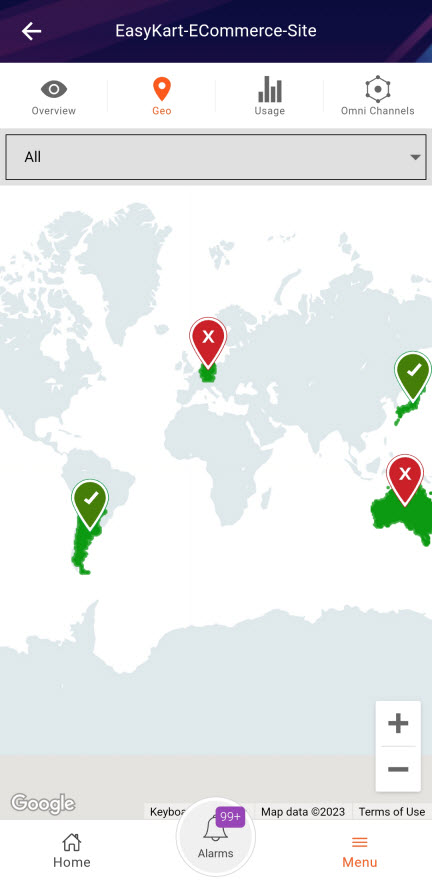
Figure 8 : User experience analysis across geographies
Without requiring you to pour over tens of metrics, the Geo Map in Figure 8 quickly tells you where your users are. Location markers accurately pinpoint the countries from which the requests are flowing into the web site / web application. The size of the location marker varies according to the number of requests from each country- i.e., larger the marker, higher will be the number of page view requests from that country. Also, to indicate the experience of users from a country, both that country and its corresponding marker are colored using conventional color-codes. This way, the map intelligently differentiates between the “happy” countries and the “unhappy” ones.
To know why users from certain countries are 'unhappy' with the web site / web application, click on the problem country in the map. A box depicted by Figure 7 will appear revealing what the users from that country experience when interacting with the target web site/web application. The page views from the country, the average page load time, and the error percentage are displayed in the box. From this, you can easily infer what is ailing the experience of users from that country – slow page loading? or JavaScript errors?
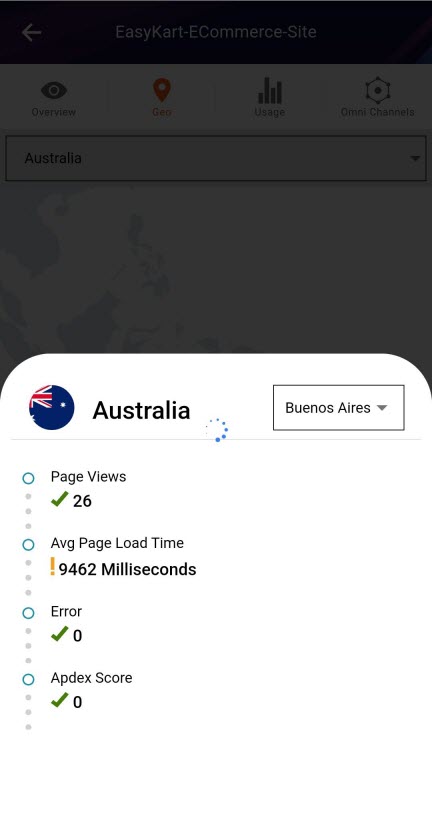
Figure 9 : Viewing the user experience statistics of a particular country in the geo map
If users from a country are experiencing slowness, it is only natural that you want to figure out whether the problem is widespread or is confined to a specific region within that country. This can be easily determined by zooming into a problem country in the map! For this, just select the country you want to focus on from the drop-down list in the geo map. Figure 10 will then appear revealing the exact regions (in that country) from which requests are received and the overall experience of the users from each region.
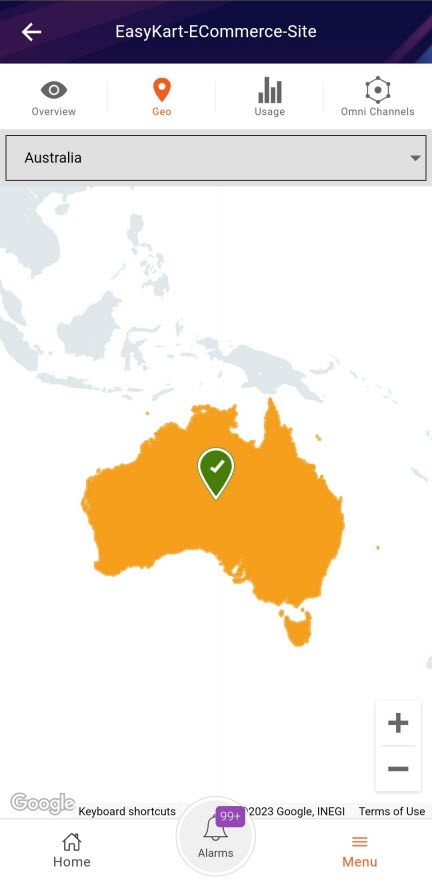
Figure 10 : Zooming into the regions within a country
Likewise, you can quickly drill-down from a region to view the cities in that region and the quality of their experience with the web site / web application.
To cross-correlate across usage analytics related to the target application and to study usage trends, click on the Usage icon in the array of icons in the top panel of the dashboard. Figure 11 will then appear.

For detailed analysis of response times across devices, click on the Omni Channels icon in the array of icons in the top panel of the dashboard. Figure 12 will then appear.
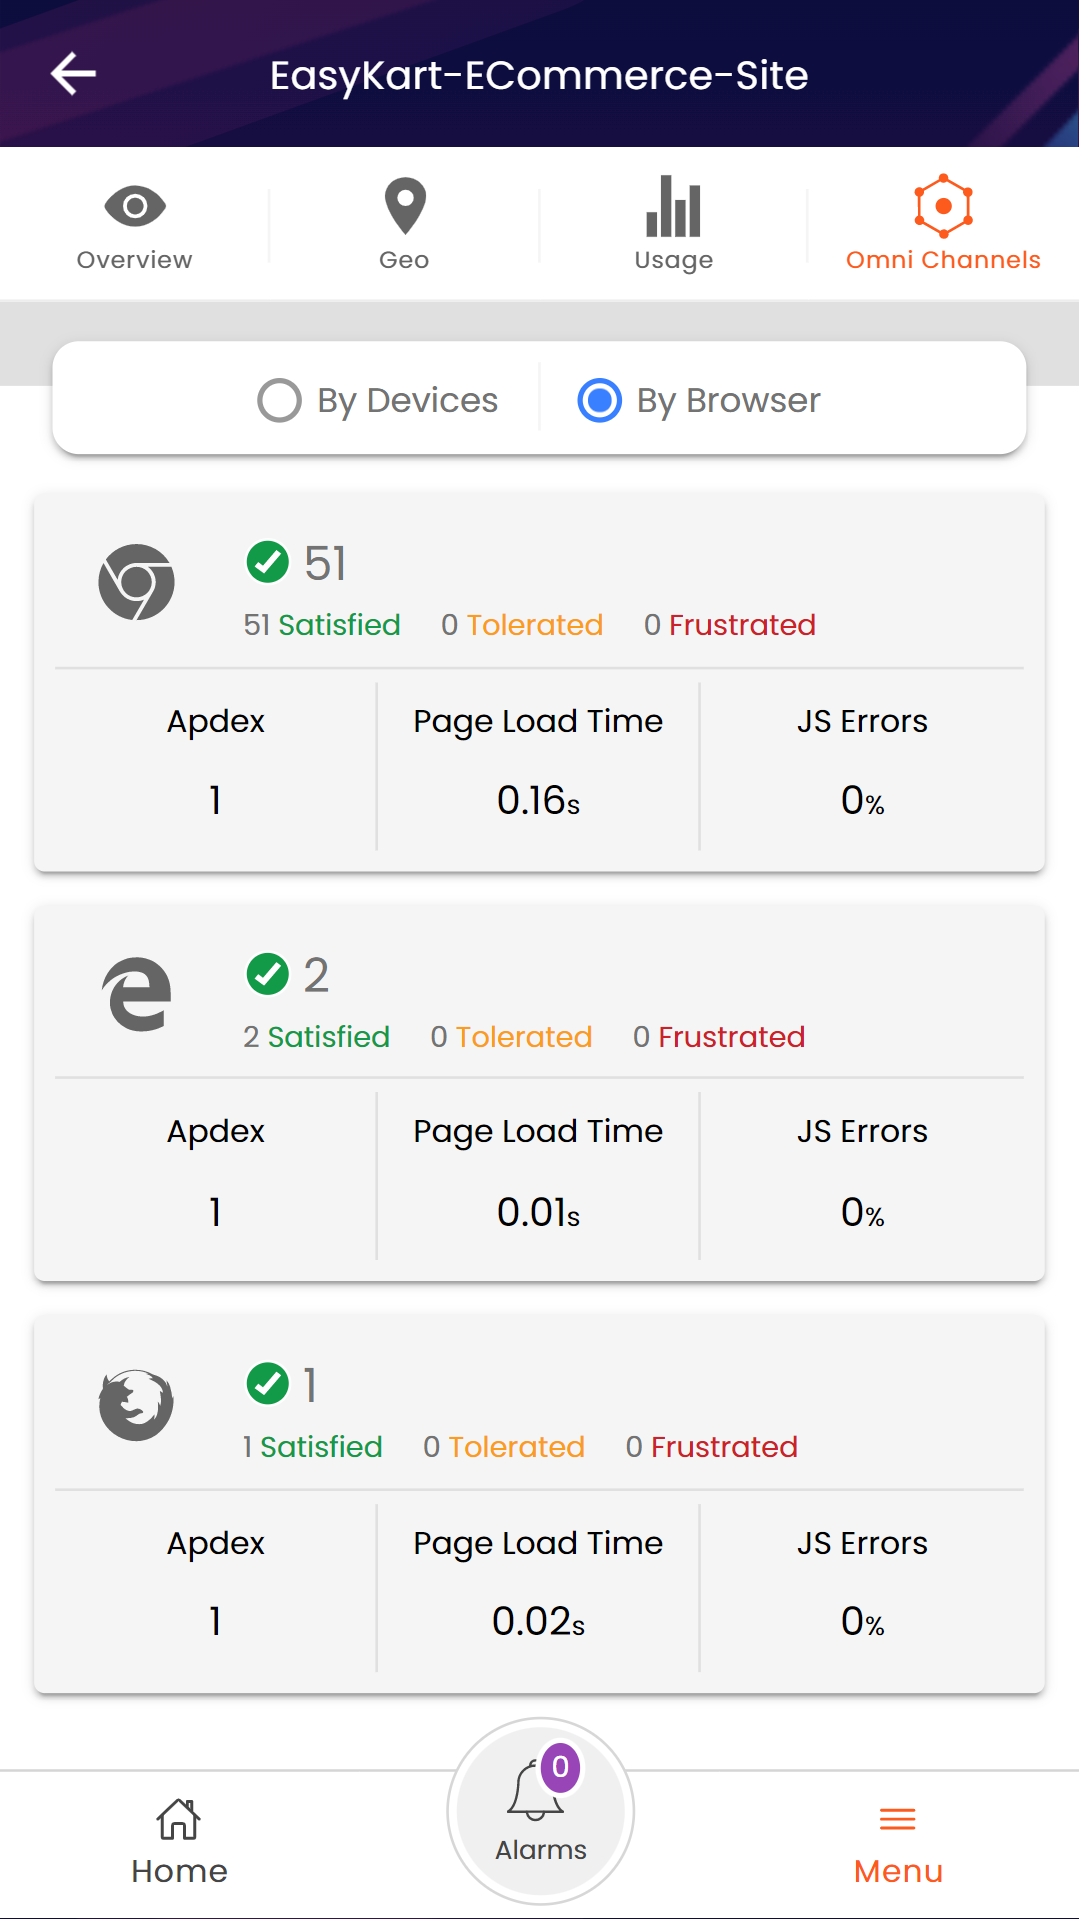
Figure 12 : User experience analysis by channels
For more details on the statostics evelatd by the RUM Dashboard, refer