Importance of Proactive Alerting
When evaluating a monitoring product, it is essential you fully understand its alerting capabilities. Alerting is a responsive action triggered by a change in conditions within the system being monitored. Typically, an alert can be defined by a condition to trigger the alert and an action defining what that alert should do when the trigger condition occurs. If your monitoring tools are intended to ensure high availability and performance, rather than retrospective passive analysis of metrics – you need very good proactive alerting.
IT managers often complain about two main types of problems with monitoring and management tools, and they are both fundamentally associated with weak and inadequate alerting features:
- Firstly, after they install the software, they start to receive many “false” alerts. A false alert refers to a situation in which the monitoring tool indicates a problem, but the IT manager determines that there is no real problem in the network. Thousands of alerts can result in distracting IT administrators, preventing them from focusing on the genuine issues that can impact IT service quality or working on more interesting strategic projects. This is commonly referred to as ‘noise’. Alert storms are at the extreme of this spectrum.
- Secondly, to avoid false alerts, IT managers must define threshold values for the different metrics collected by the monitoring tool. A threshold is a limit set in the monitoring tool for the metric, so that if a metric crosses this value, an alert is raised. In a large enterprise, a monitoring tool that provides visibility into the different network, server, and application tiers can collect millions of metrics. Having to set thresholds manually for every single metric is a very time-consuming, monotonous exercise. As a result, many enterprises end up spending a lot of time and money having consultants calculate, assess, and tune thresholds manually or have to invest in bespoke scripting to attempt to automate parts of this tedium.
Modern Alerting Technologies
Modern monitoring platforms such as eG Enterprise simply don’t have these issues as they provide out-of-the-box alerting coupled with sophisticated machine learning AIOps engines. This functionality can calculate both static and dynamic thresholds and correlate events with alerts to minimize noise, avoiding secondary symptomatic (rather than root-cause alerts) and event storms.
Modern alerting technologies now automatically deploy and auto-scale with dynamic infrastructures and IaC (Infrastructure-as-Code) workflows and process, check and adjust thousands or even millions of metric thresholds. Crude static fixed threshold values and percentages have been replaced by systems that understand the hour-by-hour, day-of-the-week, monthly, and seasonal usage variations of systems to enable anomaly detection without problematic alert storms and false positives.
With newer workspace technologies such as Amazon WorkSpaces and Azure Monitor for AVD leveraging both static and AI-driven dynamic thresholds, awareness has increased of modern alerting functionality that avoids unscalable manual configuration. Many of the customer RFIs and PoCs which evaluate eG Enterprise, now specifically and explicitly assess and score thresholding and alerting capabilities. We are increasingly seeing requests for architectural details of alerting capabilities and are pleased to release a new whitepaper to satisfy this need.

Understanding Metric Thresholds and Alerting Features
In this new white paper, we cover the architectural qualities associated with eG Enterprise’s thresholding methodologies to automate and optimize thresholding and alerting. This white paper will enable readers to evaluate and compare the thresholding capabilities of monitoring solutions for a range of use cases including APM (Application Performance Monitoring), BTM (Business Transaction Monitoring), Digital Workspace monitoring (Citrix / VMware) and Cloud Monitoring (Azure Monitor, Amazon CloudWatch). The capabilities discussed will cover:
- When to choose static vs. dynamic thresholds
- How to combine static and dynamic thresholds
- How machine learning technologies within AIOps engines have become standard to calculate and set alerting thresholds automatically for large-scale auto-scaled infrastructure
- Threshold priorities and multi-level alerting – automatically escalating the priority of alerts as metrics change, rather than triggering additional alerts
- Threshold sensitivities – how thresholds can be set to be 20% of a value or even 20% of normal usage for that metric at a particular time of day
- Threshold duration considerations – how to ensure the time duration of events is included in alerting criteria e.g., a CPU spike of 100% for 2 seconds could be ignored unless the problem continues but the failure of a hard-disk should be reported instantaneously
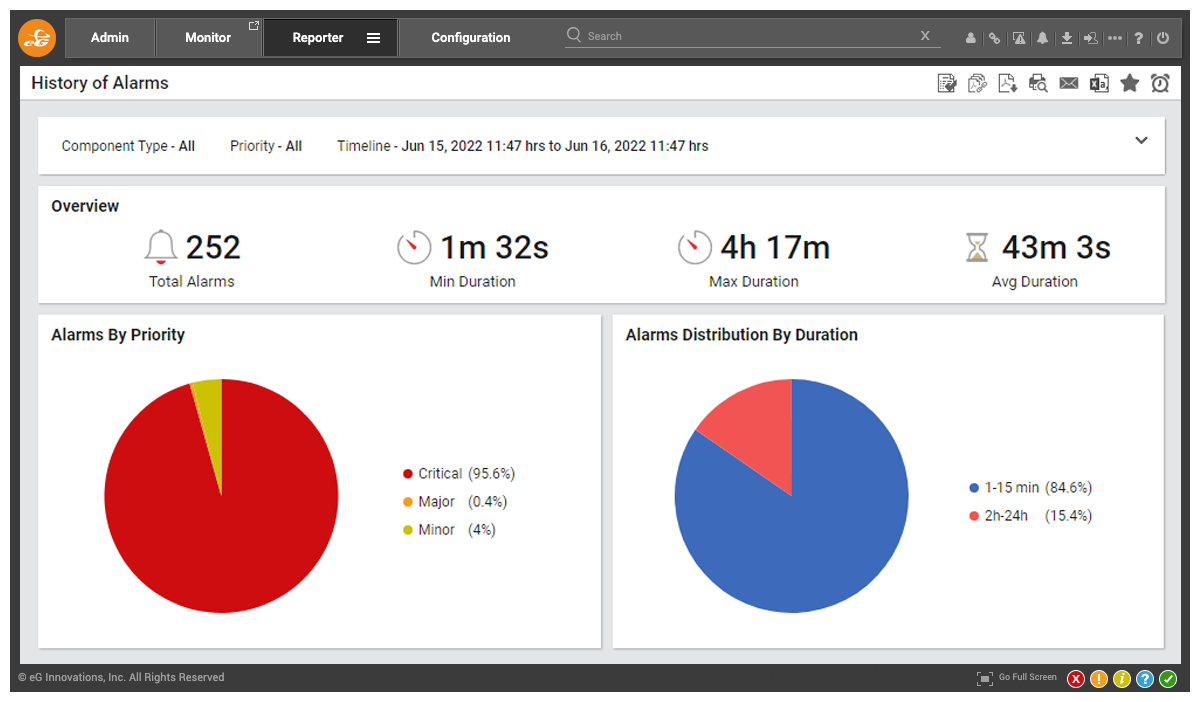
- Leveraging reports on alerting to set KPIs and identify optimizations and continual improvements
- How to configure alerting to handle planned maintenance
- Integrating alerts into ITSM help and service desk systems such as ServiceNow and Autotask

White paper – Understanding How Combining Static and Dynamic Thresholds Avoid False Alarms
The white paper guides readers through complex examples of thresholds best practice. For example – how to avoid false alarms around Citrix user sessions. A performance graph showing the number of user sessions and the auto-computed, dynamic-static thresholds used for alerting.
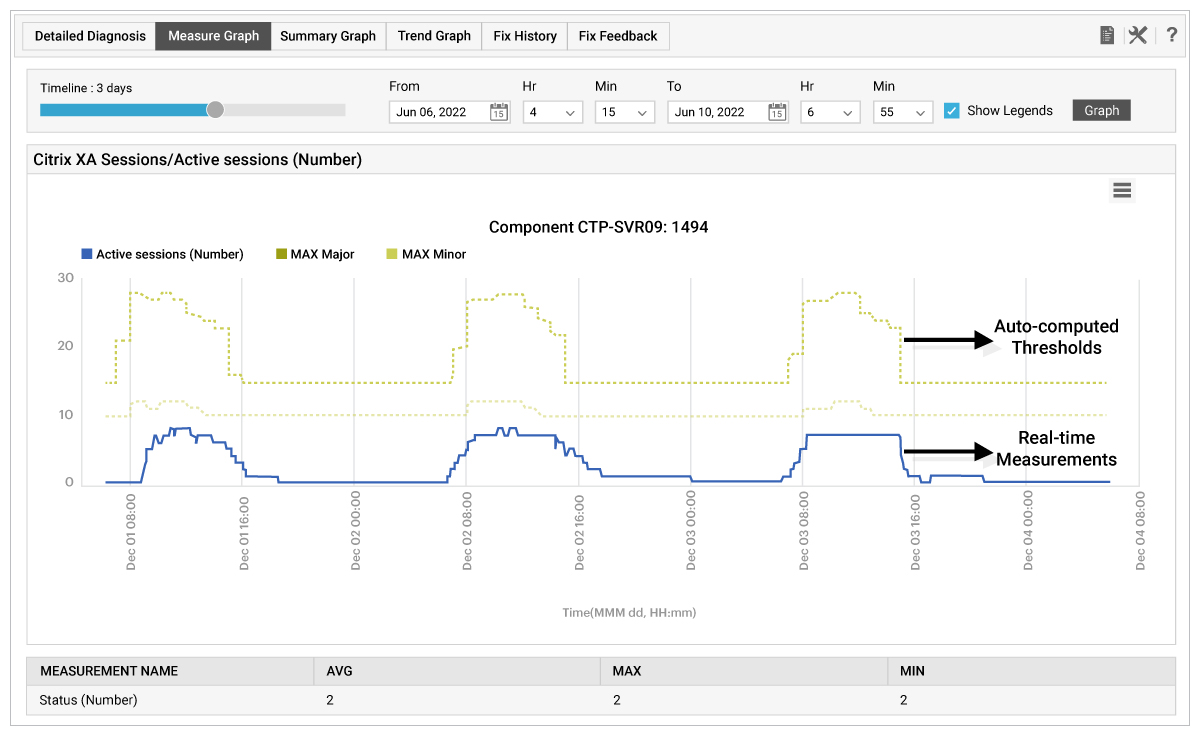
An auto-static combination threshold is applied to this metric. In the morning hours, a static threshold is applied because the dynamic threshold is lower. The static value ensures that alerts are not generated as long as the number of sessions stays below 10. During the day (8am onwards), the automatic threshold takes over. The blue line in the figure denotes the metric’s value over time. The yellow lines represent the upper threshold values. Notice that from 4pm to 8am, the threshold is static – with the minor value at 10 sessions and the major value at 15 sessions. Since the automatically computed value is less than both thresholds, the statically set threshold values apply in this case. As in the case with the maximum thresholds, if a static minimum and an automatic minimum threshold are specified, then eG Enterprise will generate alarms only when the current value falls below the lower of the two threshold settings.
After reading our white paper you should be left in a position to understand all common thresholding methodologies, algorithms and features available from modern monitoring platforms. Enjoy!
eG Enterprise is an Observability solution for Modern IT. Monitor digital workspaces,
web applications, SaaS services, cloud and containers from a single pane of glass.
Further Information:
- To learn about how to understand, evaluate and leverage AIOps features, see AIOps Solutions and Strategies for IT Management | eG Innovations
- eG Enterprise can be deployed on-premises, in a cloud of your choice or via ready-to-go SaaS (Software as a Service), for those looking to explore the benefits of static and dynamic thresholds and combine them a free trial on our SaaS option may be the best choice: How to Deploy eG Enterprise – Choices and Models | eG Innovations
- Static or Dynamic Thresholds? Which is best and when? See: Static vs Dynamic Alert Thresholds for Monitoring | eG Innovations
- TechTarget has several articles on the benefits of static vs dynamic alerts, including: Monitoring thresholds determine IT performance alerts (techtarget.com) and How AIOps monitoring eases modern IT challenges (techtarget.com)
- Read about integrating alerts with help and service desk tools such as Slack, ServiceNow, Autotask, JIRA, and others: Service and Help Desk Automation Strategies
- We have a series of short (2-3 min) videos covering the eG Enterprise interface including many aspects of alerting and thresholding, including: How to Review and Interpret Alarms, Understanding and Modifying Thresholds, Understanding and Modifying Alarm Policies, and Creating Group Thresholds
 Barry is a pre-sales consultant at eG Innovations. Barry has 20+ years of IT experience and deep knowledge in Citrix technologies and is a specialist on Microsoft Windows, Desktop and Server virtualization and application delivery with Citrix ADC. Barry is an active community contributor and former Citrix Technology Professional. He is one of the co founders and a member of the board of the Dutch Citrix User.