


AWS Cloud Services Adoption
Among the 200+ fully features services that Amazon Web Services (AWS) offers, Elastic Compute Cloud (EC2) is the most popular. In the recent eG Innovations and DevOps Institute survey of 900+ IT professionals, cloud instances were the most commonly used cloud service, with 63% usage among respondents. This statistic is not a surprise because most organizations start their cloud journey with a lift and shift migration model that involves taking their on-premises applications and deploying them on cloud instances.

EC2 is a good starting point for IT teams to replicate their on-premises server instances and over time upgrade the application’s execution environment to a cloud-native centric model.
What is AWS EC2?

Amazon Elastic Compute Cloud (Amazon EC2) is a web service that provides secure, resizable and virtualized compute capacity in the cloud. Amazon EC2’s simple web service interface allows you to obtain and configure capacity quickly and with minimum effort.
EC2 provides a set of predefined instance profiles, or virtual server definitions, to create virtual machines. You can choose your VM configurations from any of the predefined instance types. VM instances can be memory-optimized, compute-optimized, or storage-optimized.
You can choose a variety of standard and custom templates to launch EC2 instances. Each of these templates, called Amazon Machine Image (AMI), is a virtual machine image with an installed operating system and a filesystem. You can choose which operating system you want your instance to run by specifying the AMI that EC2 will use to create the instance.
Why is My AWS EC2 Instance Slow?
When you install applications on EC2 instances, you might encounter situations where your AWS EC2 instance is slow. Troubleshooting such problems can be challenging. In this blog, we will discuss some of the main reasons why your EC2 instance can be slow and how you can troubleshoot this easily.
One of the first things to do when you notice slowness with your AWS EC2 instance is to check AWS CloudWatch, the monitoring and management service that provides data and insights about AWS resources you are using. AWS CloudWatch provides a number of basic metrics about each EC2 instance.
CloudWatch metrics for each EC2 instance include:
| Type of Metric | Names of Metric |
| Instance Metrics | CPUUtilization, DiskReadOps, DiskWriteOps, DiskReadBytes, DiskWriteBytes, MetadataNoToken, NetworkIn, NetworkOut, NetworkPacketsIn, NetworkPacketsOut |
| CPU Credit Metrics | CPUCreditUsage, CPUCreditBalance, CPUSurplusCreditBalance, CPUSurplusCreditsCharged, |
| Dedicated Host Metrics | DedicatedHostCPUUtilization |
| Amazon EBS Metrics | EBSReadOps, EBSWriteOps, EBSReadBytes, EBSWriteBytes, EBSIOBalance%, EBSByteBalance% |
| Status Check Metrics | StatusCheckFailed, StatusCheckFailed_Instance, StatusCheckFailed_System |
Limitations of AWS CloudWatch
Focusing on the instance metrics in the above table, notice that there are many limitations with the metrics AWS CloudWatch provides:
- Lack of memory visibility: While CPU, network and disk resource usage is tracked, AWS CloudWatch does not provide system-level memory metrics for EC2 instances.
- Lacks CPU usage of underlying hardware: Remember, we mentioned EC2 provides virtualized processing capacity? CloudWatch gives you the CPU of that virtualized instance. These are called “compute units” in AWS lingo. CloudWatch does not report CPU usage of the underlying hardware that the instance is being hosted on.
- Lacks additional detail: While these basic metrics can tell you if CPU or disk is heavily used, you do not have additional details you need for troubleshooting: is it due to many application instances running, or is it one application that is causing the heavy usage?
-
Detailed monitoring can inflate your AWS bill: CloudWatch provides two categories of monitoring: basic monitoring and detailed monitoring. Most AWS services publish metrics at five-minute intervals. You can enable detailed monitoring to increase the frequency to one minute, at additional cost.
Note that with detailed monitoring:
- You will be charged per metric and how frequently you call the API. The more metrics you send to CloudWatch and the higher the frequency of API invocation, the higher your bill.
- You will be charged for all of the metrics that were previously included as part of basic monitoring.
Custom Metrics can get Costly!
Amazon provides pricing examples at https://aws.amazon.com/cloudwatch/pricing/. Here’s an example of EC2 detailed monitoring.
Assuming your application runs on 100 Amazon EC2 instances 24×7 for a 30-day month, and you enable EC2 Detailed Monitoring on all instances, your charges would be as follows.
Number of Amazon EC2 instances: 100
Custom metrics: 10
Time period: 30 days running 24×7
The total number of metrics would be 10 per instance ✕ 100 instances = 1,000 metrics.
Amazon charges $0.30 per custom metric for the first 10,000 custom metrics. 1,000 ✕ $0.30 = $300
There are additional costs per dashboard. Amazon charges $3.00 per dashboard per month. If you set up 10 CloudWatch dashboards, that’s 10 ✕ $3.00 = $30 per month
Charges for API requests would be calculated as follows:
- Number of minutes = 30 days * 24 hours * 60 minutes = 43,200 minutes
- Assuming API calls are made every 5 minutes, the total number of requests per instance = 43,200/5 = 8640 requests
- Total number of API requests = 100 instances * 8640 requests per instance = 8,64,000 requests
- First 1,000,000 API requests = $0
- 1,000,001 to 8,64,000 requests = 8,64,000/1,000 * $0.01 = $8.64
Your total monthly CloudWatch charges for the above infrastructure would be a minimum of $300 + $30 + $8.64 = $338.64
- Additional hoops to jump to aggregate: You can view CloudWatch metrics for EC2 instances within:
- a single AWS account at a time, and…
- a single region at a time.
In order to view CloudWatch data from multiple AWS accounts and regions into one dashboard, you would have to manually create cross-account and cross-region dashboards. This is especially important if you are an MSP hosting multiple tenants.
Deploying Monitoring Agents on EC2 Instances
To get these additional details, you need to consider deploying a CloudWatch agent inside the VM or deploying other monitoring agents.
Agents deployed on EC2 instances provide additional details you need for troubleshooting.
- You can determine from the metrics provided by these agents if you are bottlenecked on CPU resources and why – i.e., which application(s) is responsible for this?
- If there is a memory bottleneck, which application is taking resources?
- Disk bottlenecks can also be identified this way and you can even determine which file is being read/written to the most.
- Slowness can arise from other factors also. A faulty network driver can cause excessive packet re-transmissions, slowing down application access. Applications that do not release operating system resources like file objects, sockets, etc. can cause havoc. They can make the operating system slower and slower over time, to a point where the system becomes unresponsive.
A full list of additional KPIs that can be monitored using agents on VMs or EC2 instances is indicated in our earlier blog.
If the slowness is caused within your EC2 instance, agents on the OS instances can help. But what if the issue is not being caused within the OS instance? These are the types of issues that do not occur commonly in on-premises environments, but which can happen in the cloud. These types of issues are the most difficult to detect and troubleshoot.
Review AWS Credit Metrics for EC2 and EBS

When deploying AWS EC2 instances, there are several different instance types you can choose from – see https://aws.amazon.com/ec2/instance-types/. While many Amazon EC2 instance types provide fixed CPU resources, there are burstable performance instances which are becoming very popular as they are more cost effective. The burstable instances provide a baseline level of CPU utilization with the ability to burst CPU utilization above the baseline level. The baseline level might be 20%, 40%, or so on, depending on the instance type. A burstable instance earns credit when it stays below the CPU baseline, and spends credits when it bursts above the baseline.
If you are using a burstable instance, it is important that you track the CPU credit balance of an instance. If the credit balance drops to 0 and your applications need additional CPU, the EC2 instance can become very slow until such time that the CPU credit for a period increases above 0 and you get your credits back. An agent deployed on an EC2 instance cannot monitor CPU credits for the instance. You need to have integration with AWS CloudWatch to track this metric for all your EC2 instances.
Slowness in an EC2 instance may also occur because of depleted I/O burst credits on EBS volumes of type gp2. (In most AWS Regions, gp2 is the default storage drive for root volumes. For more information, see Amazon EBS volume types). A burst balance of 0% implies that all the burst credits have been used up and the volume can’t burst above its baseline performance level.
It is essential to monitor CPU credits and I/O burst balance of EC2 instances and their EBS volumes, in order to determine if AWS instance type selection or configuration is limiting the performance of the instance.
Why is my EC2 instance slow, unresponsive, or inaccessible, but my CPU and memory consumption aren’t high? See: Troubleshoot slow EC2 instances with gp2 root volumes (amazon.com)
Recommendations for Improving AWS EC2 Performance
- If you must use burstable EC2 instances, consider setting the unlimited mode for these instances. See https://docs.aws.amazon.com/AWSEC2/latest/UserGuide/burstable-performance-instances-unlimited-mode.html for details. A burstable instance with unlimited CPU configuration can handle high CPU utilization for any period of time. The instance price remains at the baseline price as long as CPU usage is below the baseline level and it increases automatically to cover the times when CPU spikes. This will avoid system freezes and slow responses that you might see when an AWS EC2 instance has limited CPU mode set.
- For gp2 EBS volumes, you may need to increase the size of the volume to get more IOPS (the baseline IOPS is 3 IOPS per GB of volume size). Alternatively, you can choose volumes with provisioned IOPS without increasing the volume size.
Complete Monitoring of AWS EC2 Instances with eG Enterprise
The eG Enterprise solution offers complete visibility into all aspects of EC2 performance:
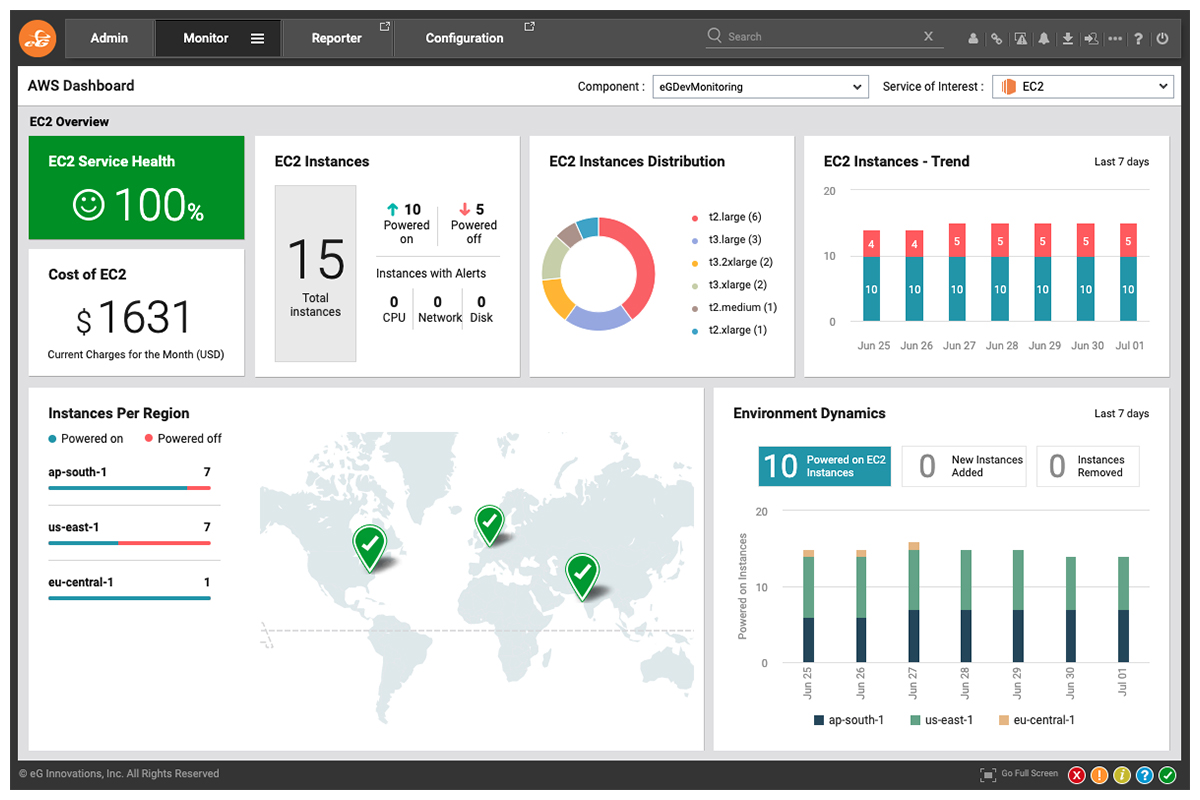
- Through tight integration with AWS CloudWatch APIs, eG Enterprise tracks all the key metrics relating to EC2 and EBS performance. Proactive alerts are generated when CPU credit balance or I/O burst balance has become very low. For more details, on eG Enterprise’s integration with AWS CloudWatch, see https://www.eginnovations.com/supported-technologies/aws-monitoring
- Agents deployed on EC2 instances track all the key server and OS parameters. For complete details on system monitoring with eG Enterprise, see https://www.eginnovations.com/supported-technologies/server-monitoring
Test drive eG Enterprise today. Sign up at https://www.eginnovations.com/product/application-performance-monitoring/free-trial
eG Enterprise is an Observability solution for Modern IT. Monitor digital workspaces,
web applications, SaaS services, cloud and containers from a single pane of glass.
Related Information
- Monitoring AWS EC2 Cloud Instances | eG Innovations
- Read about eG Enterprise turnkey SaaS solutions on the AWS Marketplace: AWS Marketplace: eG Enterprise Express Cloud (amazon.com)
- Understand System Monitoring with AWS CloudWatch – Pros and Cons (eginnovations.com)
- AWS Performance Monitoring with eG Enterprise – An overview of key capabilities and features
- Read about Synthetic Monitoring and Testing for Amazon WorkSpaces: Synthetic Monitoring of Amazon Workspaces | eG Innovations
- Read how Israel’s largest supermarket chain leverages an eG Enterprise integration with CloudWatch to manage large and complex auto-scaling deployments: Cloud Issues & Problems – Management Case Study | eG Innovations
- A real-life deep-dive post-mortem case study – debugging slow performance on AWS public cloud burstable instances on EC2, see: AWS EC2 Monitoring Tools | eG Innovations
- More on how eG Enterprise leverages AIOps technologies for event correlation, anomaly detection and root-cause diagnostic analysis: AIOps Tools – 8 Proactive Monitoring Tips
- Cloud Migration Strategy: A Framework for Cloud Adoption and Target Cloud Models – Define your Pathway to Cloud Migration
 Karthik Ganesan is a Systems Manager at eG Innovations, he has worked out of our R&D office in Chennai for over 10 years. Karthik started his career as a hands-on network engineer and has particular empathy for those involved in frontline customer support.
