Troubleshooting the Failure of the eG .NET Profiler to Profile and Measure Performance of .NET Transactions
This section discusses what to do to
-
What are the very basic checks that need to be done when .NET BTM test for a website (say, SampleWebsite) is not reporting any metrics?
- IP / Port cross-check – The IP and Port number of the “SampleWebsite” needs to be cross-checked while adding a component.
- Website Name in Test Config – The website name “SampleWebsite” (Case sensitive - as in the IIS server) needs to be specified in test configuration page of “.NET Business Transactions” Test.
- Successful execution of SetupDotNetProfiler.bat – Check if a “Setup Aborted” error message appeared when the SetupDotnetProfiler.bat was executed.
- IISRESET – Check if the IISRESET command was run after successful execution of batch file.
- Initiate requests for website – Ensure that the user hits the URL of the SampleWebsite.
- Enable IIS Management Scripting & Tools – Enable IIS Management scripts and tools from the Microsoft Windows features.
- Application type: .NET-based web sites / web applications operating on an IIS web server and .NET applications that runs as Windows services can be BTM-enabled. Similarly, .NET Core applications on IIS/Kestrel web servers, and those that run as Windows services, can also be BTM-enabled. Check the type of application that is to be monitored and BTM-enable it accordingly.
-
Check for the existence of other Profiling tools – For this, follow the checks discussed in response to question 2 of the Frequently Asked Questions (FAQ) topic. If these checks reveal that some other profiler pre-exists, you will have to do the following:
-
If the Windows Registry check reveals that a profiler from a different vendor is operating on the host and not the eG .NET Profiler, then you will have to first delete both the COR_PROFILER and COR_ENABLE_PROFILING variables, then restart the system, and then run the IISRESET command from the prompt to make sure the changes take effect. Later, you should proceed to install the eG .NET Profiler.
-
If the Event Log check reveals that the eG .NET Profiler has not been installed properly on the system, then retry installing the profiler.
-
-
How to verify that the eG .NET BTM has been successfully installed?
You can check the System Environment Variables and Event Logs to verify whether/not the eG .NET pofiler has been installed on a server.
Checking System Environment Variables
- Login to the system hosting the eG .NET BTM.
-
Open Windows Explorer and go to the Computer or My Computer node therein, depending upon the version of Windows in use. In some Windows versions, you can even type This PC in Search.
-
Right-click on the relevant node and select Properties.
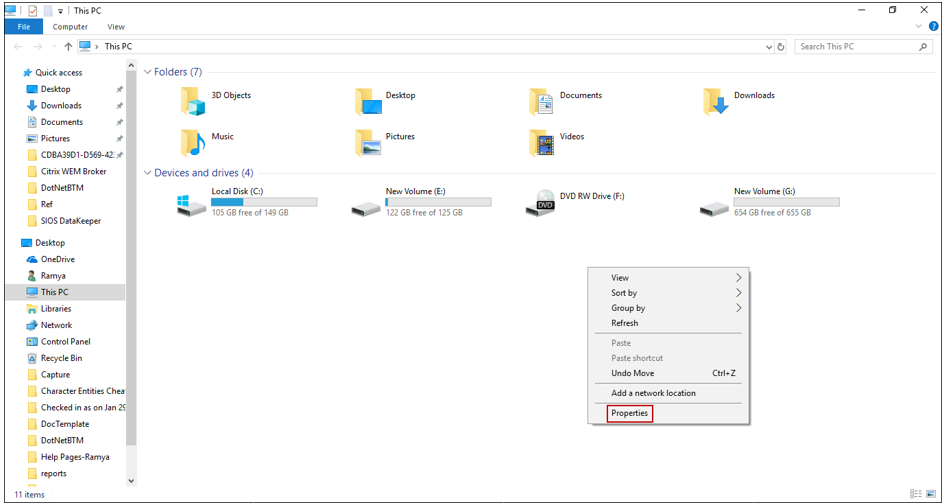
Figure 1 : Selecting Properties option from shortcut menu
-
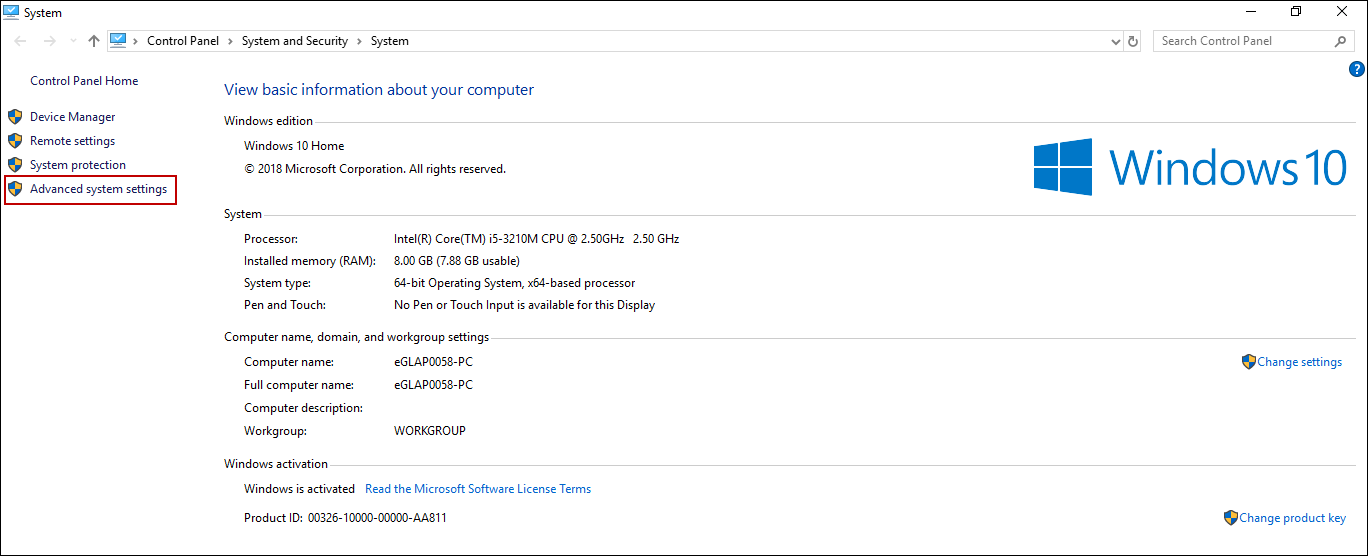
Figure 2 will appear. Click on Advanced Settings in Figure 2.
-
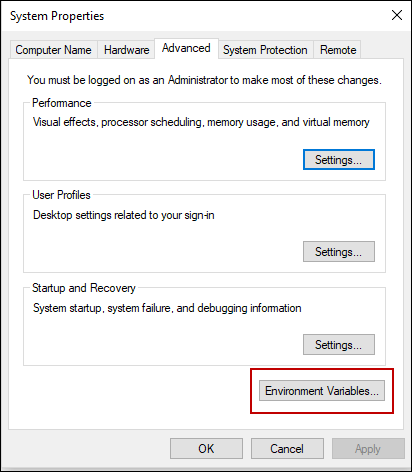
Then, Figure 3 appears. Under Advanced tab, click on the Environment Variables button.
-
In the list of Environment Variables that then appears, look for the COR_PROFILER and COR_ENABLE_PROFILING variables.
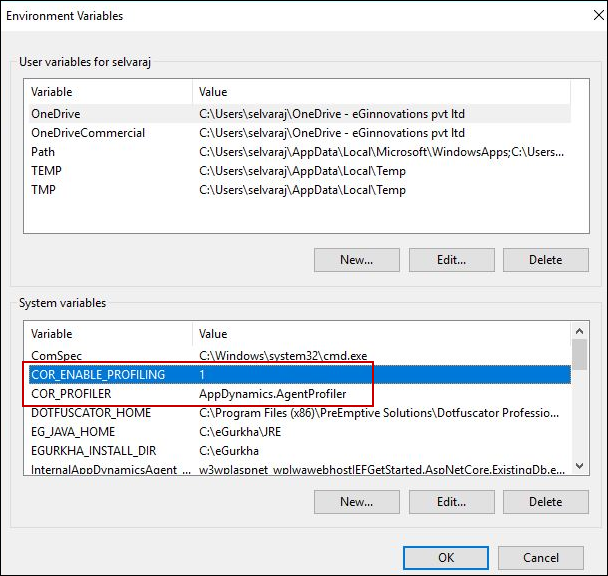
Figure 4 : Checking the System Variables list for the COR_PROFILER and COR_ENABLE_PROFILING variables
-
Check if the COR_PROFILER variable is set to any of the following identifiers
Profiler Name
CLSID / Identifier
App Dynamics
AppDynamics.AgentProfiler
Dynatrace
DA7CFC47-3E35-4c-4e-B495-534F93B28683
B7038F67-52FC-4DA2-AB02-969B3C1EDA03
Diagnostic Policy Service
555908D1-A6D7-4695-8E1E-26931D2012F4
IntelliTrace
2AA1AA98-2CAA-4FCF-86CE-EFA007737E83
Microsoft App Insights
324F817A-7420-4E6D-B3C1-143FBED6D855
SCOM APM
AD5651A8-B5C8-46ca-A11B-E82AEC2B8E78
Stackify
de70e25c-02b5-4556-a837-8aa6fe502668
JustTrace
8C29BC4E-1F57-461a-9B51-1200C32E6F1F
301ec75b-ad5a-459c-a4c4-911c878fa196
Wily Agent
5F048FC6-251C-4684-8CCA-76047B02AC98
Telerik
301EC75B-AD5A-459C-A4C4-911C878FA196
New Relic
FF68FEB9-E58A-4B75-A2B8-90CE7D915A26 or 71DA0A04-7777-4EC6-9643-7D28B46A8A41
Ruxit
B7038F67-52FC-4DA2-AB02-969B3C1EDA03
If it is so, then its a clear indicator that a profiler from a different vendor is installed on the host and not the eG .NET Profiler. On the other hand, if the COR_ENABLE_PROFILING variable is set to COR_PROFILER variable is set to 947734AF-7AE7-41DD-BAE5-5EA8E4AE89BB, then it means that the eG .NET Profiler is installed.
Checking the Event Logs
- Open the Windows Event Viewer and check the Application Event Log for messages of type Information from the event source “NET Runtime” .
-
Look for a message of the following format:
The profiler was loaded successfully. Profiler CLSID: '{<GUID_of_Profiler>}'
- If a message of the above format exists, and the <GUID_of_Profiler> that is displayed as part of the message is 947734AF-7AE7-41DD-BAE5-5EA8E4AE89BB, it means that the eG .NET profiler is installed on the server. On the other hand, if a different GUID is displayed as part of the message, it means that some other third-party profiler is installed on the server.
-
How to verify whether the eG .NET BTM module is successfully attached to a worker process (w3wp.exe)?
To achieve this, follow the steps below:
- Open the Windows Event Viewer and check the Application Event Log for messages of type Information from the event source “NET Runtime” .
-
If you find the following message therein, it means that the attachment is successful.
The profiler was loaded successfully. Profiler CLSID: '{947734AF-7AE7-41DD-BAE5-5EA8E4AE89BB}'. Process ID (decimal): 2640. Message ID: [0x2507].
-
What do I do if no messages are logged for the eG .NET Profiler?
The eG .NET Profiler automatically creates log files in the eg_dotNetBTM folder (of the C:\ProgramData\eGurkha\agent\Logs directory), and logs each operation it performs and its status in these log files.
If the eg_dotNetBTM directory is empty or if no messages are logged in the log files in this directory, it could mean one/both of the following:
- The BTM module has not loaded properly: To check this, follow the steps detailed in the response to question 3 above.
-
The <EG_INSTALL_DIR> cannot be accessed by Authenticated Users: Check whether Authenticated Users are allowed access to the <EG_INSTALL_DIR> that contains the eg_dotNetBTM directory. For that, do the following:
- First, navigate to the <EG_INSTALL_DIR> in Windows Explorer.
- Then, right-click on the <EG_INSTALL_DIR>, and select Properties.
- In the Properties dialog box that then appears, click the Security tab page.
-
Check for the Authenticated Users group in the Group or user names list in the Security tab page.
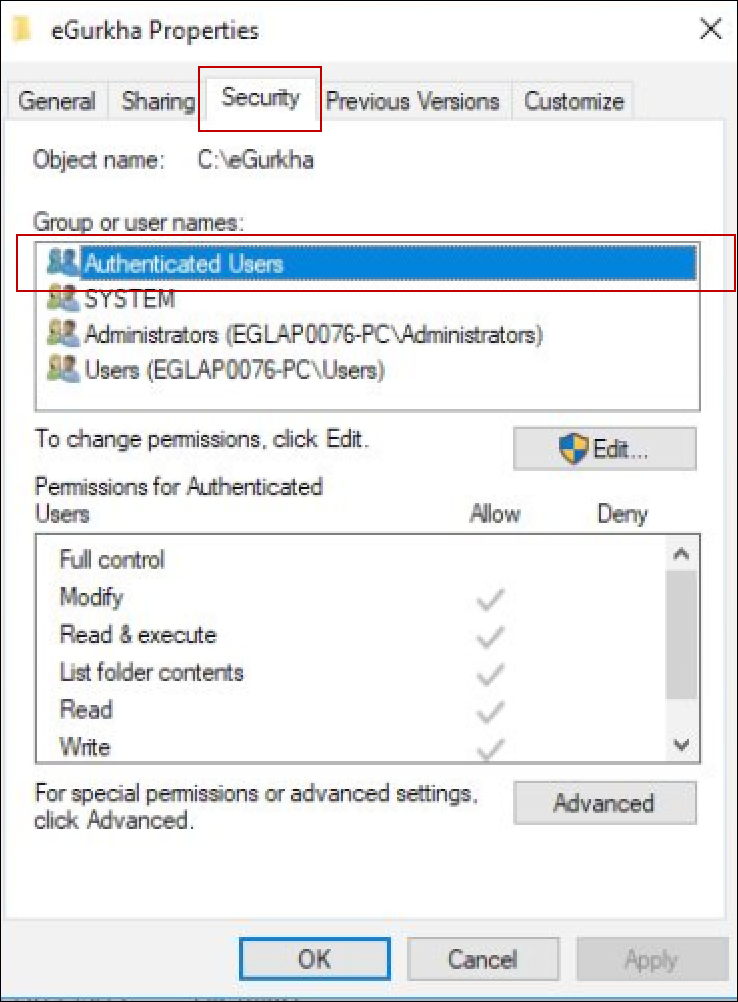
Figure 5 : Checking whether/not the 'Authenticated Users ' group is listed in the Group or User names list
-
If you do not find that group name in the Group or User names list, it means that the authenticated users cannot access the <EG_INSTALL_DIR> or its sub-directories. In this case, make sure that the Authenticated Users are allowed read/write access to the <EG_INSTALL_DIR>.
-
What do I do to save web application when the web site crashes / throws ERROR in web page, after .NET BTM is setup?
- First, open <EG_INSTALL_DIR>\agent\config\eg_DotnetServer.ini file and change INSTRUMENTATION_LEVEL to ‘2’. Then, run the IISRESET command.
- If the web site crashes even after the instrumentation level is changed, then run the uninstall_Profiler.bat in the <EG_INSTALL_DIR>\lib directory to uninstall the profiler. Once the profiler is uninstalled, run the IISRESET command
-
If the web site crashes even after the profiler is uninstalled, please contact the eG development team.
Note:
Please contact the development team, if problems persist even after the aforesaid checks are performed.
-
How can I check if .NET BTM module is sending data to eG agent?
Open the AgentComm.log file (in the C|PrgramData\eGurkha\agent\Logs\eg_dotNetBTM directory) and do the following:
-
Check for the following message in log file:
“[ERROR] unable to Connect with server 10061”
If the message is found, it indicates that the test has not started.
-
Check for the following message in log file:
“REQ SWAPPED - 1 & REQ SENT: 0 “
If the message is found, it indicates that the request was filtered/discarded, since the request does not pertain to the web site being monitored.
-
-
What if .Net BTM could not capture the requests even after all basic checks were performed and passed?
Open the AgentComm.log file (in the C\ProgramData\eGurkha\\agent\Logs\eg_dotNetBTM directory) and check if REQ_SWAPPED is ‘0’ for the w3wp.exe Process ID of the web site being monitored, even after the user hits the URL of the web site. If so, it indicates that the requests were not captured. Typically, requests to the following page types will not be captured:
- Pure HTML pages
- Pure ASP pages
-
Pages with any other extensions
This is because, the eG .NET BTM can trace the path of requests to only .NET web applications.
Please contact the development team if the problem persists.
-
I have installed the eG .NET Profiler on a Microsoft Sharepoint portal, but it is not working. What do I do?
Loader optimization assemblies in Sharepoint can interfere with profiler operations. If these assemblies are not disabled before you install the profiler, the profiler may not be able to profile transactions or measure their performance. Therefore, its imperative that you disable the loader optimization assemblies before BTM-enabling a Sharepoint portal/site. To achieve this, follow the steps below:
- First, go to the Registry Editor (regedit).
- Under HKEY_LOCAL_MACHINE\SOFTWARE\Microsoft\.NETFramework, create a new DWORD "LoaderOptimization" with value 1.
-
Then, under HKEY_LOCAL_MACHINE\SOFTWARE\Wow6432Node\Microsoft\.NETFramework\, create a new DWORD "LoaderOptimization" with value 1.
These configurations disable loader optimization assemblies, which may interfere with profiler operations.
- Finally, restart the IIS web server.
-
What do I do if one/more of the following occur after .NET Profiler installation:
-
I do not see any message in the log files stating that the profiler has successfully loaded;
-
The profiler loaded, but not with the proper CLSID;
-
CoCreateInstance errors were noticed in the Application Event Log, crashing the W3WP.exe process
As soon as you see the CoCreateInstace errors in the event logs, you can conclude that another CLR Profiler is competing with eG .NET CLR profiler. You can uninstall or disable the competing profiler. If you are still facing a problem, please contact the development team.
-
-
What entries are written in Windows registry during Profiler setup?
The profiler related values are written to the “Environment” key in the following locations:
-
Computer\HKEY_LOCAL_MACHINE\SYSTEM\CurrentControlSet\Services\WAS
-
Computer\HKEY_LOCAL_MACHINE\SYSTEM\CurrentControlSet\Services\W3SVC
The “Environment” key should have the following values in it:
-
COR_PROFILER={947734AF-7AE7-41DD-BAE5-5EA8E4AE89BB} - This the GUID of the eG .NET Profiler.
-
COR_ENABLE_PROFILING=1
-
-
What happens if the agent is stopped and the BTM Module is running?
The .NET BTM continues to collect metrics for transactions that occur after the agent is stopped.
By default, eG BTM will store metrics related to all transactions that occur for a maximum of 60 seconds (by default) after the agent turns unresponsive. This duration is however, configurable. For this, do the following:
-
Edit the eg_DotnetServer.ini in the <EG_INSTALL_DIR>\agent\config directory.
-
The WAIT_FOR_AGENT parameter in the file will be set to 60000 milliseconds (i.e., 60 seconds) by default. This means that by default eG BTM will store all transaction-related metrics for a maximum of 60 seconds after the agent stops running. You can, if you so need, increase or decrease the value of the WAIT_FOR_AGENT parameter.
-
Finally, save the file.
-
-
What should I do if the web server is running on load balancer mode?
.NET BTM module must not be installed on the load balancer machine. The BTM module must be set up on the server where the web site is deployed and running.
-
What type of applications can the eG .NET Profiler monitor?
.NET web applications, .NET Core web applications, .and NET / .NET Core Windows Service applications