Memory Usage - AVD Test
This test reports statistics related to the usage of physical memory of the VMs.
Target of the test : An Azure Virtual Desktop
Agent deploying the test : An internal agent.
Outputs of the test : One set of results for the chosen session host
| Parameters | Description |
|---|---|
|
Test Period |
How often should the test be executed. |
|
Host |
The host for which the test is to be configured. |
|
Port |
The default port is NULL. |
|
Group Processes With Arguments |
By default, the detailed diagnosis of the Used memory measure of this test reports the number of instances of each process running on the virtual desktop, and the aggregated memory usage (in MB and %) of every process across all its instances. For example, if users to a virtual desktop are together having 15 instances of Internet Explorer open on the desktop at around the same time, then the detailed diagnosis of the Used memory measure will compute and display the collective memory usage of all 15 instances against the Application Name, Internet Explorer. From this, you can quickly identify the exact process that is 'collectively' (i.e., across its instances) over-utilizing the desktop memory. In a multi-user environment such as Azure virtual desktops, administrators might want to isolate not just the process, but also similar process arguments that are guilty of abnormal memory consumption. This granular insight will take administrators closer to the root-cause of the memory bottleneck on a desktop. For instance, in the Internet Explorer example above, say 8 of the 15 IE instances are used to access the same YouTube video, and 7 instances are accessing a shopping site. In such a case, if memory usage is aggregated at the URL-level and not the process-level, then administrators can quickly identify which precise URL is draining desktop memory - the YouTube video? or the shopping site? For this, detailed diagnostics should be grouped by process arguments (eg., URLs) and not just by process/application names. To enable grouping by arguments, set the Group Processes With Arguments flag to Yes. By default, this flag is set to No. |
|
Detailed Diagnosis |
To make diagnosis more efficient and accurate, the eG Enterprise embeds an optional detailed diagnostic capability. With this capability, the eG agents can be configured to run detailed, more elaborate tests as and when specific problems are detected. To enable the detailed diagnosis capability of this test for a particular server, choose the On option. To disable the capability, click on the Off option. The option to selectively enable/disable the detailed diagnosis capability will be available only if the following conditions are fulfilled:
|
| Measurement | Description | Measurement Unit | Interpretation |
|---|---|---|---|
|
Total memory |
Indicates the total memory at the disposal of the Azure virtual desktop. |
MB |
|
|
Used memory |
Indicates the memory used by the Azure virtual desktop. |
MB |
Use the detailed diagnosis of this measure to know which application has the maximum number of instances running and how much memory is used by each application across all its instances. In the event of a memory contention on the desktop, these diagnostics will quickly point you to the process/application that is contributing to the contention. Optionally, you can turn on the Group Processes With Arguments flag and have detailed diagnosis aggregate memory usage by process argument and not process/application name. If this is done, then the detailed metrics will indicate which exact process argument is memory-hungry. |
|
Free memory |
Indicates the unused memory on the Azure virtual desktop. |
MB |
This measure typically indicates the amount of memory available for use by applications running on the target virtual desktop. For peak application performance therefore, the value of this measure should be high, |
|
Memory utilized |
Indicates the percent of allocated memory that is used by the chosen Azure virtual desktop. |
Percent |
Ideally, the value of this measure should be low. While sporadic spikes in memory usage could be caused by one/more rogue processes on the virtual desktop, a consistent increase in this value could be a cause for some serious concern, as it indicates a gradual, but steady erosion of valuable memory resources. If this unhealthy trend is not repaired soon, it could severely hamper virtual desktop performance, causing anything from a slowdown to a complete system meltdown. You can use the detailed diagnosis of this measure to figure out which processes on the desktop are consuming memory excessively. |
|
Available memory |
Indicates the amount of memory, immediately available for allocation to a process or for system use. |
MB |
Not all of the Available memory is Free memory. Typically, Available memory is made up of the Standby List, Free List, and Zeroed List. When Windows wants to trim a process' working set, the trimmed pages are moved (usually) to the Standby List. From here, they can be brought back to life in the working set with only a soft page fault (much faster than a hard fault, which would have to talk to the disk). If a page stays in the Standby List for a long time, it gets freed and moved to the Free List. In the background, there is a low priority thread (actually, the only thread with priority 0) which takes pages from the Free List and zeros them out. Because of this, there is usually very little in the Free List. All new allocations always come from the Zeroed List, which is memory pages that have been overwritten with zeros. This is a standard part of the OS' cross-process security, to prevent any process ever seeing data from another. If the Zeroed List is empty, Free List memory is zeroed and used or, if that is empty too, Standby List memory is freed, zeroed, and used. It is because all three can be used with so little effort that they are all counted as "available". A high value is typically desired for this measure. |
|
Modified memory |
Indicates the amount of memory that is allocated to the modified page list. |
MB |
This memory contains cached data and code that is not actively in use by processes, the system and the system cache. This memory needs to be written out before it will be available for allocation to a process or for system use. Cache pages on the modified list have been altered in memory. No process has specifically asked for this data to be in memory, it is merely there as a consequence of caching. Therefore it can be written to disk at any time (not to the page file, but to its original file location) and reused. However, since this involves I/O, it is not considered to be Available physical memory. |
|
Standby memory |
Indicates the amount of memory assigned to the standby list. |
MB |
This memory contains cached data and code that is not actively in use by processes, the system and the system cache. It is immediately available for allocation to a process or for system use. If the system runs out of available free and zero memory, memory on lower priority standby cache page lists will be repurposed before memory on higher priority standby cache page lists. Typically, Standby memory is the aggregate of Standby Cache Core Bytes, Standby Cache Normal Priority Bytes, and Standby Cache Reserve Bytes. Standby Cache Core Bytes is the amount of physical memory, that is assigned to the core standby cache page lists. Standby Cache Normal Priority Bytes is the amount of physical memory, that is assigned to the normal priority standby cache page lists. Standby Cache Reserve Bytes is the amount of physical memory, that is assigned to the reserve standby cache page lists. |
|
Cached memory |
This measure is an aggregate of Standby memory and Modified memory. |
MB |
|
From the detailed diagnosis of the Used memory measure, you can identify which application has the maximum number of instances running and how much memory is used by each application across all its instances. In the event of a memory contention on the desktop, these diagnostics will quickly point you to the process/application that is contributing to the contention. Optionally, you can turn on the Group Processes With Arguments flag and have detailed diagnosis aggregate memory usage by process argument and not process/application name. If this is done, then the detailed metrics will indicate which exact process argument is memory-hungry.
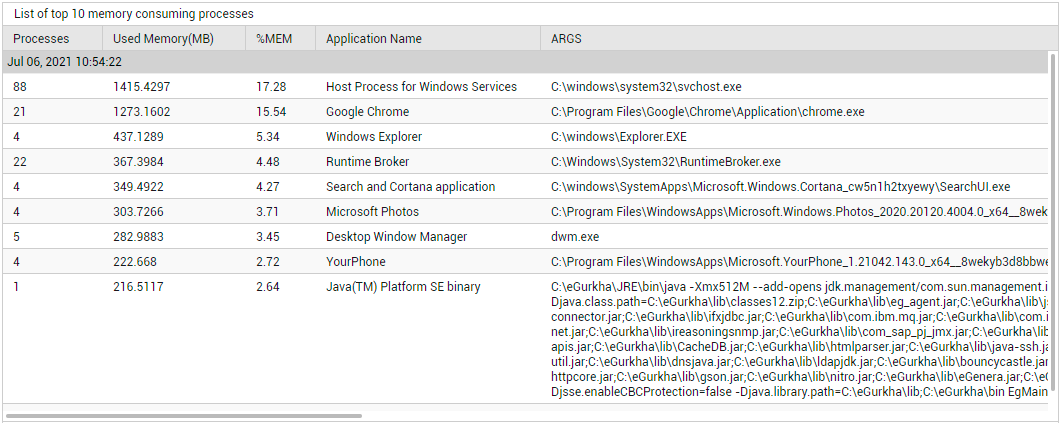
Figure 1 : The detailed diagnosis of the Used memory measure
You can use the detailed diagnosis of the Memory utilized measure to figure out which precise PIDs on the desktop are consuming memory excessively.
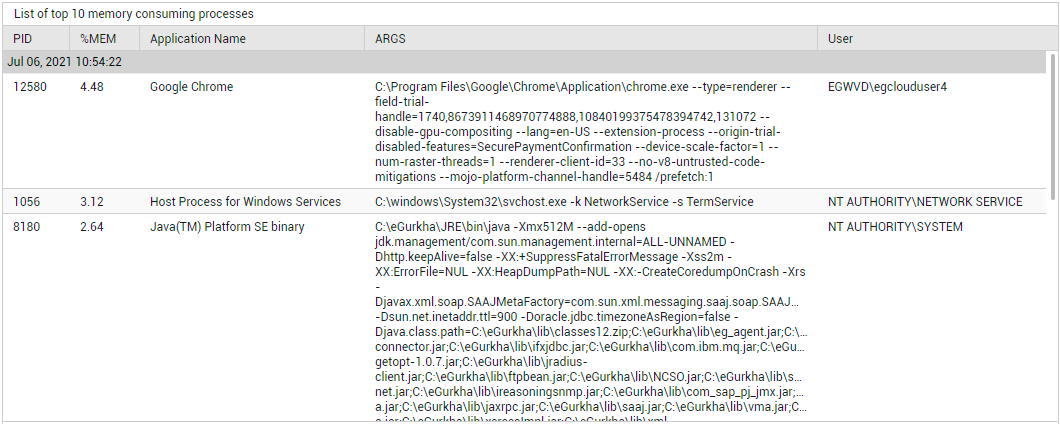
Figure 2 : The detailed diagnosis of the Memory utilized measure