Docker Events Test
By default, the Docker containers can be created, run, started, stopped, moved, and deleted. These actions are called events in the Docker events API. By constantly monitoring the events triggered by the Docker, administrators can identify how many create events were triggered while creating the containers, how many events were triggered to delete the containers etc. The Docker Events test helps administrators to figure out the various events triggered by the Docker server.
This test monitors the Docker server and reports the total number of events triggered on the containers of the Docker server. In addition, this test helps administrators to figure out how many times the start and stop events were triggered to start and stop the containers. Alongside, administrators can also identify the create events, delete events and die events that were triggered on the server. Using this test, administrators can easily identify how well the containers are managed within the Docker server and proactively be alerted to unpleasant eventualities caused due to the slowdowns in application processing as well as processing bottlenecks.
Note:
This test will run and report metrics, only if the following pre-requisites are fulfilled:
- The Docker server should be of v1.5 or above.
- Remote REST API should be enabled on the Docker host. To know how to enable remote REST API, follow the procedure discussed in How does eG Enterprise Monitor Docker?
- The eG agent should be 'allowed' to make remote REST API calls to pull metrics. For this purpose, make sure you configure this test with the credentials of a user who has permissions to connect to remote REST API and invoke its methods.
-
Make sure that the WEBPORT parameter of this test is configured with the port on which remote REST API has been enabled.
Target of the test : A Docker server
Agent deploying the test : An internal/remote agent
Outputs of the test : One set of results for the target Docker server being monitored .
| Parameter | Description |
|---|---|
|
Test Period |
How often should the test be executed. |
|
Host |
The IP address of the host for which this test is to be configured. |
|
Port |
The port number at which the specified HOST listens. The default is 2375. |
|
UseSUDO |
This flag is not applicable to this test. |
|
Confirm Password |
Confirm the Password by retyping it here. |
|
Webport |
By default, the remote REST API is enabled on port 2375. This implies that by default, this test connects to port 2375 to access the remote REST API and make API calls for metrics collection. In some environments however, the remote REST API can be enabled on a different port. To know how to enable the remote REST API on a different port, follow the procedure discussed in How does eG Enterprise Monitor Docker? Make sure you configure this parameter with the exact port on which the remote REST API has been enabled. To know which port number that is, do the following:
|
|
DD Frequency |
Refers to the frequency with which detailed diagnosis measures are to be generated for this test. The default is 1:1. This indicates that, by default, detailed measures will be generated every time this test runs, and also every time the test detects a problem. You can modify this frequency, if you so desire. Also, if you intend to disable the detailed diagnosis capability for this test, you can do so by specifying none against DD frequency. |
|
Detailed Diagnosis |
To make diagnosis more efficient and accurate, the eG Enterprise embeds an optional detailed diagnostic capability. With this capability, the eG agents can be configured to run detailed, more elaborate tests as and when specific problems are detected. To enable the detailed diagnosis capability of this test for a particular server, choose the On option. To disable the capability, click on the Off option. The option to selectively enabled/disable the detailed diagnosis capability will be available only if the following conditions are fulfilled:
|
| Measurement | Description | Measurement Unit | Interpretation |
|---|---|---|---|
|
Total events |
Indicates the total number of events that occurred during the last measurement period. |
Number |
The detailed diagnosis of this measure if enabled, lists the Container ID, Container Name, Image, Event type and Time at which each event occurred. |
|
Create events |
Indicates the number Create events that occurred during the last measurement period. |
Number |
The detailed diagnosis of this measure if enabled, lists the Container ID, Container Name, Image, Event type and Time at which each event was created. |
|
Delete events |
Indicates the number of Delete events that occurred during the last measurement period. |
Number |
The detailed diagnosis of this measure if enabled, lists the Container ID, Container Name, Image, Event type and Time at which each event was deleted. |
|
Start events |
Indicates the number of Start events that occurred during the last measurement period. |
Number |
The detailed diagnosis of this measure if enabled, lists the Container ID, Container Name, Image, Event type and Time at which the events were started. |
|
Stop events |
Indicates the total number of Stop events that occurred during the last measurement period. |
Number |
The detailed diagnosis of this measure if enabled, lists the Container ID, Container Name, Image, Event type and Time at which the events were stopped. |
|
Die events |
Indicates the number of die events during the last measurement period. |
Number |
The detailed diagnosis of this measure if enabled, lists the Container ID, Container Name, Image, Event type and Time at which the die events occurred. |
The detailed diagnosis of the Total Events measure lists the containers on which the events occurred.
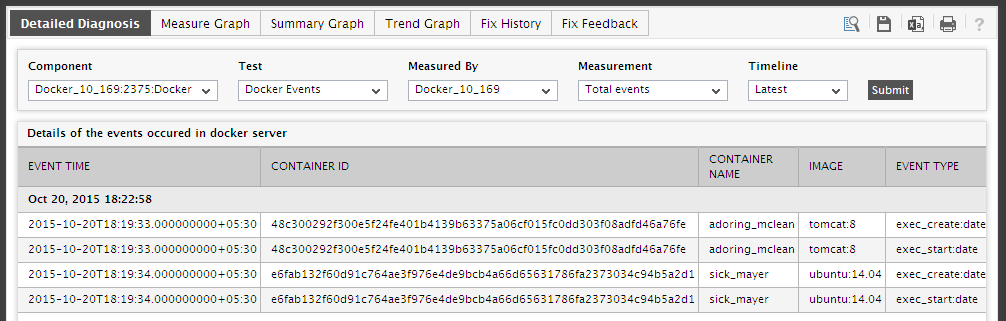
Figure 1 : The detailed diagnosis of the Total Events measure
