HAProxy Uptime Test
In most production environments, it is essential to monitor the uptime of critical servers in the infrastructure. By tracking the uptime of each of the servers, administrators can determine what percentage of time a server has been up. Comparing this value with service level targets, administrators can determine the most trouble-prone areas of the infrastructure.
In some environments, administrators may schedule periodic reboots of their servers. By knowing that a specific server has been up for an unusually long time, an administrator may come to know that the scheduled reboot task is not working on a server.
This test included in the eG agent monitors the uptime of the target HA Proxy server.
Target of the test : A HA Proxy Server
Agent deploying the test : A remote agent
Outputs of the test : One set of results for the target proxy server being monitored
| Parameters | Description |
|---|---|
|
Test period |
This indicates how often should the test be executed. |
|
Host |
The host for which the test is to be configured. |
|
Port |
Refers to the port used by the HA Proxy server. By default, this is 9000. |
|
HA Proxy Username |
The user name of the proxy server |
|
HA Proxy Password |
The password of the proxy server |
|
HA Proxy Port |
Refers to the port used by the HA Proxy server. |
|
SSL |
By default, the HA Proxy server is SSL-enabled. Accordingly, the SSL flag is set to Yes by default. This indicates that the eG agent will communicate with the HA Proxy server via HTTPS by default. |
|
HA Proxy Timeout |
Specify the time duration (in seconds) beyond which this test should time out in the HA Proxy Timeout text box. The default is 240 seconds. |
|
ReportManagerTime |
By default, this flag is set to Yes, indicating that, by default, the detailed diagnosis of this test, if enabled, will report the shutdown and reboot times of the server in the manager’s time zone. If this flag is set to No, then the shutdown and reboot times are shown in the time zone of the system where the agent is running (i.e., the system on which the remote agent is running - for agentless monitoring). |
|
System Properties |
By default, eG Enterprise is capable of monitoring the proxy servers that are SSL-enabled. For this, you need to configure the test with separate credentials for accessing the target proxy server. This can be achieved by clicking the |
|
DD Frequency |
Refers to the frequency with which detailed diagnosis measures are to be generated for this test. The default is 1:1. This indicates that, by default, detailed measures will be generated every time this test runs, and also every time the test detects a problem. You can modify this frequency, if you so desire. Also, if you intend to disable the detailed diagnosis capability for this test, you can do so by specifying none against DD Frequency. |
|
Detailed Diagnosis |
To make diagnosis more efficient and accurate, the eG Enterprise embeds an optional detailed diagnostic capability. With this capability, the eG agents can be configured to run detailed, more elaborate tests as and when specific problems are detected. To enable the detailed diagnosis capability of this test for a particular server, choose the On option. To disable the capability, click on the Off option. The option to selectively enable/disable the detailed diagnosis capability will be available only if the following conditions are fulfilled:
|
| Measurement | Description | Measurement Unit | Interpretation | ||||||
|---|---|---|---|---|---|---|---|---|---|
|
Has the system been rebooted? |
Indicates whether the server has been rebooted during the last measurement period or not. |
|
If this measure shows 1, it means that the server was rebooted during the last measurement period. By checking the time periods when this metric changes from 0 to 1, an administrator can determine the times when this server was rebooted. |
||||||
|
Uptime during the last measure period |
Indicates the time period that the server has been up since the last time this test ran. |
Seconds |
If the server has not been rebooted during the last measurement period and the agent has been running continuously, this value will be equal to the measurement period. If the server was rebooted during the last measurement period, this value will be less than the measurement period of the test. For example, if the measurement period is 300 secs, and if the server was rebooted 120 secs back, this metric will report a value of 120 seconds. The accuracy of this metric is dependent on the measurement period - the smaller the measurement period, greater the accuracy. |
||||||
|
Total uptime of the HA Proxy |
Indicates the total time that the server has been up since its last reboot. |
|
This measure displays the number of years, months, days, hours, minutes and seconds since the last reboot. Administrators may wish to be alerted if a server has been running without a reboot for a very long period. Setting a threshold for this metric allows administrators to determine such conditions. |
||||||
|
Is under maintenance? |
Indicates whether the server is under maintenance or not. |
|
The values reported by this measure and its numeric equivalents are mentioned in the table below:
Note: This measure reports the Measure Values listed in the table above to indicate whether the target server is under maintenance. However, in the graph, this measure is indicated using the Numeric Values listed in the table above. |
Configuring System Properties for Monitoring
By default, eG Enterprise is capable of monitoring the proxy servers that are SSL-enabled. For this, you need to configure the test with separate credentials for accessing the target proxy server. This can be achieved by clicking the ![]() icon available against the System Properties parameter. Figure 1 then appears.
icon available against the System Properties parameter. Figure 1 then appears.
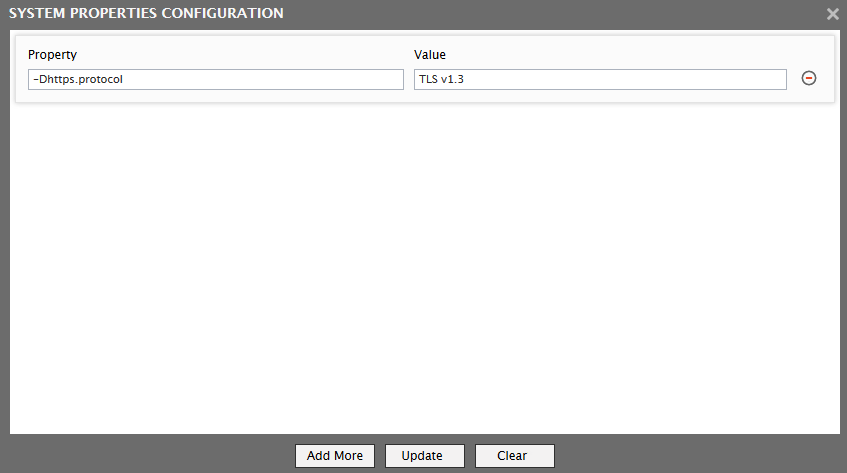
Figure 1 : Specify the System Properties
In Figure 1 that appears, you need to specify the following:
- Property: Here, specify the protocol that should be used when the target proxy server is SSL- enabled. By default, this value is set to none. For example, if the target proxy server is using -Dhttps.protocol then, specify -Dhttps.protocol against this text box.
- Value: Specify the SSL version of the web page(s) that need to be accessed by the target proxy server. By default, this value is set to none. For example, if the web pages accessed by the target proxy server is using TLS v1.3, then, specify TLS v1.3 against this text box.
Once you have specified the Property and Values, click the Update button to register your changes. To add another set of System properties, click the Add more button. To delete a set of System properties, click the encircled "-" button available against each set of system properties. To clear the text boxes, click the Clear button.