Monitoring Infoblox
eG Enterprise provides a specialized Infoblox appliance monitoring model (see Figure 1) to monitor the services of the Infoblox appliance, the messages transmitted/received through various protocols, the DNS zones in the appliance etc .
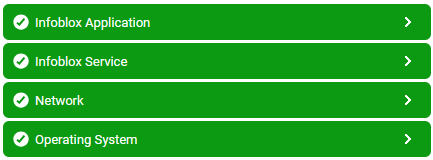
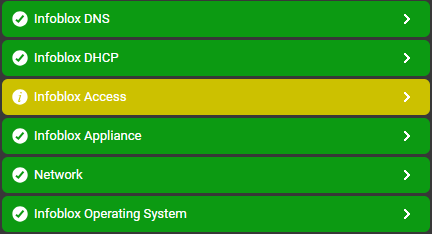
Figure 1 : The layer model of an Infoblox appliance
- Is any fan running at an abnormal speed?
- Has any power supply unit failed? If so, which are those power supply units?
- Is the appliance running short of CPU/disk/memory resources?
- Is the Infoblox database running out of object capacity?
- Is the target Infoblox appliance the grid master of an Infoblox grid?
- Has the license of the target appliance expired?
- Is the target appliance part of a high availability setup? If yes, has the appliance switched over recently?
- Is there a sudden spike in the count of DHCP requests and DHCP discovers to the target appliance?
- Is the target Infoblox appliance available over SSH?
- Are there any DNS request failures encountered by DNS queries? If so, which DNS query encountered frequent failures?
-
Has any type of DNS request encountered frequent failure on the target appliance?