
Configuring JVM Monitoring for a JBoss EAP Server
To collect JVM-related metrics, the eG agent connects to the JRE of the JBoss EAP Server via JMX. To enable JVM monitoring therefore, JMX support is required.
By default, JMX support is enabled on JBoss EAP. However, to enable the eG agent to use JMX, the following requirements have to be fulfilled:
-
The JVM tests that the eG agent runs should be configured with a JMX Remote Port - this is the port at which the JMX listens for requests from remote hosts. You need to determine the correct JMX remote port to configure.
- If the target server is operating in the domain mode, then management-http endpoint has to be disabled on the domain controller.
Each of the above-mentioned requirements are dealt with elaborately in the topics that follow.
Determining the JMX Remote Port
By default, JMX support is enabled on port 9990. This means that in all the JVM tests that the eG agent runs, 9990 is by default set as the JMX Remote Port. However, depending upon the operating mode of the target JBoss EAP server, you may have to override this default setting by specifying a different port number at the time of test configuration.
Typically, JBoss EAP operates in one of the following modes:
- Standalone server operating mode for managing discrete instances
-
Managed domain operating mode for managing groups of instances from a single control point
To know in which mode the JBoss EAP server you want to monitor is operating, login to the JBoss Management Console and click the Runtime option in its main menu. When Figure 1 appears, take a look at the options displayed in the left panel of Figure 1.
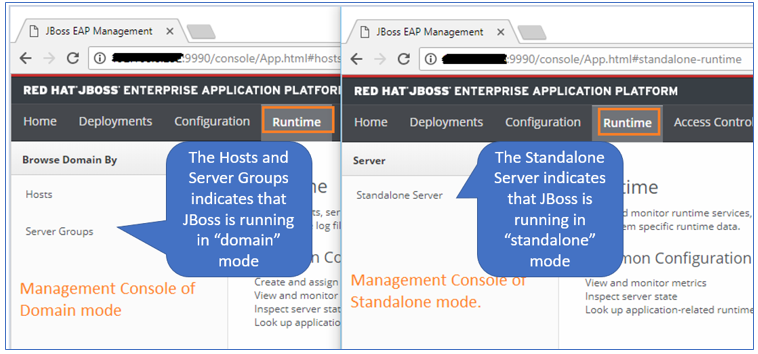
Figure 9 : How to determine the operating mode of JBoss EAP
If you see Hosts and Server Groups displayed therein, it indicates that the target JBoss EAP server is running in the domain mode. If you see Standalone Server there instead, it implies that the target server is running in the standalone mode.
If the server to be monitored is operating in the standalone mode, then follow the steps below to determine the port on which JMX is enabled:
-
First, determine the profile on which the JBoss server is running. In the standalone operating mode, each profile is associated with a configuration file (*.xml). This configuration file is where the various port bindings are configured. The table below lists the profile names and the configuration (XML) file that corresponds to each:
Profile Name
Configuration File Name
Default
standalone.xml
full
standalone-full.xml
ha
standalone-ha.xml
Full-ha
standalone-full-ha.xml
-
Next, determine which configuration file is in use on the target server and zoom into the contents of that file to identify the port number on which JMX is enabled. To know the configuration file, login to the JBoss Management Console of the target server, click on the Tools menu at the bottom of the console and choose the Management Model option (as indicated by Figure 10).
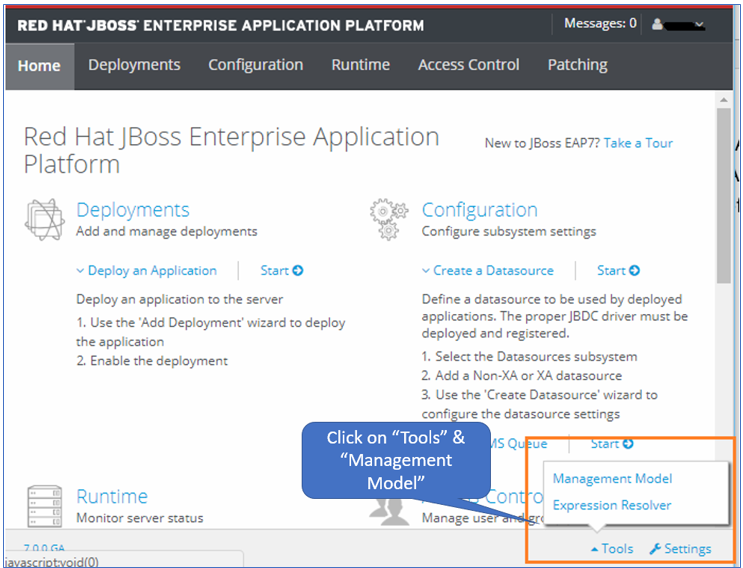
Figure 10 : Selecting the Management Model option from Tools menu
-
Then, in the tree-structure that appears in the left panel (see Figure 11), expand the Management Model node. Expand the core-service sub-node within, and finally click the server-environment sub-node (see Figure 11). The right panel will then change to display the details about the target server. Browsing these details will lead you to the Config file of the standalone server (see Figure 11).
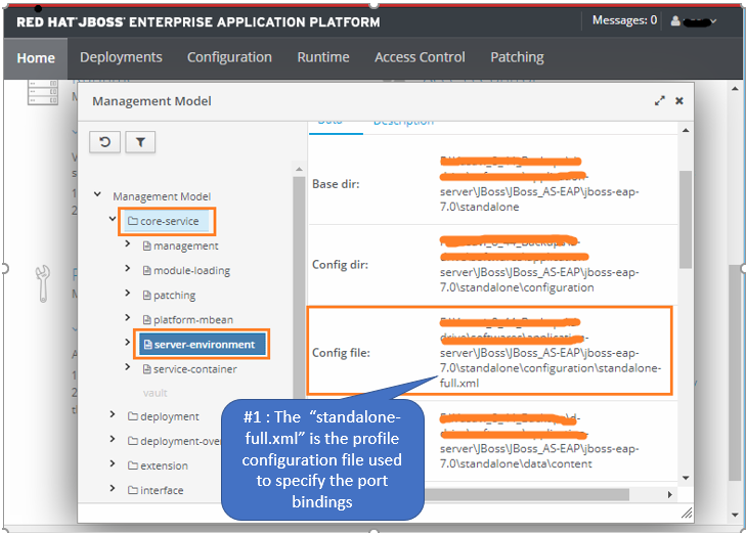
Figure 11 : Determining the configuration file of the monitored server
-
Next, open the indicated Config file using a text/XML editor (see Figure 12). In the file, look for the “socket-binding-group” attribute. Within that attribute, search for the “management-http” socket binding. Typically, in most systems, JMX is enabled on the "management-http" socket binding only - i.e., JMX listens on the management-http port only. In the example of Figure 12, the port used for management-http is set as 9990. This is the port that you should use when configuring the JMX Remote Port parameter of the eG tests.
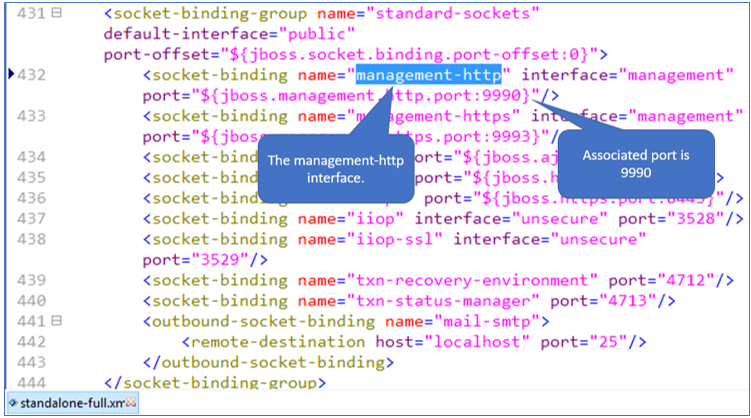
Figure 12 : Determining the JMX Remote Port of the JBoss EAP server
Note:
In some environments, the port-offset will also be used to indicate the port. In the environment illustrated by Figure 12 above, the port offset value is set to 0. So the management-http port remains same as “9990”. In case the port-offset is configured with a non-zero value, then you will have to add this port-offset value with the management-http port, and configure the resultant sum as the JMX remote port. For instance, if the port-offset value is 10 and the management-http port is 9990, then you will have to configure 10000 (9990+10) as the JMX remote port. Also, remember that the port-offset sometimes is set via Java Options.
In the domain operating mode, there can be ‘N’ server instances hosted on ‘M’ hosts. Within the M hosts, one acts as master (domain controller) and the remaining are slaves (host controllers). The management console is available only in domain controller.
If the JBoss EAP server to be monitored is operating in the domain mode, then, when enabling JVM monitoring for that server, make sure that you configure the JMX remote port parameter of the eG tests with the application/HTTP port. To determine the application/HTTP port of a JBoss EAP server, follow the steps below:
-
First, login to the target server and identify the profile on which it runs. For that, login to the management console of the domain controller. From the Tools button at the bottom of the console, select the Management Model option (see Figure 13).
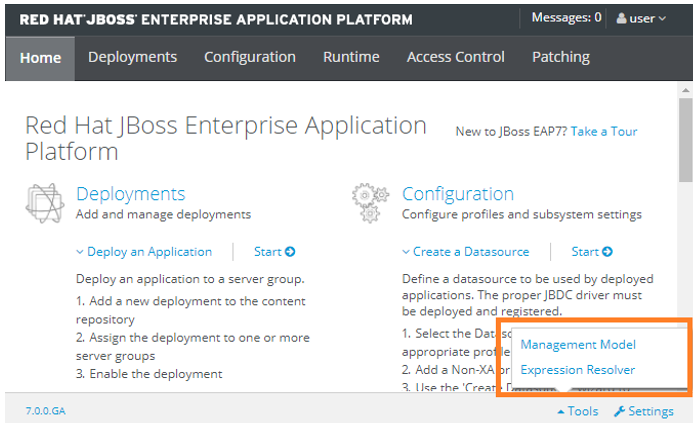
Figure 13 : Selecting the Management Model option from the Tools menu in the management console of the domain controller
-
Figure 14 then appears, where you will find a tree-structure in the left panel. Expand the Management Model node in the tree-structure, and then expand the server-group sub-node within. Finally, click the main-server-group sub-node. The right panel will change to display the details of the main-server-group. The Profile name will be displayed as part of these details. In the case of the example illustrated by Figure 14, full is the Profile name of the target JBoss EAP server.
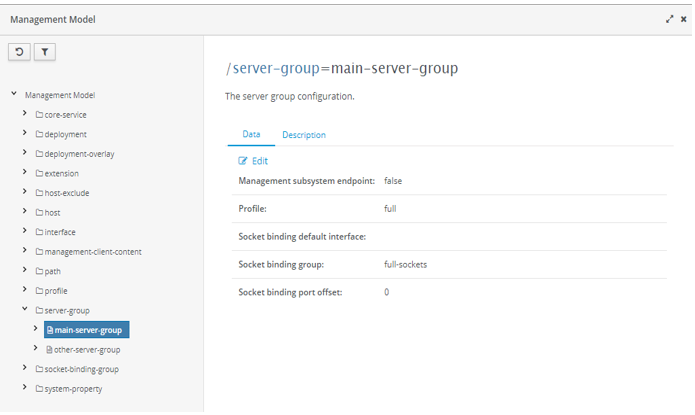
Figure 14 : Finding the profile name of the target JBoss EAP server
- Next, open the <EAP_HOME>/domain/configuration/host.xml file on the target server, using a text/XML editor. Typically, each JBoss server host that is managed by a domain controller is associated with a host.xml file; this is the file from which each host reads its configuration.
-
In the host.xml file, look for a "socket-binding-group name" that corresponds to the profile name of the target server. For instance, if the target server runs on the "full" profile, then look for a "socket-binding-group name " that is set to "full-sockets" (see Figure 15).
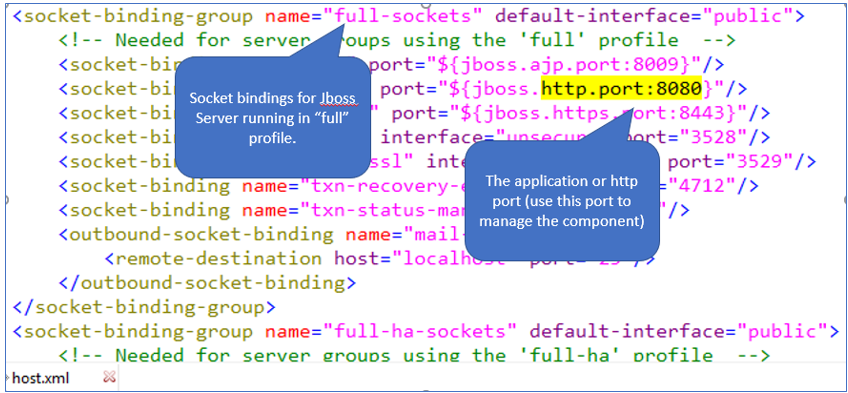
Figure 15 : Determining the port number of a JBoss EAP server operating in the domain mode
-
In the "full-sockets" section, you will find a specification of the following format (as indicated by Figure 15):
"${jboss.http.port:<port_number>}"
The <port_number> in this specification, is the application/HTTP port of the target JBoss server. When configuring the eG tests, make sure you specify this port number as the JMX Remote Port of the target JBoss EAP server.
Note:
In some environments, the combination of http.port and port-offset setting may have to be used to determine the JMX Remote Port.
In the host.xml file, you will find separate sections for each server managed by the domain controller. Each of these sections will be headed , <server name="<name of the server managed by the domain controller>". The port-offset setting will be part of some/all of these server-specific sections. For instance, in Figure 16 below, you can see 2 server-specific sections - one for server-one and another for server-two.
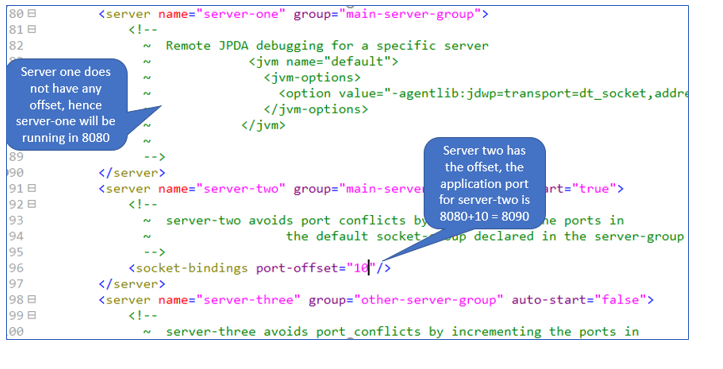
Figure 16 : Port-offset and its impact on the application/HTTP port configuration of a server
If the port-offset parameter is unavailable in a server-specific section, then the JMX remote port will be the http.port shown by Figure 15. For instance, server-one in Figure 16 does not have a port-offset setting; this means that the JMX remote port of that server will only be 8080 (as indicated by Figure 16). On the other hand, if a port-offset parameter is available in a server-specific section and is configured with a non-zero value, then you will have to add this port-offset value to the http.port setting of Figure 15, and configure the resultant sum as the JMX remote port of the target JBoss server. For instance, server-two in Figure 16 is configured with the port-offset value of 10. If the http.port is set as 8080, then you will have to configure 8090 (8080+10) as the JMX remote port. Also, remember that the port-offset sometimes is set via Java Options.
-
Disabling the management-http Endpoint for a Server Operating in the Domain Mode
In case of a standalone server, all management activities are performed via the management-http port on that server. Moreover, since JMX also listens on that port, JVM monitoring for a standalone server is also performed only via its management-http port.
In case of a domain/cluster setup, all management activities are performed centrally on the domain controller. Clients interact with the individual servers/server instances in the domain only via the application/HTTP port on each server/instance; not via any management-http port. This is why, the eG agent should use the application/HTTP port of each server/server instance to monitor the health of its JVM. For this purpose, you need to make sure that the inbound and outgoing JMX connections for a domain do not use the management-http port. To achieve this, you need to disable the management-http endpoint on the remoting connector for the JMX sub-system of the entire domain. The steps to achieve this are given below:
-
First, login to the domain controller and identify the profile on which it runs. For that, login to the management console of the domain controller. From the Tools button at the bottom of the console, select the Management Model option (see Figure 17).
Figure 17 : Selecting the Management Model option from the Tools menu in the management console of the domain controller
-
Figure 18 then appears, where you will find a tree-structure in the left panel. Expand the Management Model node in the tree-structure, and then expand the server-group sub-node within. Finally, click the main-server-group sub-node. The right panel will change to display the details of the main-server-group. The Profile name will be displayed as part of these details. In the case of the example illustrated by Figure 6, full is the Profile name of the target JBoss EAP server.
Figure 18 : Finding the profile name of the target JBoss EAP server
- Next, open the <EAP_HOME>/domain/configuration/domain.xml file using a text/XML editor. In the file, first locate the section that corresponds to the profile of the server. For instance, if the profile is "full", then look for the section headed <profile name="full">.
-
In that section, look for the following entry:
<subsystem xmlns="urn:jboss:domain:jmx:1.3">
-
What follows the above entry (in the file) is the JMX configuration of the domain. Therefore, search for the following entry in the JMX configuration:
<remoting-connector use-management-endpoint="false">
-
Typically, the remoting-connector entry will be commented. If so, uncomment it. If you do not find such an entry at all, then add one as indicated by Figure 19.
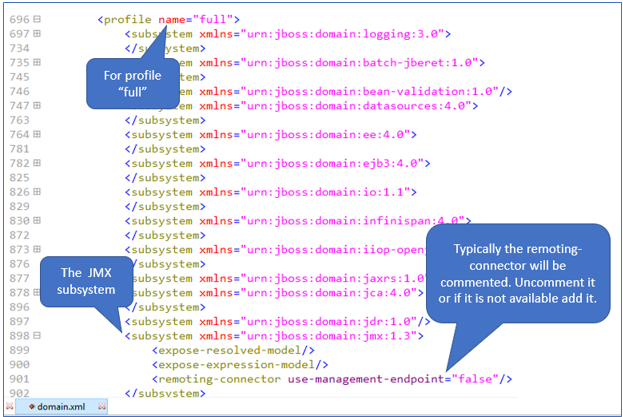
Figure 19 : Disabling the management endpoint for the domain
- Finally, save the file.
