Java Transactions Test
When a user initiates a transaction to a J2EE application, the transaction typically travels via many sub-components before completing execution and sending out a response to the user.
Figure 244 reveals some of the sub-components that a web transaction/web request visits during its journey.
![]()
Figure 244 : The layers through which a Java transaction passes
The key sub-components depicted by Figure 244 have been briefly described below:
- Filter: A filter is a program that runs on the server before the servlet or JSP page with which it is associated. All filters must implement javax.servlet.Filter. This interface comprises three methods: init, doFilter, and destroy.
- Servlet: A servlet acts as an intermediary between the client and the server. As servlet modules run on the server, they can receive and respond to requests made by the client. If a servlet is designed to handle HTTP requests, it is called an HTTP Servlet.
- JSP: Java Server Pages are an extension to the Java servlet technology. A JSP is translated into Java servlet before being run, and it processes HTTP requests and generates responses like any servlet. Translation occurs the first time the application is run.
- Struts: The Struts Framework is a standard for developing well-architected Web applications. Based on the Model-View-Controller (MVC) design paradigm, it distinctly separates all three levels (Model, View, and Control).
A delay experienced by any of the aforesaid sub-components can adversely impact the total response time of the transaction, thereby scarring the user experience with the web application. In addition, delays in JDBC connectivity and slowdowns in SQL query executions (if the application interacts with a database), bottlenecks in delivery of mails via the Java Mail API (if used), and any slow method calls, can also cause insufferable damage to the 'user-perceived' health of a web application.
The challenge here for administrators is to not just isolate the slow transactions, but to also accurately identify where the transaction slowed down and why - is it owing to inefficent JSPs? poorly written servlets or struts? poor or the lack of any JDBC connectivity to the database? long running queries? inefficient API calls? or delays in accessing the POJO methods? The eG JTM Monitor provides administrators with answers to these questions!
With the help of the Java Transactions test, the eG JTM Monitor traces the route a configured web transaction takes, and captures live the total responsiveness of the transaction and the response time of each Java component it visits en route. This way, the solution proactively detects transaction slowdowns, and also precisely points you to the sub-components causing it - is it the Filters? JSPs? Servlets? Struts? JDBC? SQL query? Java Mail API? or the POJO? In addition to revealing where (i.e., at which Java component) a transaction slowed down, the solution also provides the following intelligent insights, on demand, making root-cause identification and resolution easier:
- A look at the methods that took too long to execute, thus leading you to those methods that may have contributed to the slowdown;
- Single-click access to each invocation of a chosen method, which provides pointers to when and where a method spent longer than desired;
- A quick glance at SQL queries and Java errors that may have impacted the responsiveness of the transaction;
Using these interesting pointers provided by the eG JTM Monitor, administrators can diagnose the root-cause of transaction slowdowns within minutes, rapidly plug the holes, and thus ensure that their critical web applications perform at peak capacity at all times!
How does eG Perform Java Transaction Monitoring?
Figure 245 depicts how eG monitors Java transactions.
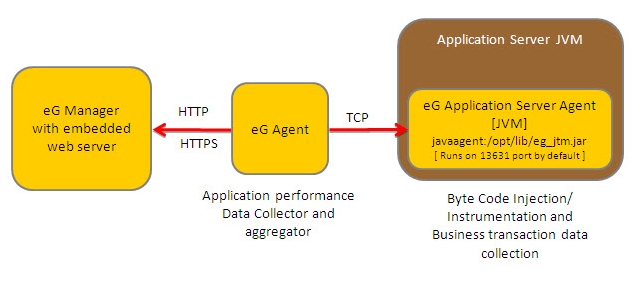
Figure 245 : How eG monitors Java transactions
To track the live transactions to a J2EE application, eG Enterprise requires that a special eG Application Server Agent be deployed on the target application. The eG Application Server Agent is available as a file named eg_jtm.jar on the eG agent host, which has to be copied to the system hosting the application being monitored. The detailed steps for deployment have been discussed hereunder:
In the <EG_INSTALL_DIR>\lib\jtm directory (on Windows; on Unix, this will be /opt/egurkha/lib/jtm) of the eG agent, you will find the following files:
- eg_jtm.jar
- aspectjrt.jar
- aspectjweaver.jar
- jtmConn.props
- jtmLogging.props
- jtmOther.props
- Login to the system hosting the Java application to be monitored.
- If the eG agent will be 'remotely monitoring' the target Java application (i.e., if the Java application is to be monitored in an 'agentless manner'), then, copy all the files mentioned above from the <EG_INSTALL_DIR>\lib\jtm directory (on Windows; on Unix, this will be /opt/egurkha/lib/jtm) of the eG agent to any location on the Java application host.
-
Then, proceed to edit the start-up script of the Java application being monitored, and append the following lines to it:
set JTM_HOME=<<PATH OF THE LOCAL FOLDER CONTAINING THE JAR FILES AND PROPERTY FILES LISTED ABOVE>>
"-javaagent:%JTM_HOME%\aspectjweaver.jar" "-DEG_JTM_HOME=%JTM_HOME%"
Note that the above lines will change based on the operating system and the web/web application server being monitored.
- Then, add the eg_jtm.jar, aspectjrt.jar, and aspectjweaver.jar files to the classpath of the Java application being monitored.
- Finally, save the file.
Next, edit the jtmConn.props file. You will find the following lines in the file:
#Contains the connection properties of eGurkha Java Transaction Monitor
JTM_Port=13631
Designated_Agent=
By default, the jtm_Port parameter is set to 13631. If the Java application being monitored listens on a different JTM port, then specify the same here. In this case, when managing a Java Application using the eG administrative interface, specify the JTM_Port that you set in the jtmConn.props file as the Port of the Java application.
Also, against the Designated_Agent parameter, specify the IP address of the eG agent which will poll the eG JTM Monitor for metrics. If no IP address is provided here, then the eG JTM Monitor will treat the host from which the very first 'measure request' comes in as the Designated_Agent.
Note:
In case a specific Designated_Agent is not provided, and the eG JTM Monitor treats the host from which the very first 'measure request' comes in as the Designated_Agent, then if such a Designated_Agent is stopped or uninstalled for any reason, the eG JTM Monitor will wait for a maximum of 10 measure periods for that 'deemed' Designated_Agent to request for metrics. If no requests come in for 10 consecutive measure periods, then the eG JTM Monitor will begin responding to 'measure requests' coming in from any other eG agent.
Finally, save the jtmConn.props file.
Restart the Java application.
Each request in the J2EE architecture is handled by a thread. Once the Java application is restarted therefore, the eG Application Sever Agent uses the thread ID and thread local data to keep track of requests to configured URL patterns (see Figure 246).
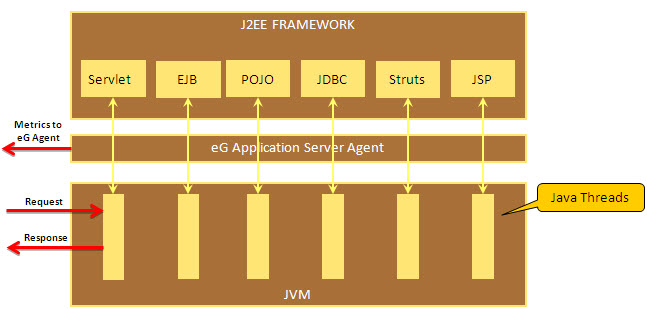
Figure 246 : The eG Application Server Agent tracking requests using Java threads
In the process, the eG Application Sever Agent collects metrics for each URL pattern and stores them in memory. Then, every time the Java Transactions test runs, the eG agent will poll the eG Application Server Agent for the required metrics, extract the same from the memory, and report them to the eG manager.
The table below explains how to configure the Java Transactions test and what measures it reports.
Note:
In case a specific Designated_Agent is not provided, and the eG JTM Monitor treats the host from which the very first 'measure request' comes in as the Designated_Agent, then if such a Designated_Agent is stopped or uninstalled for any reason, the eG JTM Monitor will wait for a maximum of 10 measure periods for that 'deemed' Designated_Agent to request for metrics. If no requests come in for 10 consecutive measure periods, then the eG JTM Monitor will begin responding to 'measure requests' coming in from any other eG agent.
Note:
- If the value of any of the parameters of the Java Transactions test is changed at a later point in time, then the test will not report any metrics for the measurement cycle that immediately follows the change. For instance, say that the Java Transactions test has been configured to run every 10 minutes, and the last time the test executed was as at 10.30 AM. This means that the test will execute next at 10.40 AM. Now, if you make changes to the test parameters at say, 10.35 AM, no metrics will be reported by the test when it executes at 10.40 AM. However, subsequently, when the test executes again at 10.50 AM, it will report all metrics.
- If multiple instances of a Java application are running on a single host, then, you can monitor the Java transactions of all instances using the eg_jtm.jar file available in the <eg_install_Dir>\lib\jtm folder (on Windows; this will be the /opt/egurkha/lib/jtm folder) of that host.
Target of the test : A Java application
Agent deploying the test : An internal/remote agent
Outputs of the test : One set of results for each configured URL pattern
| Parameter | Description |
|
Test period |
How often should the test be executed |
|
Host |
The host for which the test is to be configured. |
|
Port |
The port number at which the specified host listens; if Java Transaction Monitoring is enabled for the target Java application, then the JTM port has to be specified here |
|
JTM Port |
Specify the port number configured as the JTM_Port in the jtmConn.props file described in the procedure outlined above. |
|
URL Patterns |
Provide a comma-separated list of the URL patterns of web requests/transactions to be monitored. The format of your specification should be as follows: <DisplayName_of_Pattern>:<Transaction_Pattern>. For instance, your specification can be: login:*log*,ALL:*,pay:*pay* |
|
Filtered URL Patterns |
Provide a comma-separated list of the URL patterns of transactions/web requests to be excluded from the monitoring scope of this test. For example, *blog*,*paycheque* |
|
Slow URL Threshold |
The Slow transactions measure of this test will report the number of transactions (of the configured patterns) for which the response time is higher than the value (in seconds) specified here. |
|
Method Exec Cutoff |
The detailed diagnosis of the Slow transactions measure allows you to drill down to a URL tree, where the methods invoked by a chosen transaction are listed in the descending order of their execution time. By configuring an execution duration (in seconds) here, you can have the URL Tree list only those methods that have been executing for a duration greater the specified value. For instance, if you specify 5 here, the URL tree for a transaction will list only those methods that have been executing for over 5 seconds, thus shedding light on the slow method calls alone. |
|
Max Slow URLs per Test period |
Specify the number of top-n transactions (of a configured pattern) that should be listed in the detailed diagnosis of the Slow transactions measure, every time the test runs. By default, this is set to 10, indicating that the detailed diagnosis of the Slow transactions measure will by default list the top-10 transactions, arranged in the descending order of their response times. |
|
Max Error URLs per Test period |
Specify the number of top-n transactions (of a configured pattern) that should be listed in the detailed diagnosis of the Error transactions measure, every time the test runs. By default, this is set to 10, indicating that the detailed diagnosis of the Error transactions measure will by default list the top-10 transactions, in terms of the number of errors they encountered. |
|
DD Frequency |
Refers to the frequency with which detailed diagnosis measures are to be generated for this test. The default is 1:1. This indicates that, by default, detailed measures will be generated every time this test runs, and also every time the test detects a problem. You can modify this frequency, if you so desire. Also, if you intend to disable the detailed diagnosis capability for this test, you can do so by specifying none against this parameter. |
|
Detailed Diagnosis |
To make diagnosis more efficient and accurate, the eG Enterprise embeds an optional detailed diagnostic capability. With this capability, the eG agents can be configured to run detailed, more elaborate tests as and when specific problems are detected. To enable the detailed diagnosis capability of this test for a particular server, choose the On option. To disable the capability, click on the Off option. The option to selectively enable/disable the detailed diagnosis capability will be available only if the following conditions are fulfilled:
|
| Measurement | Description | Measurement Unit | Interpretation |
|---|---|---|---|
|
Total transactions |
Indicates the total number of transactions of this pattern that the target application handled during the last measurement period. |
Number |
|
|
Avg. response time |
Indicates the average time taken by the transactions of this pattern to complete execution. |
Secs |
Compare the value of this measure across patterns to isolate the type of transactions that were taking too long to execute. You can then take a look at the values of the other measures to figure out where the transaction is spending too much time. |
|
Slow transactions |
Indicates the number of transactions of this pattern that were slow during the last measurement period. |
Number |
This measure will report the number of transactions with a response time higher than the configured slow url threshold. A high value is a cause for concern, as too many slow transactions to an application can significantly damage the user experience with that application. Use the detailed diagnosis of this measure to know which transactions are slow. |
|
Slow transactions response time |
Indicates the average time taken by the slow transactions of this pattern to execute. |
Secs |
|
|
Error transactions |
Indicates the number of transactions of this pattern that experienced errors during the last measurement period. |
Number |
A high value is a cause for concern, as too many error-prone transactions to an application can significantly damage the user experience with that application. Use the detailed diagnosis of this measure to isolate the error transactions. |
|
Error transactions response time |
Indicates the average duration for which the transactions of this pattern were processed before an error condition was detected. |
Secs |
|
|
Filters |
Indicates the number of filters that were accessed by the transactions of this pattern during the last measurement period. |
Number |
A filter is a program that runs on the server before the servlet or JSP page with which it is associated. |
|
Filters response time |
Indicates the average time spent by the transactions of this pattern at the Filters layer. |
Secs |
Typically, the init, doFilter, and destroy methods are called at the Filters layer. Issues in these method invocations can increase the time spent by a transaction in the Filters Java component. Compare the value of this measure across patterns to identify the transaction pattern that spent the maximum time with the Filters component. If one/more transactions of a pattern are found to be slow, then, you can compare the value of this measure with the other response time values reported by this test to determine where the slowdown actually occurred - in the filters, in JSPs, in servlets, in struts, in exception handling, when executing JDBC/SQL queries, when sending Java mails, or when accessing POJOs. |
|
JSPs accessed |
Indicates the number of JSPs accessed by the transactions of this pattern during the last measurement period. |
Number |
|
|
JSPs response time |
Indicates the average time spent by the transactions of this pattern at the JSP layer. |
Secs |
Compare the value of this measure across patterns to identify the transaction pattern that spent the maximum time in JSPs. If one/more transactions of a pattern are found to be slow, then, you can compare the value of this measure with the other response time values reported by this test to determine where the slowdown actually occurred - in the filters, in JSPs, in servlets, in struts, in exception handling, when executing JDBC/SQL queries, when sending Java mails, or when accessing POJOs.. |
|
HTTP Servlets Accessed |
Indicates the number of HTTP servlets that were accessed by the transactions of this pattern during the last measurement period. |
Number |
|
|
HTTP servlets response time |
Indicates the average time taken by the HTTP servlets for processing the HTTP requests of this pattern. |
Secs |
Badly written servlets can take too long to execute, and can hence obstruct the smooth execution of the dependent transactions. By comparing the value of this measure across patterns, you can figure out which transaction pattern is spending the maximum time in Servlets. If one/more transactions of a pattern are found to be slow, then, you can compare the value of this measure with the other response time values reported by this test to determine where the slowdown actually occurred - in the filters, in JSPs, in servlets, in struts, in exception handling, when executing JDBC/SQL queries, when sending Java mails, or when accessing POJOs. |
|
Generic servlets accessed |
Indicates the number of generic (non-HTTP) servlets that were accessed by the transactions of this pattern during the last measurement period. |
Number |
|
|
Generic servlets response time |
Indicates the average time taken by the generic (non-HTTP) servlets for processing transactions of this pattern. |
Secs |
Badly written servlets can take too long to execute, and can hence obstruct the smooth execution of the dependent transactions. By comparing the value of this measure across patterns, you can figure out which transaction pattern is spending the maximum time in Servlets. If one/more transactions of a pattern are found to be slow, then, you can compare the value of this measure with the other response time values reported by this test to determine where the slowdown actually occurred - in the filters, in JSPs, in servlets, in struts, in exception handling, when executing JDBC/SQL queries, when sending Java mails, or when accessing POJOs. |
|
JDBC queries |
Indicates the number of JDBC statements that were executed by the transactions of this pattern during the last measurement period. |
Number |
The methods captured by the eG JTM Monitor from the Java class for the JDBC sub-component include: Commit(), rollback(..), close(),GetResultSet(), executeBatch(), cancel(), connect(String, Properties), getConnection(..),getPooledConnection(..) |
|
JDBC response time |
Indicates the average time taken by the transactions of this pattern to execute JDBC statements. |
Secs |
By comparing the value of this measure across patterns, you can figure out which transaction pattern is taking the most time to execute JDBC queries. If one/more transactions of a pattern are found to be slow, then, you can compare the value of this measure with the other response time values reported by this test to determine where the slowdown actually occurred - in the filters, in JSPs, in servlets, in struts, in exception handling, when executing JDBC/SQL queries, when sending Java mails, or when accessing POJOs. |
|
SQL statements executed |
Indicates the number of SQL queries executed by the transactions of this pattern during the last measurement period. |
Number |
|
|
SQL statement time avg |
Indicates the average time taken by the transactions of this pattern to execute SQL queries. |
Secs |
Inefficient queries can take too long to execute on the database, thereby significantly delaying the responsiveness of the dependent transactions. To know which transactions have been most impacted by such queries, compare the value of this measure across the transaction patterns. If one/more transactions of a pattern are found to be slow, then, you can compare the value of this measure with the other response time values reported by this test to determine where the slowdown actually occurred - at the filters layer, JSPs layer, servlets layer, struts layer, in exception handling, when executing JDBC/SQL queries, when sending Java mails, or when accessing POJOs. |
|
Exceptions seen |
Indicates the number of exceptions encountered by the transactions of this pattern during the last measurement period. |
Number |
Ideally, the value of this measure should be 0. |
|
Exceptions response time |
Indicates the average time which the transactions of this pattern spent in handling exceptions. |
Secs |
If one/more transactions of a pattern are found to be slow, then, you can compare the value of this measure with the other response time values reported by this test to determine where the slowdown actually occurred - at the filters layer, JSPs layer, servlets layer, struts layer, in exception handling, when executing JDBC/SQL queries, when sending Java mails, or when accessing POJOs. |
|
Struts accessed |
Indicates the number of struts accessed by the transactions of this pattern during the last meaurement period. |
Number |
The Struts framework is a standard for developing well-architected Web applications.
|
|
Struts response time |
Indicates the average time spent by the transactions of this pattern at the Struts layer. |
Secs |
If you compare the value of this measure across patterns, you can figure out which transaction pattern spent the maximum time in Struts. If one/more transactions of a pattern are found to be slow, then, you can compare the value of this measure with the other response time values reported by this test to determine where the slowdown actually occurred - in the filters, in JSPs, in servlets, in struts, in exception handling, when executing JDBC/SQL queries, when sending Java mails, or when accessing POJOs. |
|
Java mails |
Indicates the number of mails sent by the transactions of this pattern during the last measurement period, using the Java mail API. |
Number |
The eG JTM Monitor captures any mail that has been sent from the monitored application using Java Mail API. Mails sent using other APIs are ignored by the eG JTM Monitor. |
|
Java mail API time |
Indicates the average time taken by the transactions of this pattern to send mails using the Java mail API. |
Secs |
If one/more transactions of a pattern are found to be slow, then, you can compare the value of this measure with the other response time values reported by this test to determine where the slowdown actually occurred - in the filters, in JSPs, in servlets, in struts, in exception handling, when executing JDBC/SQL queries, when sending Java mails, or when accessing POJOs. |
|
POJOs |
Indicates the number of transactions of this pattern that accessed POJOs during the last measurement period. |
Number |
Plain Old Java Object (POJO) refers to a 'generic' method in JAVA Language. All methods that are not covered by any of the Java components (eg., JSPs, Struts, Servlets, Filters, Exceptions, Queries, etc.) discussed above will be automatically included under POJO. When reporting the number of POJO methods, the eG agent will consider only those methods with a response time value that is higher than the threshold limit configured against the method exec cutoff parameter. |
|
POJO avg. access time |
Indicates the average time taken by the transactions of this pattern to access POJOs. |
Secs |
If one/more transactions of a pattern are found to be slow, then, you can compare the value of this measure with the other response time values reported by this test to determine where the slowdown actually occurred - in the filters, in JSPs, in servlets, in struts, in exception handling, when executing JDBC/SQL queries, when sending Java mails, or when accessing POJOs. |
|
HTTP calls |
Indicates the number of HTTP calls made by transactions of this pattern. |
Number |
|
|
Web service calls |
Indicates the number of calls made by the transactions of this pattern to web services. |
Number |
|
|
HTTP avg. call time |
Indicates the average time taken by the transactions of this pattern to make the HTTP calls. |
Secs |
In the event of a transaction slowdown, you can compare the value of this measure with the other response time values reported for this transaction pattern to know whether the HTTP calls could have delayed transaction execution. |
|
Web service avg. call time |
Indicates the average time taken by the transactions of this pattern to make web service calls. |
Secs |
In the event of a transaction slowdown, you can compare the value of this measure with the other response time values reported for this transaction pattern to know whether the web service calls could have delayed transaction execution. |
The detailed diagnosis of the Slow transactions measure lists the top-10 (by default) transactions of a configured pattern that have violated the response time threshold set using the slow url threshold parameter of this test. Against each transaction, the date/time at which the transaction was initiated/requested will be displayed. Besides the request date/time, the remote host from which the transaction request was received and the total response time of the transaction will also be reported. This response time is the sum total of the response times of each of the top methods (in terms of time taken for execution) invoked by that transaction. To compute this sum total, the test considers only those methods with a response time value that is higher than the threshold limit configured against the method exec cutoff parameter.
In the detailed diagnosis, the transactions will typically be arranged in the descending order of the total response time; this way, you would be able to easily spot the slowest transaction. To know what caused the transaction to be slow, you can take a look at the subcomponent details column of the detailed diagnosis. Here, the time spent by the transaction in each of the Java components (FILTER, STRUTS, servlets, jsps, pojos, sql, jdbc, etc.) will be listed, thus leading you to the exact Java component where the slowdown occurred.
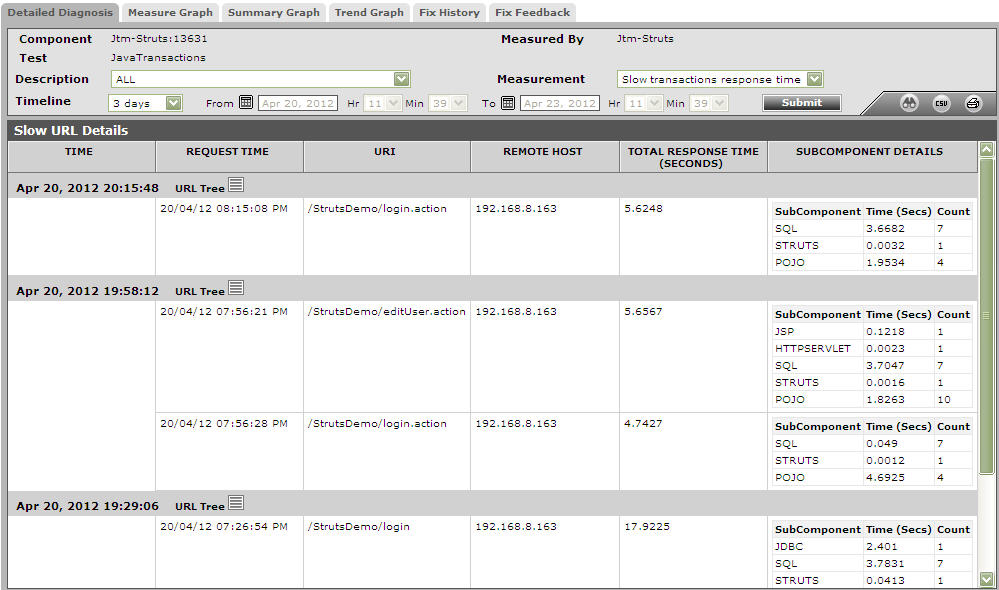
Figure 247 : The detailed diagnosis of the Slow transactions measure
Note:
If the target server is running in a time zone different from the time zone preference of the user who is currently logged into the eG management console, then you are sure to notice significant discrepancies in the request time of the transactions displayed in the Detailed Diagnosis and the time at which the eG agent collected the detailed measures – i.e, the time display in the Detailed Diagnosis page of Figure 247.
You can even perform detailed method-level analysis to isolate the methods taking too long to execute. For this, click on the URL Tree link. Figure 248 will then appear. In the left panel of Figure 248, you will find the list of transactions that match a configured pattern; these transactions will be sorted in the descending order of their Total Response Time (by default). This is indicated by the Total Response Time option chosen by default from the Sort by list in Figure 248. If you select a transaction from the left panel, an At-A-Glance tab page will open by default in the right panel, providing quick, yet deep insights into the performance of the chosen transaction and the reasons for its slowness. This tab page begins by displaying the URL of the chosen transaction, the total Response time of the transaction, the time at which the transaction was last requested, and the Remote Host from which the request was received.
If the Response time appears to be very high, then you can take a look at the Method Level Breakup section to figure out which method called by which Java component (such as FILTER, STRUTS, servlets, jsps, pojos, sql, jdbc, etc.) could have caused the slowdown. This section provides a horizontal bar graph, which reveals the percentage of time for which the chosen transaction spent executing each of the top methods (in terms of execution time) invoked by it. The legend below clearly indicates the top methods and the layer/sub-component that invoked each method. Against every method, the number of times that method was invoked in the Measurement Time, the Duration (in Secs) for which the method executed, and the percentage of the total execution time of the transaction for which the method was in execution will be displayed, thus quickly pointing you to those methods that may have contributed to the slowdown. The methods displayed here and featured in the bar graph depend upon the method exec cutoff configuration of this test - in other words, only those methods with an execution duration that exceeds the threshold limit configured against method exec cutoff will be displayed in the Method Level Breakup section.
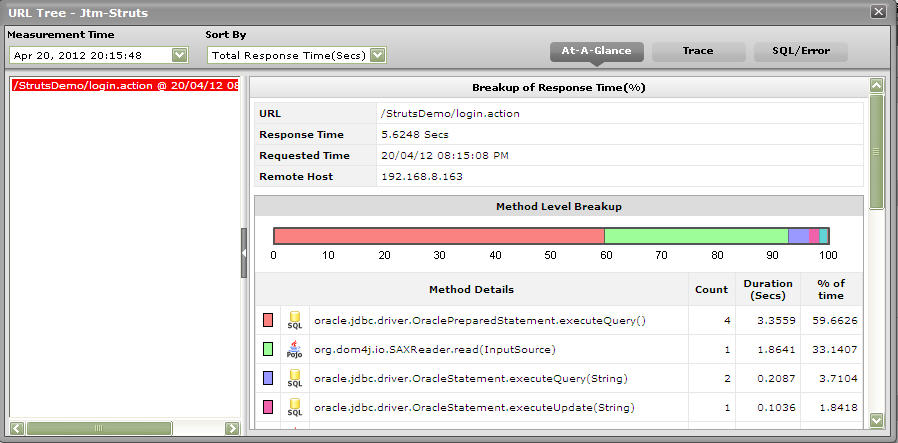
Figure 248 : The Method Level Breakup section in the At-A-Glance tab page
While the Method Level Breakup section provides method-level insights into responsiveness, for a sub-component or layer level breakup of responsiveness scroll down the At-A-Glance tab to view the Component Level Breakup section (see Figure 249). Using this horizontal bar graph, you can quickly tell where - i.e., in which Java component - the transaction spent the maximum time. A quick glance at the graph's legend will reveal the Java components the transaction visited, the number of methods invoked by Java component, the Duration (Secs) for which the transaction was processed by the Java component, and what Percentage of the total transaction response time was spent in the Java component.
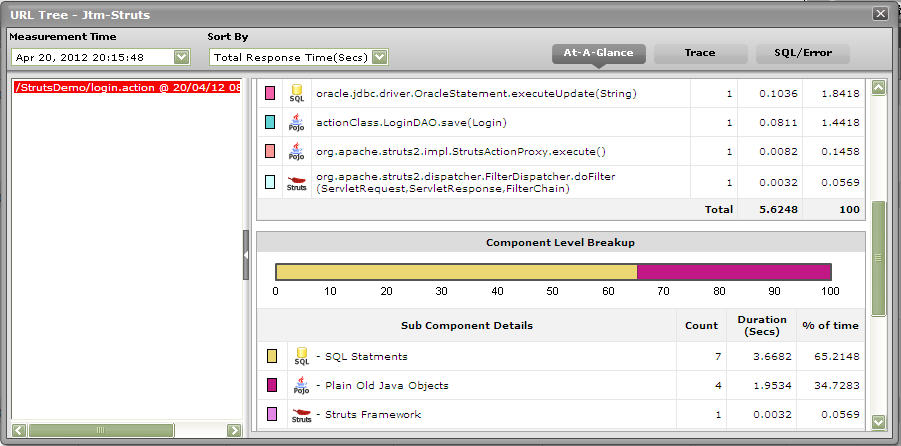
Figure 249 : The Component Level Breakup section in the At-A-Glance tab page
Besides Java methods, where the target Java application interacts with the database, long-running SQL queries can also contribute to the poor responsiveness of a transaction. You can use the At-A-Glance tab page to determine whether the transaction interacts with the database or not, and if so, how healthy that interaction is. For this, scroll down the At-A-Glance tab page.
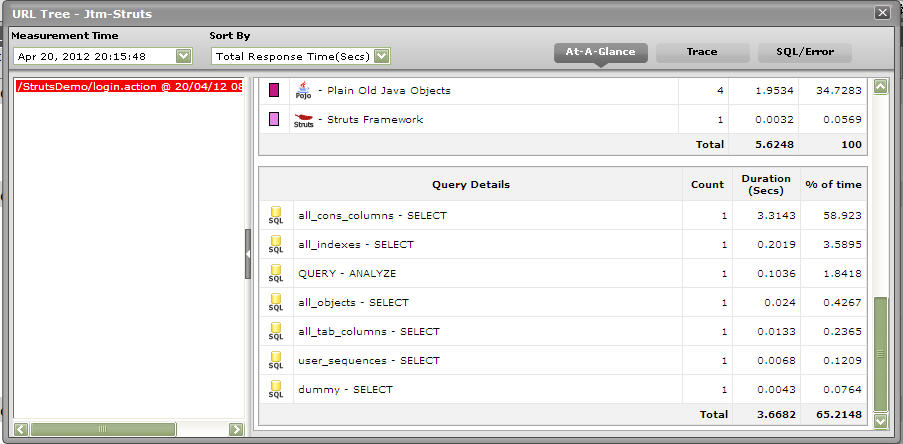
Figure 250 : Query Details in the At-A-Glance tab page
Upon scrolling, you will find query details below the Component Level Breakup section. All the SQL queries that the chosen transaction executes on the backend database will be listed here in the descending order of their Duration. Corresponding to each query, you will be able to view the number of times that query was executed, the Duration for which it executed, and what percentage of the total transaction response time was spent in executing that query. A quick look at this tabulation would suffice to identify the query which executed for an abnormally long time on the database, causing the transaction's responsiveness to suffer. For a detailed query description, click on the query. Figure 251 will then pop up displaying the complete query and its execution duration.
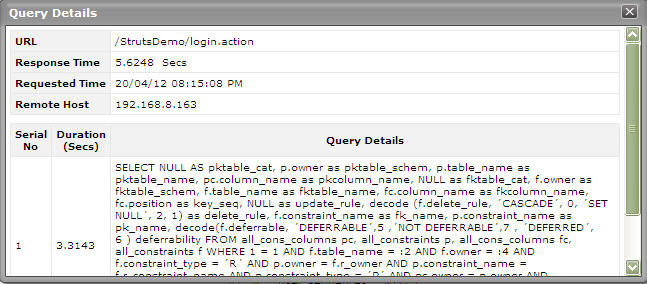
Figure 251 : Detailed description of the query clicked on
This way, the At-A-Glance tab page allows you to analyze, at-a-glance, all the factors that can influence transaction response time - be it Java methods, Java components, and SQL queries - and enables you to quickly diagnose the source of a transaction slowdown. If, for instance, you figure out that a particular Java method is responsible for the slowdown, you can zoom into the performance of the 'suspect method' by clicking on that method in the Method Level Breakup section of the At-A-Glance tab page. This will automatically lead you to the Trace tab page, where all invocations of the chosen method will be highlighted (see Figure 252).
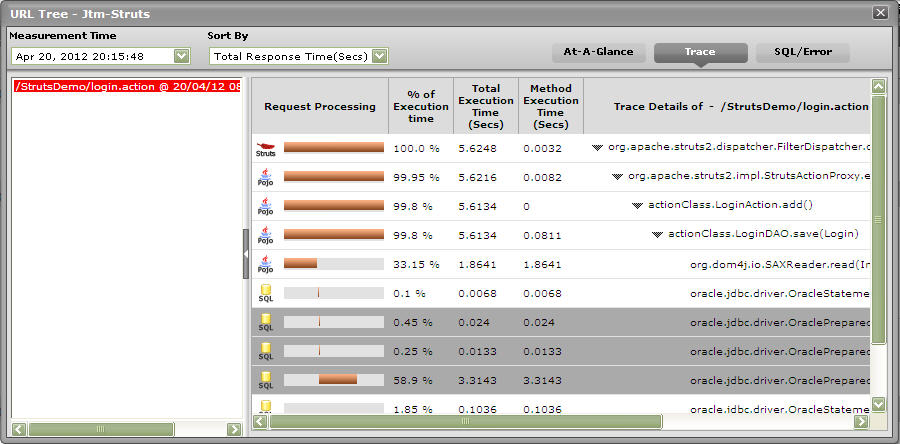
Figure 252 : The Trace tab page displaying all invocations of the method chosen from the Method Level Breakup section
Typically, clicking on the Trace tab page will list all the methods invoked by the chosen transaction, starting with the very first method. Methods and sub-methods (a method invoked within a method) are arranged in a tree-structure, which can be expanded or collapsed at will. To view the sub-methods within a method, click on the arrow icon that precedes that method in the Trace tab page. Likewise, to collapse a tree, click once again on the arrow icon. Using the tree-structure, you can easily trace the sequence in which methods are invoked by a transaction.
If a method is chosen for analysis from the Method Level Breakup section of the At-A-Glance tab page, the Trace tab page will automatically bring your attention to all invocations of that method by highlighting them (as shown by Figure 252). Likewise, if a Java component is clicked in the Component Level Breakup section of the At-A-Glance section, the Trace tab page will automatically appear, displaying all the methods invoked from the chosen Java component (as shown by Figure 253).
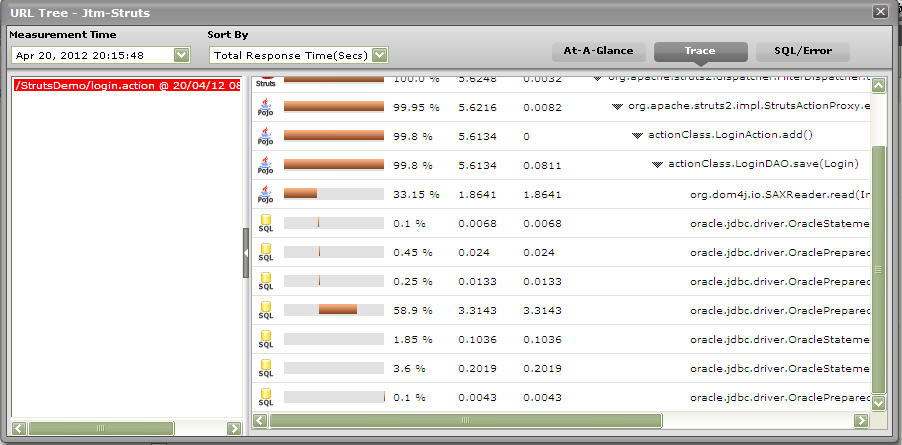
Figure 253 : The Trace tab page displaying all methods invoked at the Java layer/sub-component chosen from the Component Level Breakup section
For every method, the Trace tab page displays a Request Processing bar, which will accurately indicate when, in the sequence of method invocations, the said method began execution and when it ended; with the help of this progress bar, you will be able to fairly judge the duration of the method, and also quickly tell whether any methods were called prior to the method in question. In addition, the Trace tab page will also display the time taken for a method to execute (Method Execution Time) and the percentage of the time the transaction spent in executing that method. The most time-consuming methods can thus be instantly isolated.
The Trace tab page also displays the Total Execution Time for each method - this value will be the same as the Method Execution Time for 'stand-alone' methods - i.e., methods without any sub-methods. In the case of methods with sub-methods however, the Total Execution Time will be the sum total of the Method Execution Time of each sub-method invoked within. This is because, a 'parent' method completes execution only when all its child/sub-methods finish executing.
With the help of the Trace tab page therefore, you can accurately trace the method that takes the longest to execute, when that method began execution, and which 'parent method' (if any) invoked the method.
Next, click on the SQL/Errors tab page. This tab page lists all the SQL queries the transaction executes on its backend database, and/or all the errors detected in the transaction's Java code. The query list (see Figure 254) is typically arranged in the descending order of the query execution Duration, and thus leads you to the long-running queries right away! You can even scrutinize the time-consuming query on-the-fly, and suggest improvements to your administrator instantly.
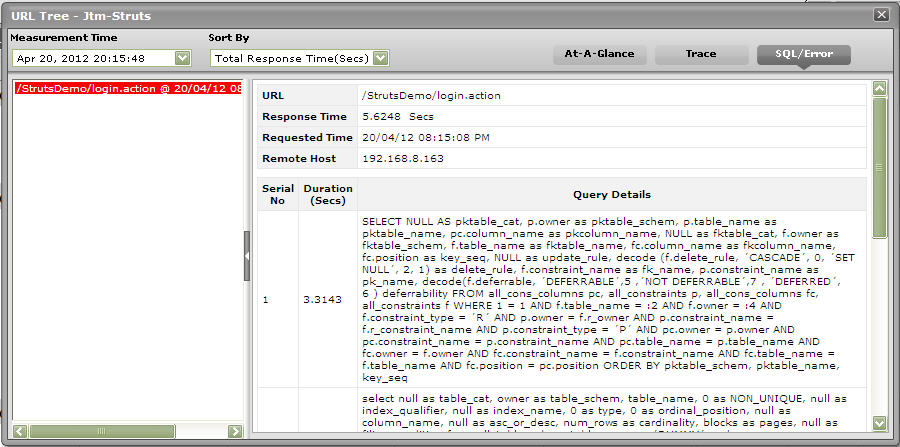
Figure 254 : Queries displayed in the SQL/Error tab page
When displaying errors, the SQL/Error tab page does not display the error message alone, but displays the complete code block that could have caused the error to occur. By carefully scrutinizing the block, you can easily zero-in on the 'exact line of code' that could have forced the error - this means that besides pointing you to bugs in your code, the SQL/Error tab page also helps you initiate measures to fix the same.
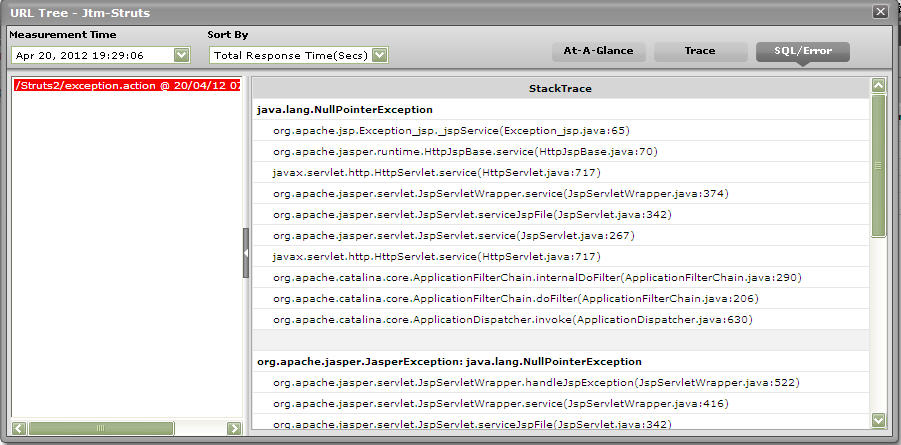
Figure 255 : Errors displayed in the SQL/Error tab page
This way, with the help of the three tab pages - At-A-Glance, Trace, and SQL/Error - you can effectively analyze and accurately diagnose the root-cause of slowdowns in transactions to your Java applications.
The detailed diagnosis of the Error transactions measure reveals the top-10 (by default) transactions, in terms of total response time, that have encountered errors. To know the nature of the errors that occurred, click on the url Tree icon in Figure 256. This will lead you to the URL Tree window, which has already been elaborately discussed.
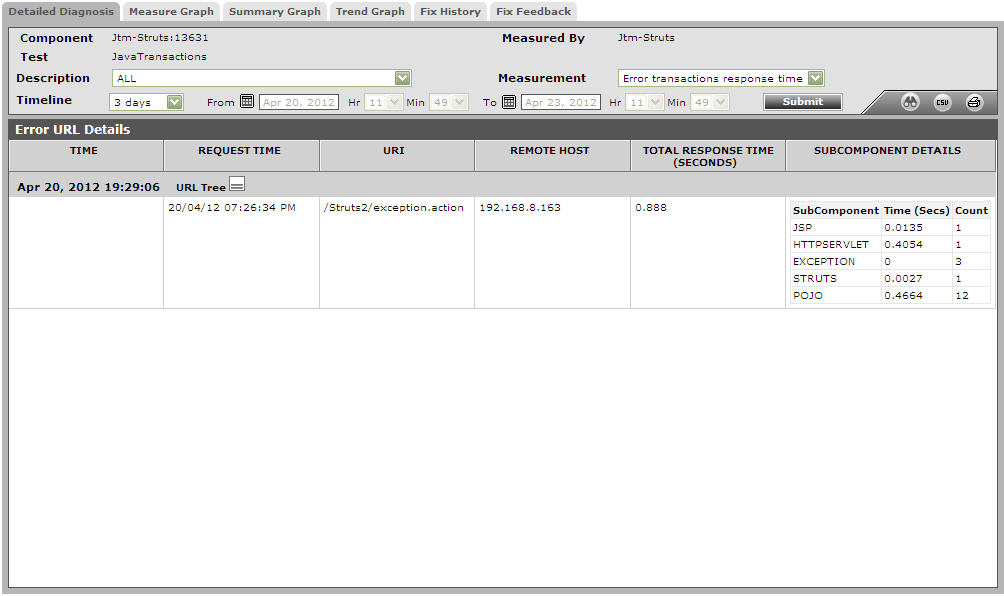
Figure 256 : The detailed diagnosis of the Error transactions measure